Welcome to VanEck
Select Investor Type
28 October 2026
From time to time the macroeconomic forces driving financial markets shift, altering the established relationships and correlations between different investments. Just such a regime change began in March 2020 with the Covid-19 pandemic policy response, ending the low inflation regime that had dominated asset prices for the previous 20 years.
The first article in this series showed that the negative equity-bond correlation of 2000–2021 – when equity and bond prices tended to move in opposite directions – broke down in 2022 with rising inflation. Notably, we showed that the three forces behind today's inflation — demographic reversal, fiscal dominance and multipolar fragmentation — are structural and likely to be persistent. This sank the assumption underpinning the rules of portfolio diversification: that a diversified portfolio of equities and bonds would dampen market volatility.
Our second article revealed a further factor undermining traditional portfolio construction. It showed that the equity core of most investors’ portfolios has, in fact, become a concentrated position in US technology, whether they choose it or not.
This article is about how you can adapt your portfolio to the regime change we describe.
To see why you need a new way to diversify, go back to basics. In the traditional 60/40 portfolio — 60% equities, 40% bonds — the bonds did two jobs. Firstly, they cushioned growth shocks: when recession fears hit equities, bond yields fell and their prices rose. And, secondly, they cushioned inflation, or at least appeared to, because for two decades inflation was low and falling and bonds could only benefit. They still do the first job, but not the second. In the growth scare of August 2024, a weak US jobs report sent the S&P 500 sliding 8.5% from its July peak and the 10-year Treasury yield fell from 4.23% to 3.78% as bond prices rose. But during 2022’s inflation shock, bond prices fell alongside equities and the more bonds you held the more you lost.
That means something else in your portfolio must take on the job of shielding it from higher inflation. That is the role of a satellite held alongside your portfolio’s stock-bond core. Given the concentration described in our second article, the satellite should also add return sources that do not depend on the handful of stocks that now dominate that core.
While the 2000-2021 regime was long thought the rule, a glance back to the 20th century shows in fact it was the exception. The nearest precedent for today’s regime is the 1970s, and the record from that decade is unambiguous. From August 1971, when President Nixon ended the dollar’s peg to gold, to the end of 1979, gold returned +23.5% a year in real terms, after inflation. Meanwhile, broad commodities rose +14.1% in real terms, defense stocks returned +11.3%, mining +5.5% and energy +5.4%. Over the same period the 10-year Treasury lost 2.7% a year in real terms, the US equity market lost 1.4% and listed real estate lost 8.6%1. Reputed safety assets would have eroded your capital; yet scarce, physical assets compounded it.
We use US data throughout this article, for a simple reason: only the US has consistent return series that reach back to the 1970s, and mixing sources across regimes would blur the comparison. Our point is about the pattern of returns rather than the precise numbers, which for a euro-based investor will differ by exchange rate and inflation base.
But was the 1970s pattern an accident specific to that decade or characteristic of a regime that at least rhymes with today even if it does not exactly repeat? The years since March 2020 — the start of the pandemic policy response and, in our view, the ignition point of the current regime — are the test.
Exhibit A: Scarcity Was Rewarded, Paper Claims Were Not
Real Annualized Return vs. Correlation to the S&P 500, March 2020 – September 2026
Colour shows what an asset is; the rings show what it did to a 60/40 portfolio.
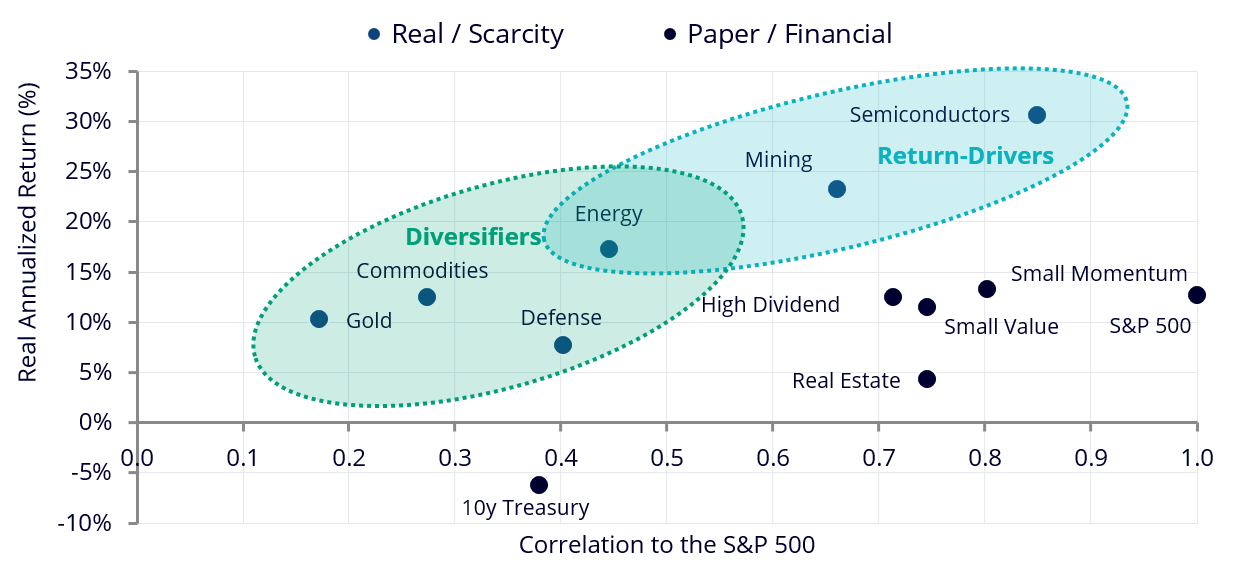
Real (CPI-deflated) annualized return plotted against correlation to the S&P 500, month-end data, March 2020 to September 2026. Dark points are real or scarcity-linked assets; grey points are financial assets. Source: S&P Dow Jones Indices, Fama-French, FRED, Robert J. Shiller; VanEck calculations.
What the chart above (exhibit A) shows is the pattern held. The strongest real returns over the six years came from supply-constrained assets — semiconductors, mining and energy — all well clear of the US S&P 500 index's own +12.7% a year. Gold and broad commodities roughly matched the index while moving largely independently of it, with correlations below 0.3. Defense equities sat between the two groups: a weak 2026 left their return below the broader index, but still well ahead of inflation. Their correlation to the index stayed well below that of most equity sectors, partly because demand is set by government budgets and multi-year commitments rather than by the economic cycle. The 10-year US Treasury bond failed on both counts, losing 6.2% a year in real terms while correlating 0.38 with equities2. As in the 1970s, scarcity was rewarded and long-duration paper claims were not.
These are the six assets we model as a satellite below, and how they were chosen matters. Five of the six — gold, broad commodities, defense, mining and energy — are the assets that worked in the 1970s. That evidence led to their selection, not the results above. The exception is semiconductor equities, which have no 1970s equivalent and which we include due to regime logic rather than precedent: they are capital-intensive assets, where geopolitically bottlenecked supply meets policy-driven demand.
As the chart below (exhibit B) shows, the satellite’s assets do two different jobs: some diversify risk, others drive return.
Exhibit B: What the Satellite Assets Do
Adding Satellite Assets Individually (10% Each) to a 60/40 Core
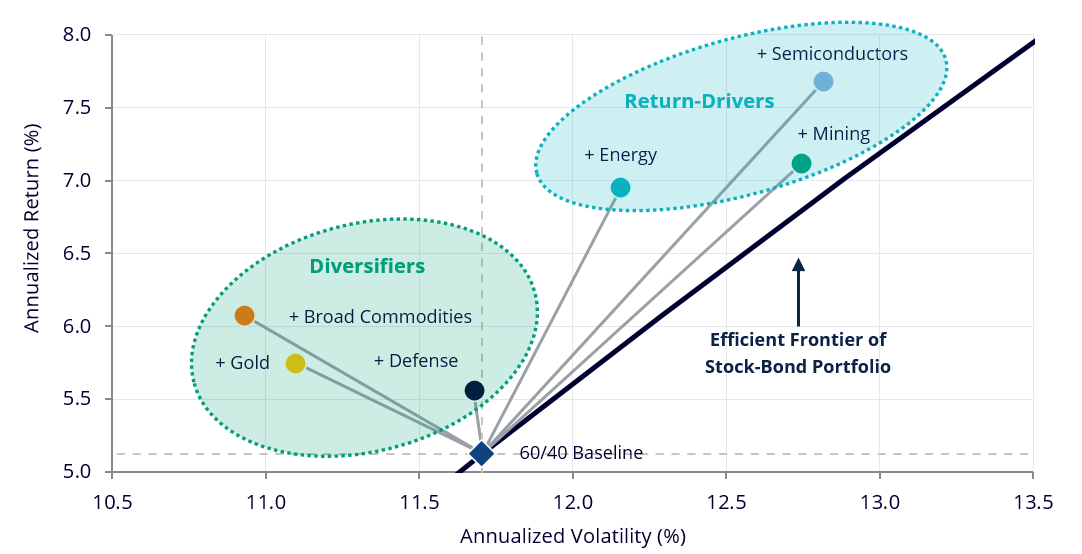
Real annualized return against annualized volatility for a 60/40 stock-bond portfolio and for the same portfolio with a 10% allocation to each satellite added individually, March 2020 to September 2026, quarterly rebalancing. Satellite-enhanced portfolios are hypothetical, simulated combinations. Source: S&P Dow Jones Indices, Fama-French, FRED, Robert J. Shiller; VanEck calculations.
When added to the 60/40 baseline portfolio, each satellite asset improves return per unit of risk. But they do it in two distinct ways. Gold, broad commodities and defense move the portfolio up the chart and to the left: higher return with slightly lower volatility. These are diversifiers — they do the job bonds used to do. Semiconductors, mining and energy move it up and to the right: delivering markedly higher returns, at some cost in volatility. These are return drivers. They do not protect the overall portfolio; they add a source of growth that the core, for all its concentration, is not providing.
The distinction matters for how you size each of these asset types. It also matters for what you hold in your portfolio’s core. For instance, semiconductors overlap heavily with the 10 largest stocks, which made up 41% of the S&P 500 index at the end of 2025. A semiconductor holding in your satellite on top of a capitalization-weighted index core doubles up on tech, compounding a bet you may not have meant to make. On top of an equal-weighted core, though, it becomes a deliberate position of a size you chose.
To test the portfolio satellite as a whole rather than one asset at a time, we took three stock-bond baseline portfolio allocations — a conservative 40/60, a balanced 60/40 and an aggressive 80/20 — and replaced 30% of each with a satellite sleeve of the six assets. At the balanced midpoint, the sleeve is equal-weighted. For the aggressive profile, it tilts toward return-drivers, mirroring the higher equity weight. For the conservative profile, it tilts toward diversifiers3.
We then looked at the maximum drawdown – fall from peak to trough – from March 2020 to September 2026. The result is striking and emphasizes how the rules of diversification have changed.
Exhibit C: Maximum Drawdown, Baseline vs. Satellite-Enhanced
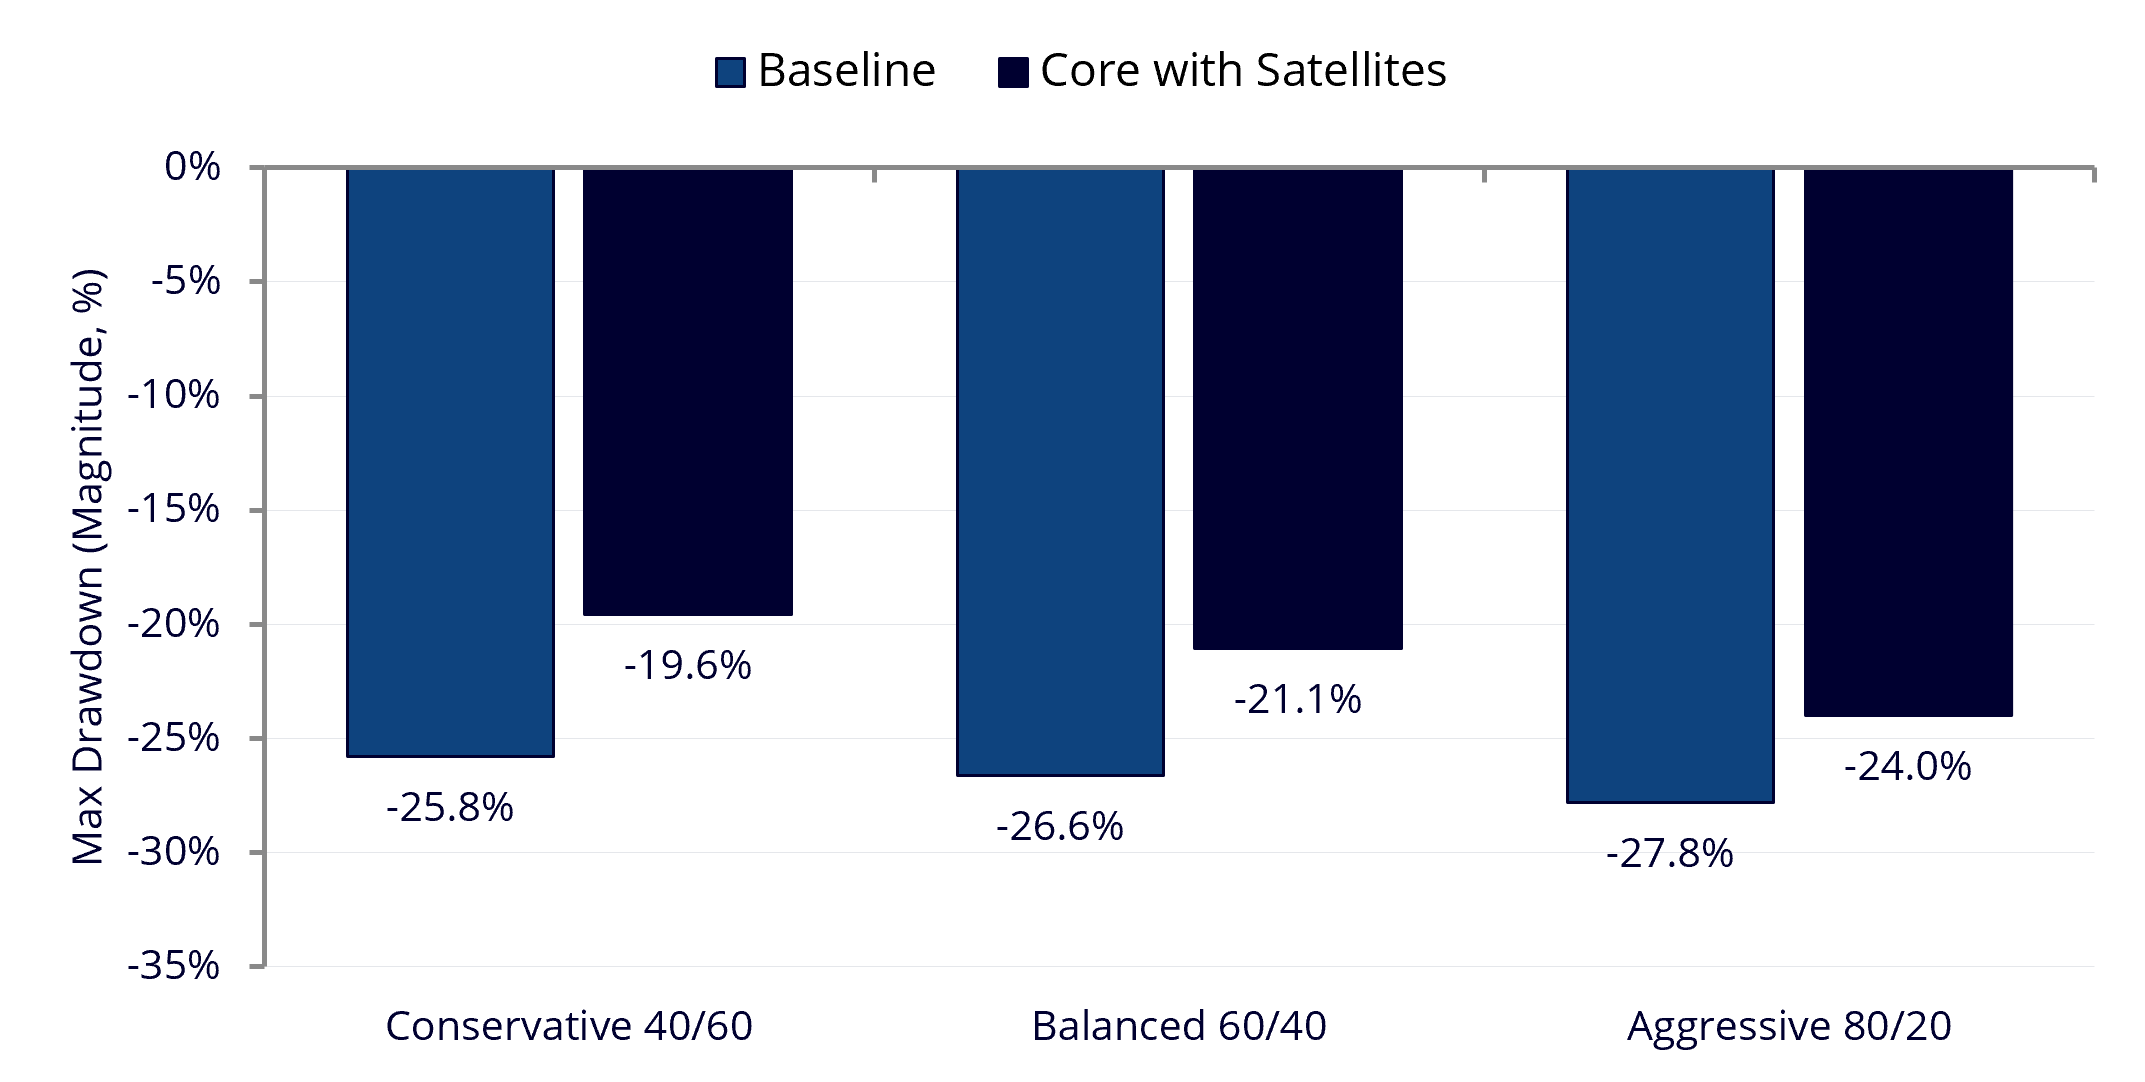
Maximum real drawdown, daily data, 2 March 2020 to 30 September 2026, quarterly rebalancing. Baseline is S&P 500 and 10-year US Treasury at the stated weights; enhanced is core plus a 30% satellite sleeve. Satellite-enhanced portfolios are hypothetical, simulated combinations. Source: S&P Dow Jones Indices, Fama-French, FRED, Robert J. Shiller; VanEck calculations.
The three baseline portfolios barely differ. The conservative 40/60 fell 25.8% at worst; the balanced 60/40 fell 26.6%; the aggressive 80/20 fell 27.8%. Holding more bonds bought almost no protection, because stocks and bonds fell together when the drawdown struck. Yet our new satellite portfolio did what the bonds could not: it cut the maximum drawdown by 6.2 percentage points at 40/60, 5.6 at 60/40 and 3.8 at 80/20. The protection came from the satellite, and within the satellite from the diversifiers.
Return per unit of risk improved in every baseline profile too. The return-to-volatility ratio rose from 0.44 to 0.77 for the balanced portfolio and from 0.63 to 0.88 for the aggressive one. The conservative profile improved most, from 0.14 to 0.58 — because the old baseline portfolio had held most of the bond sleeve the new satellite replaces3.
Past performance is not a reliable indicator of future results. The satellite-enhanced portfolios are hypothetical and simulated; they do not represent any actual portfolio or VanEck product.
The traditional lifecycle rule has one lever: as you age, equities go down and bonds go up. That lever still works for the job bonds still do. But if bonds no longer protect against inflation, an investor approaching retirement needs a second lever.
Exhibit D: Modern Lifecycle Investing: Two Levers
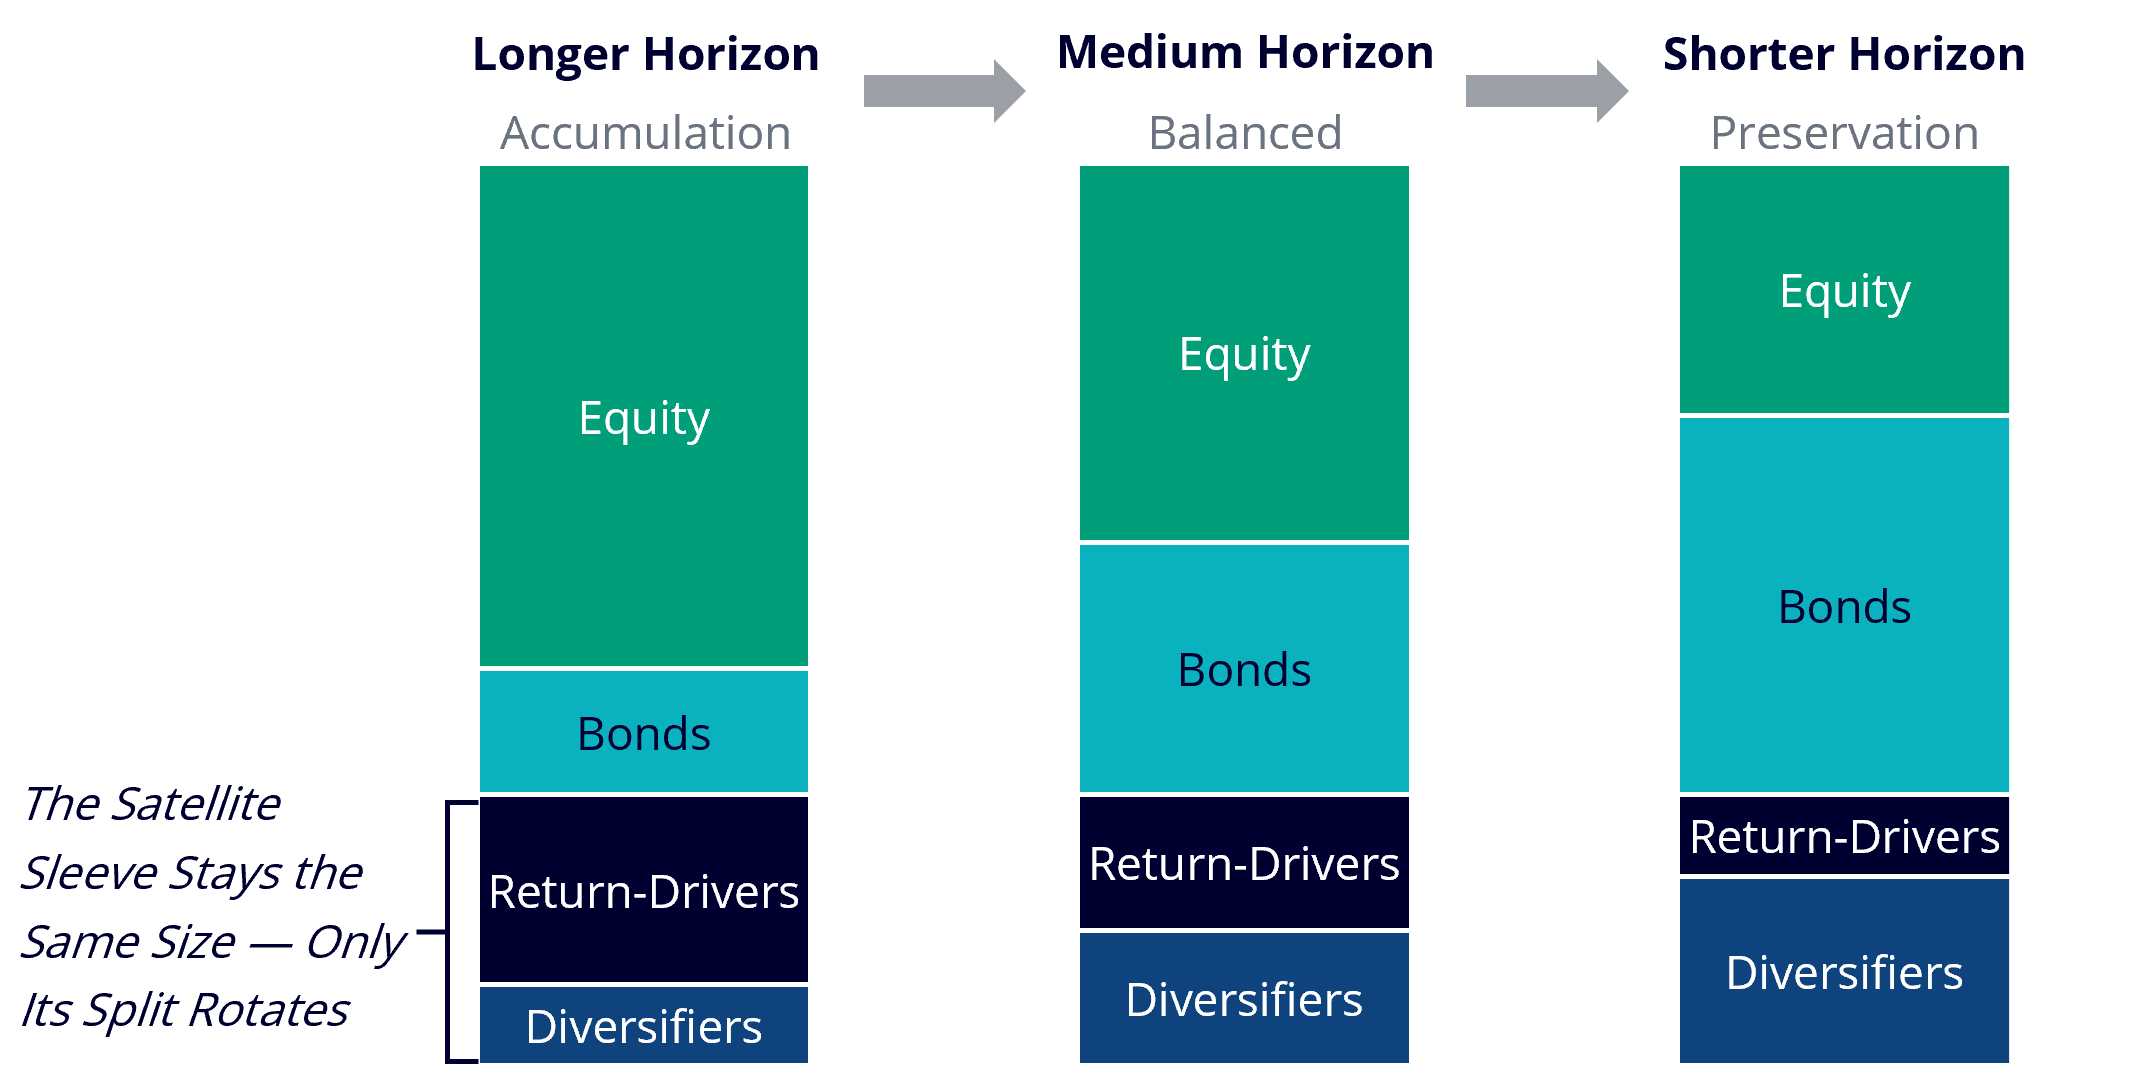
Illustrative allocation across three time horizons. The satellite sleeve stays the same size; its split rotates from return-drivers toward diversifiers as the horizon shortens. Not investment advice; allocations depend on individual circumstances.
The second lever is the split within the satellite (see exhibit D). With a long horizon, the satellite leans toward return-drivers — the portfolio has decades to absorb volatility and needs growth. As the horizon shortens, it rotates toward diversifiers, taking over the inflation-protection role bonds used to fill. The size of the satellite need not change; what it holds does.
Why should volatility, rather than return, drive that shift? Take three hypothetical paths that each average 6% a year in real terms — arithmetically, not compounded. The first delivers 6% every year and turns 100 into 321 over 20 years. The second alternates +26% and −14%, roughly the volatility of a single equity sector, and reaches 223. The third alternates +46% and −34%, roughly the volatility of a single narrow theme, and ends at 69, a loss, from the same average return4. The gap comes from volatility alone. Returns are hard to predict; volatility is more predictable, and it decides the outcome. That is why, as your horizon shortens, a single narrow theme cannot be the whole satellite, and why the diversifiers earn their place even when they lag the return-drivers.
Taken together, we believe there are four steps to consider in adapting your portfolio to today’s regime:
There are no predictions here. We are not forecasting that bonds will fall or that gold will rise. Instead, we recognize that the portfolio most investors hold was built for a regime that has ended, and that the diversification it once provided for free must now be rebuilt.
1 Gold and broad commodities: World Bank Pink Sheet monthly-average spot prices. Defense, mining, energy and real estate: Fama-French 48-industry portfolios (Guns, Mines, Oil, RlEst), value-weighted, monthly, Kenneth French Data Library. US equity market: Fama-French market return. 10-year Treasury: Robert J. Shiller online data. CPI: Shiller. Period August 1971 to December 1979. The Guns and RlEst portfolios contain few constituents in this period and are narrower than the other series shown.
2 S&P Dow Jones Indices (S&P 500 TR, S&P GSCI Gold TR, Dow Jones Commodity Index TR); Fama-French 48-industry portfolios (Guns, Mines, Oil, Chips); FRED (10-year Treasury constant maturity); Robert J. Shiller for CPI; VanEck calculations. Real (CPI-deflated) monthly data, month-end, March 2020 to September 2026. All figures in US dollars.
3 Core: S&P 500 and 10-year US Treasury total return at 40/60, 60/40 and 80/20; enhanced: core plus a fixed 30% sleeve of Defense, Energy, Mining, Semiconductors, Gold and Broad Commodities, quarterly rebalanced. Return-to-volatility ratios use real annualized return and annualized volatility of monthly returns. Hypothetical simulated portfolios; gross of fees and transaction costs; not investable.
4 Hypothetical illustration; not based on actual returns and not representative of any VanEck product. All three paths have an identical arithmetic average return of 6.0% a year. For reference, a 60/40 portfolio has run at roughly 12% annualized volatility, broad equities 16–18%, and a single narrow theme 30–45%.
IMPORTANT INFORMATION
This is marketing communication.
For investors in Switzerland: VanEck Switzerland AG, with registered office in Genferstrasse 21, 8002 Zurich, Switzerland, has been appointed as distributor of VanEck´s products in Switzerland by the Management Company VanEck Asset Management B.V. (“ManCo”). The representative in Switzerland is Zeidler Regulatory Services (Switzerland) AG, Stadthausstrasse 14, CH-8400 Winterthur, Switzerland. Swiss paying agent: Helvetische Bank AG, Seefeldstrasse 215, CH-8008 Zürich.
For investors in the UK: This material is directed exclusively at Professional Clients and Eligible Counterparties and is not intended for Retail Clients. Retail clients should not rely on any of the information provided and should seek assistance from a financial intermediary for all investment guidance and advice. VanEck Securities UK Limited (FRN: 1002854) is an Appointed Representative of Strata Global Limited (FRN: 563834), which is authorised and regulated by the Financial Conduct Authority (FCA) in the UK, to distribute VanEck´s products to FCA regulated firms such as financial intermediaries and Wealth Managers. The Funds are recognised in the UK under the Overseas Funds Regime but are not a UK-authorised Fund.UK investors should note that complaints in relation to the Funds cannot be referred to the Financial Ombudsman Service, and any related claims for losses will not be covered by the Financial Services Compensation Scheme.
This information originates from VanEck (Europe) GmbH, which is authorized as an EEA investment firm under the Markets in Financial Instruments Directive (“MiFiD”). VanEck (Europe) GmbH has its registered address at Kreuznacher Str. 30, 60486 Frankfurt, Germany, and has been appointed as distributor of VanEck products in Europe by the ManCo, which is incorporated under Dutch law and registered with the Dutch Authority for the Financial Markets (AFM).
This material is only intended for general and preliminary information and does not constitute an investment, legal or tax advice. No representation or warranty is made as to the accuracy or completeness of the information and no liability is accepted to the fullest extent permitted by law. All relevant documentation must be first consulted.
The views and opinions expressed are those of the author(s) but not necessarily those of VanEck. Opinions are current as of the publication date and are subject to change with market conditions. Information provided by third party sources is believed to be reliable and has not been independently verified for accuracy or completeness and cannot be guaranteed.
The MSCI information may only be used for your internal use, may not be reproduced or redisseminated in any form and may not be used as a basis for or a component of any financial instruments or products or indices. None of the MSCI information is intended to constitute investment advice or a recommendation to make (or refrain from making) any kind of investment decision and may not be relied on as such. Historical data and analysis should not be taken as an indication or guarantee of any future performance analysis, forecast or prediction. The MSCI information is provided on an “as is” basis and the user of this information assumes the entire risk for any use made of this information. MSCI, each of its affiliates and each other person involved in or related to compiling, computing or creating any MSCI information (collectively, the “MSCI Parties”), expressly disclaims all warranties (including, without limitation, any warranties of originality, accuracy, completeness, timeliness, noninfringement, merchantability and fitness for a particular purpose) with respect to this information. Without limiting any of the foregoing, in no event shall any MSCI Party have any liability for any direct, indirect, special, incidental, punitive, consequential (including, without limitation, lost profits) or any other damages. It is not possible to invest directly in an index.
The S&P 500, S&P GSCI Gold and Dow Jones Commodity Index (“Index”) is a product of S&P Dow Jones Indices LLC and/or its affiliates and has been licensed for use by Van Eck Associates Corporation. Copyright © 2020 S&P Dow Jones Indices LLC, a division of S&P Global, Inc., and/or its affiliates. All rights reserved. Redistribution or reproduction in whole or in part are prohibited without written permission of S&P Dow Jones Indices LLC. For more information on any of S&P Dow Jones Indices LLC’s indices please visit www.spdji.com. S&P® is a registered trademark of S&P Global and Dow Jones® is a registered trademark of Dow Jones Trademark Holdings LLC. Neither S&P Dow Jones Indices LLC, Dow Jones Trademark Holdings LLC, their affiliates nor their third party licensors make any representation or warranty, express or implied, as to the ability of any index to accurately represent the asset class or market sector that it purports to represent and neither S&P Dow Jones Indices LLC, Dow Jones Trademark Holdings LLC, their affiliates nor their third party licensors shall have any liability for any errors, omissions, or interruptions of any index or the data included therein. It is not possible to invest directly in an index. The value of investments may go down as well as up and investors may not get back the amount originally invested. For any unfamiliar technical terms, please refer to ETF Glossary | VanEck.
No part of this material may be reproduced in any form, or referred to in any other publication, without express written permission of VanEck.
© VanEck (Europe) GmbH ©VanEck Switzerland AG © VanEck Securities UK Limited
This is a marketing communication. Please refer to the prospectus of the UCITS and to the KID before making any final investment decisions.
This information originates from VanEck Switzerland AG which has been appointed as distributor of VanEck products in Switzerland by the Management Company VanEck Asset Management B.V., incorporated under Dutch law and registered with the Dutch Authority for the Financial Markets (AFM). VanEck Switzerland AG’s registered address is at Genferstrasse 21, 8002 Zürich, Switzerland.
The information is intended only to provide general and preliminary information to investors and shall not be construed as investment, legal or tax advice. VanEck Switzerland AG and its associated and affiliated companies (together “VanEck”) assume no liability with regards to any investment, divestment or retention decision taken by the investor on the basis of this information. The views and opinions expressed are those of the author(s) but not necessarily those of VanEck. Opinions are current as of the publication date and are subject to change with market conditions. Certain statements contained herein may constitute projections, forecasts and other forward-looking statements, which do not reflect actual results. Information provided by third party sources is believed to be reliable and have not been independently verified for accuracy or completeness and cannot be guaranteed. Brokerage or transaction fees may apply. A copy of the latest prospectus, the Articles, the Key Information Document, the annual report and semi-annual report can be found on our website www.vaneck.com or can be obtained free of charge from the representative in Switzerland: First Independent Fund Services Ltd, Feldeggstrasse 12, 8008 Zurich, Switzerland. Swiss paying agent: Helvetische Bank AG, Seefeldstrasse 215, CH-8008 Zürich.
All performance information is based on historical data and does not predict future returns. Investing is subject to risk, including the possible loss of principal.
No part of this material may be reproduced in any form, or referred to in any other publication, without express written permission of VanEck.
© VanEck Switzerland AG

25 October 2026
25 October 2026