Examining Gold’s Recovery Cycles
18 March 2020
Read Time 4 MIN
While the outcome of this most recent market sell-off and related pandemic are yet-to-be-seen, we remain optimistic about the outlook for gold and gold stocks in the near-term. Much of the market movement in gold prices is relatively easy to explain, while gold companies continue to exhibit, we believe, truly compelling fundamentals and valuations. With respect to the pandemic, companies are taking all precautions, and although we do anticipate that some operations will be impacted, discussions we have had with companies indicate that every effort is being made to ensure inventories, supply lines, employee health and back-up redundancies are in place to sustain production.
Below is a summary of our most recent takeaways.
We believe there are, predominately, two reasons why gold has been under pressure as of late.
- Unwinding of hedged positions in risk parity and other volatility model funds – Gold, commodity and fixed income investments are typically leveraged in risk parity models (based on their underlying volatility relative to equities), so substantial liquidations in these funds have led to outsized, forced selling of these assets.
- Liquidations to raise cash – Selling to meet margin calls and raising cash to cover stock market losses, especially among leveraged funds, is commonplace during market sell-offs.
We believe that gold/gold stocks tend to recover faster than the broader markets following crises.
More recently, during the 2008 financial crisis, gold and gold stocks bottomed and recovered much earlier than the S&P 500—recouping losses at/around the time the S&P reached its lows in February/March 2009. The S&P 500 took nearly two years to reach its pre-crisis levels again.Gold and Gold Stocks Recovered Before S&P 500 During 2008 Financial Crisis
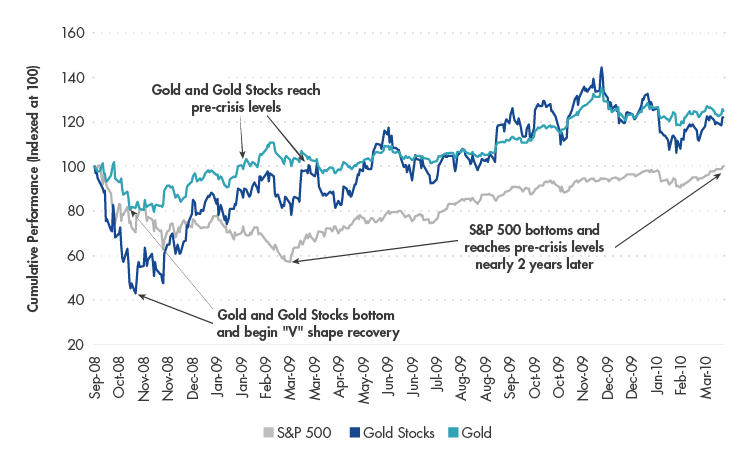
Source: VanEck, Bloomberg. Data as of March 2020. “S&P 500” represented by the S&P 500 Index TR (SPXT). “Gold Stocks” represented by the NYSE Arca Gold Miners Index Net Total Return (GDMNTR). “Gold” represented by gold spot prices.
Looking at other past market sell offs, gold has held up particularly well while gold stocks—though often following the broader equity market through a drawdown—have, on the whole, outperformed over the full cycle (drawdown to recovery).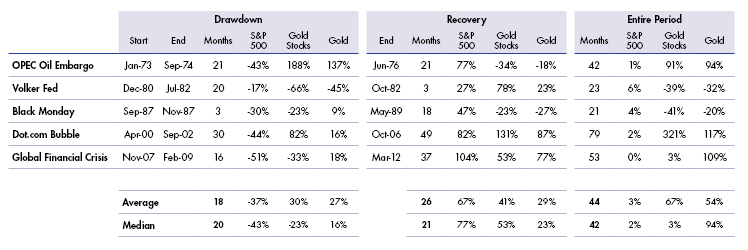
Source: VanEck, Bloomberg. Data as of March 2020. Index returns are cumulative. “S&P 500” represented by the S&P 500 TR Index (SPXT). “Gold Stocks” represented by Barron’s Gold Mining Index (BGMI) from January 1973 to inception date of the Philadelphia Gold and Silver Index (XAUTR) in January 1984 and XAUTR to the inception of the NYSE Arca Gold Miners Index Net Total Return (GDMNTR) in October 1993. “Gold” represented by gold spot prices
We believe that gold stocks, generally speaking, remain in fundamentally good shape.
We expect no credit problems, while the lengths to which companies have gone to reduce costs and capital expenditures and to avoid mistakes of the past could translate to an additional near 40% increase in free cash flow, on average, for a gold price move from $1,600 to $1,800 (for seniors and mid-tiers).Estimated Free Cash Flow for Gold Price Moves
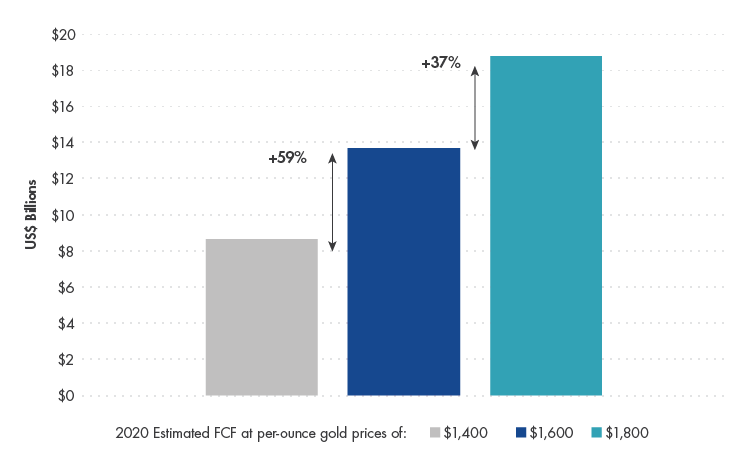
Source: VanEck, Bloomberg. Data as of March 2020. “Senior” miners defined by production levels of approximately 1.5-6.0 million ounces of gold per year (“Mid-Tier” approximately 0.3-1.5 million ounces per year).
Related Insights
Related Insights
10 febrero 2026
18 diciembre 2025
07 noviembre 2025
10 febrero 2026
Las oscilaciones del precio del oro en enero evidenciaron volatilidad, no debilidad. La fuerte demanda, las compras de los bancos centrales y la mejora de los fundamentos del sector minero siguen respaldando un mercado alcista sólido y duradero a largo plazo de cara a 2026.
18 diciembre 2025
Prepare su portafolio para 2026 con información detallada del equipo de inversiones de VanEck sobre los factores que determinarán el riesgo y los rendimientos en sus respectivas clases de activos.
18 noviembre 2025
El repunte del oro por encima de los USD 4,000/oz refleja fortaleza en un contexto de oferta limitada y demanda constante. Las mineras continúan subvaloradas, lo que abre oportunidades potenciales si persisten las tendencias actuales del mercado.
07 noviembre 2025
El oro alcanzó máximos históricos en 2025, impulsado por la demanda de los bancos centrales, la desdolarización y la rentabilidad de los inversores.
10 octubre 2025
El oro subió a máximos históricos, cerca de $3859/onza en septiembre, dado el aumento de la demanda tras los recortes de tasas de la Reserva Federal y las compras de los bancos centrales. Los mineros repuntaron gracias al fuerte flujo de caja, la disciplina y el renovado interés de los inversores.