China Recovery – Seeing Is Believing
01 March 2023
Read Time 2 MIN
China Reopening
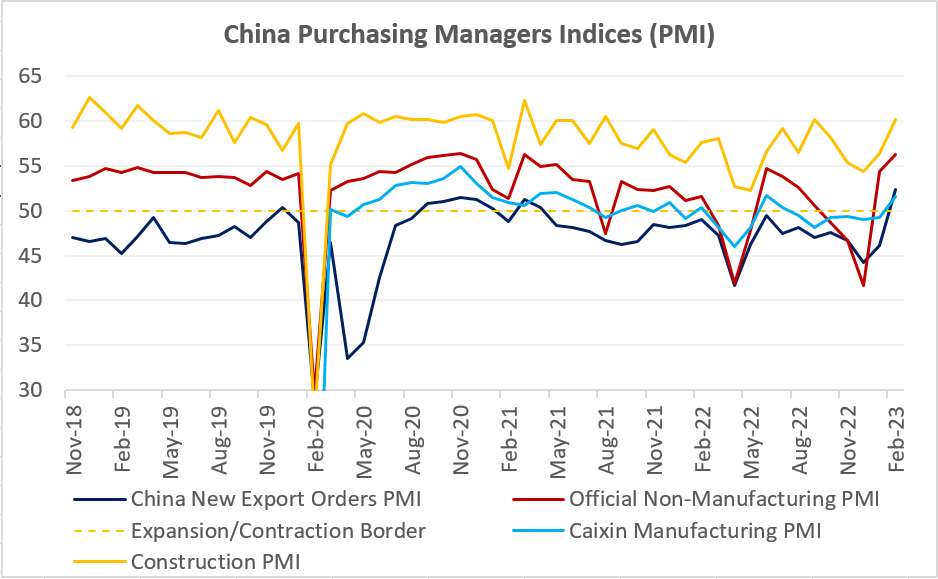
China’s faster recovery thesis got some major support from February’s activity gauges. All PMIs (Purchasing Managers Indices) improved significantly last month, with the vast majority in the expansion zone now – not only services and manufacturing, but also the new export orders and small companies PMIs (see chart below). Importantly, the construction PMI shot above 60.0, pointing to the ongoing infrastructure push but also a signal that the housing sector might be getting more “alive.” China’s equities and FX – as well as many risky assets - had a very good day today. China’s credit aggregates would be the next important dataset to watch – especially proxies for mortgage lending, which are vital for consumer confidence and the consumption-led recovery (in addition to the stronger employment PMI).
EM Growth Outlook
China’s new export orders gains (up from 46.1 to 52.4) sent a positive signal regarding the state of global demand, albeit the growth “landscape” looks more mixed on a country level. Emerging markets (EM) Asia mostly stayed in the expansion zone (including Thailand’s “upgrade”), but Central Europe continued to struggle deep in the contraction zone. We were also concerned by a sharp deterioration in two major African economies – South Africa and Nigeria – where February’s PMIs unexpectedly plunged below 50.0. LATAM’s high-frequency growth indicators have shown more signs of life lately – including today’s economic activity proxy in Chile and Brazil’s PMI – but this is an uphill struggle as high real interest rates – and political noise - continue to bite.
DM Rates And Inflation
Even though a recession is no longer the base-case scenario for most developed markets (DMs) this year, the “bumpy” activity dataflow in the U.S. – including February’s surprisingly weak consumer confidence index - raised questions about further growth upgrades. Today’s mixed ISM survey showed that these concerns might be justified. There were improvements, but one of the strongest upside surprises came in the “prices paid” category. And this helps to explain why the market continues to price in the higher peak rate in the U.S. and a 74% probability of a rate hike in June. Will China’s V-shaped comeback prove a more important global driver for EMs than higher for longer U.S. rates? We this that this is indeed the case for some EMs, especially in EM Asia. Stay tuned!
Chart at a Glance: China Recovery – V-Shape After All?
Source: Bloomberg LP.
Related Insights
Related Insights
10 febrero 2026
06 marzo 2025
20 febrero 2025
10 febrero 2026
La erosión del valor de la moneda vuelve a estar en el centro de atención. A continuación, analizamos qué lo está impulsando, qué podría revertirlo y cómo estamos posicionando las carteras en ambos escenarios.
07 abril 2025
Los aranceles de Trump avivan los temores de una guerra comercial, impulsando la volatilidad del mercado, el riesgo inflacionario y la amenaza de una recesión. Ante posibles represalias globales, el crecimiento a corto plazo corre un riesgo evidente.
06 marzo 2025
Los aranceles de Trump, la próxima fase de la IA y una posible revalorización del oro estadounidense podrían sacudir los mercados; los inversores que se adelanten a estas transiciones estarán mejor posicionados.
20 febrero 2025
El avance de la IA en China, la persistente inflación, el rendimiento superior del oro y el aumento de la demanda energética ponen de relieve un panorama de inversión cambiante.
16 enero 2025
En 2025, superar los problemas significa equilibrar la innovación tecnológica, las coberturas contra la inflación, los cambios energéticos y los riesgos derivados de los recortes del gasto y la inflación.