Rates Higher – But For How Long?
20 September 2022
Read Time 2 MIN
Fed Rate Hikes
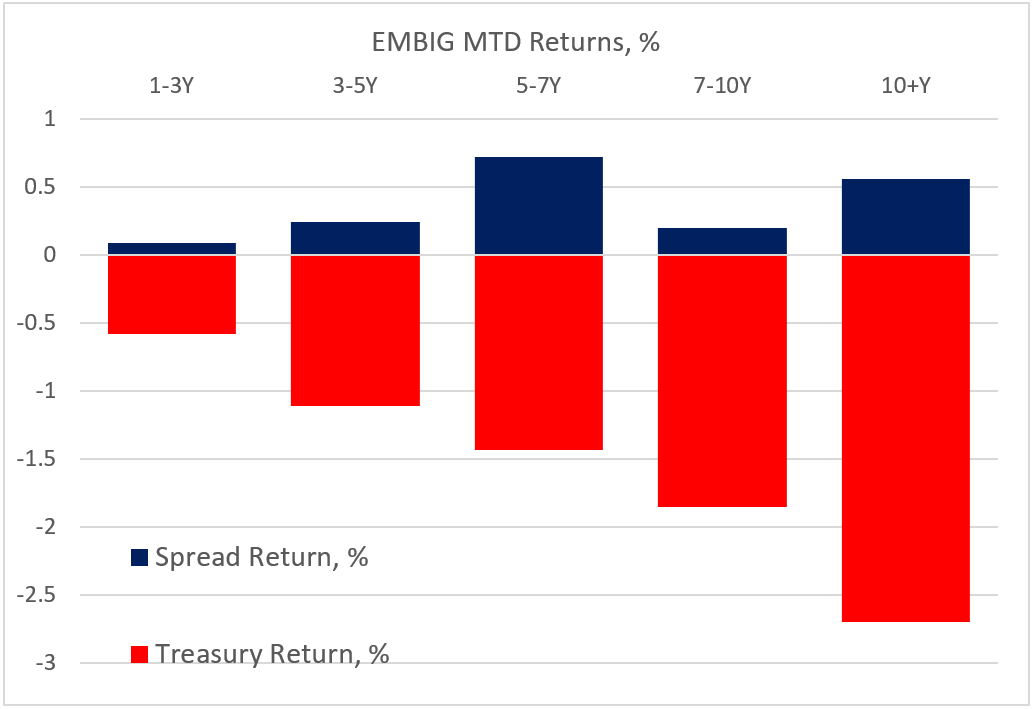
The morning’s big story is global rates pushing higher, with the 2–year U.S. Treasury yield approaching 4% and the 30–year mortgage rate testing the 2008 highs (with ensuing concerns about the housing market and the growth outlook). All eyes are now on tomorrow’s U.S. Federal Reserve (Fed) policy announcement – Fed Funds Futures continue to price in a small probability of a larger 100bps hike and a terminal rate of around 4.5% (in early–2023). Emerging markets (EM) duration remains under pressure in this environment – positive monthly spread returns being too small to compensate for much larger Treasury losses, especially for longer–dated bonds (see chart below).
EM Tightening Cycles
The policy drumbeat in some EMs is still hawkish. South Africa and Mexico are widely expected to maintain the pace of tightening with 75bps rate hikes this month. Hungary might frontload more next week due to persistent inflation pressures, and also to create an extra policy buffer as the latest political spat with the European Union can lead to sizable EU funding cuts. However, EM regional policy rate aggregates are definitely peaking, and the winding down narrative is gaining weight. Brazil’s rate–setting meeting tomorrow will be an important litmus test. The consensus expects the central bank to remain on hold, and the local swap curve now prices in gradual rate cuts starting from Q2.
China Policy Easing
Some EMs are easing outright, but China is perhaps the only one where policy easing actually makes sense, because inflation pressures are non–existent and the near–term growth outlook is still deteriorating. Authorities, however, appear to have taken a pause in the run up to the Communist Party Congress in October. All policy rates were kept on hold in September – including today’s loan prime rate. Reports also point to a hiatus in special local government bond issuance after a big jump in Q2. We (and the market) keep an eye on the next batch of China’s activity gauges – the August numbers were not particularly conclusive, despite some improvements. Stay tuned!
Chart at a Glance: A Bad Month for EM Duration
Source: Bloomberg LP.
Note: EMBIG – J.P. Morgan’s EMBI Global Diversified Index.
Related Insights

Related Insights
13 agosto 2026
10 febrero 2026
06 marzo 2025
13 agosto 2026
Vea cómo las perspectivas de Jan van Eck para el tercer trimestre pueden traducirse en ideas accionables de fondos cotizados en bolsa (ETF) en semiconductores, crédito privado, oro y bitcoin.
10 febrero 2026
La erosión del valor de la moneda vuelve a estar en el centro de atención. A continuación, analizamos qué lo está impulsando, qué podría revertirlo y cómo estamos posicionando las carteras en ambos escenarios.
07 abril 2025
Los aranceles de Trump avivan los temores de una guerra comercial, impulsando la volatilidad del mercado, el riesgo inflacionario y la amenaza de una recesión. Ante posibles represalias globales, el crecimiento a corto plazo corre un riesgo evidente.
06 marzo 2025
Los aranceles de Trump, la próxima fase de la IA y una posible revalorización del oro estadounidense podrían sacudir los mercados; los inversores que se adelanten a estas transiciones estarán mejor posicionados.
20 febrero 2025
El avance de la IA en China, la persistente inflación, el rendimiento superior del oro y el aumento de la demanda energética ponen de relieve un panorama de inversión cambiante.