Welcome to VanEck
Select Investor Type
21 April 2026
In April 2026, the VanEck Global Real Estate UCITS ETF (TRET) marks 15 years since inception. Over that period, the GPR Global 100 Index has navigated the European sovereign debt crisis, the COVID-19 pandemic, and a 300+ basis point tightening cycle. Globally, listed real estate has grown to represent over $2.5 trillion in equity market capitalisation across more than 40 countries, with the Global Property Research General Index delivering a 10-year compound annual total return of 4.0% in USD.
| Year | 2012 | 2013 | 2014 | 2015 | 2016 | 2017 | 2018 | 2019 | 2020 | 2021 | 2022 | 2023 | 2024 | 2025 |
| 12-month performance (%) | 32.06 | 1.12 | 32.26 | 14.96 | -0.11 | -3.79 | 0.23 | 22.58 | -14.72 | 39.21 | -21.13 | 9.05 | 9.44 | -0.19 |
Source: VanEck, Morningstar. The chart displays cumulative performance in % in EUR NAV terms. Past performance is not representative of future results.
There is now sufficient evidence – from TRET’s track record, from institutional research, and from the practices of the world’s largest allocators – to assess the role listed real estate plays within a diversified portfolio. This article examines the structural case for REITs as a complement to private real estate and considers the outlook for the asset class.
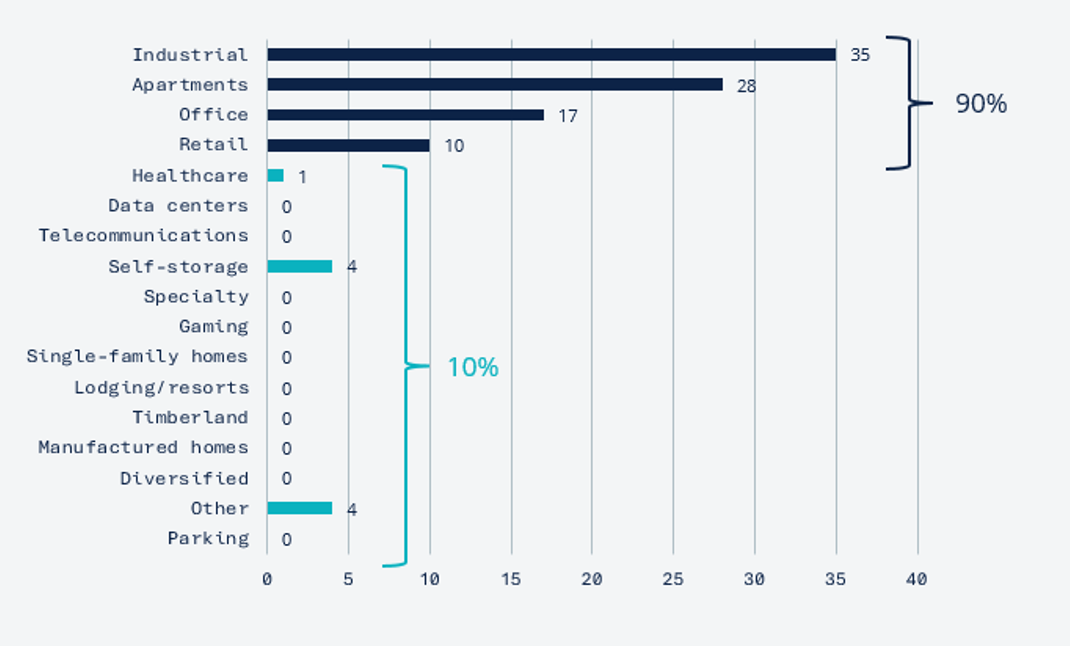
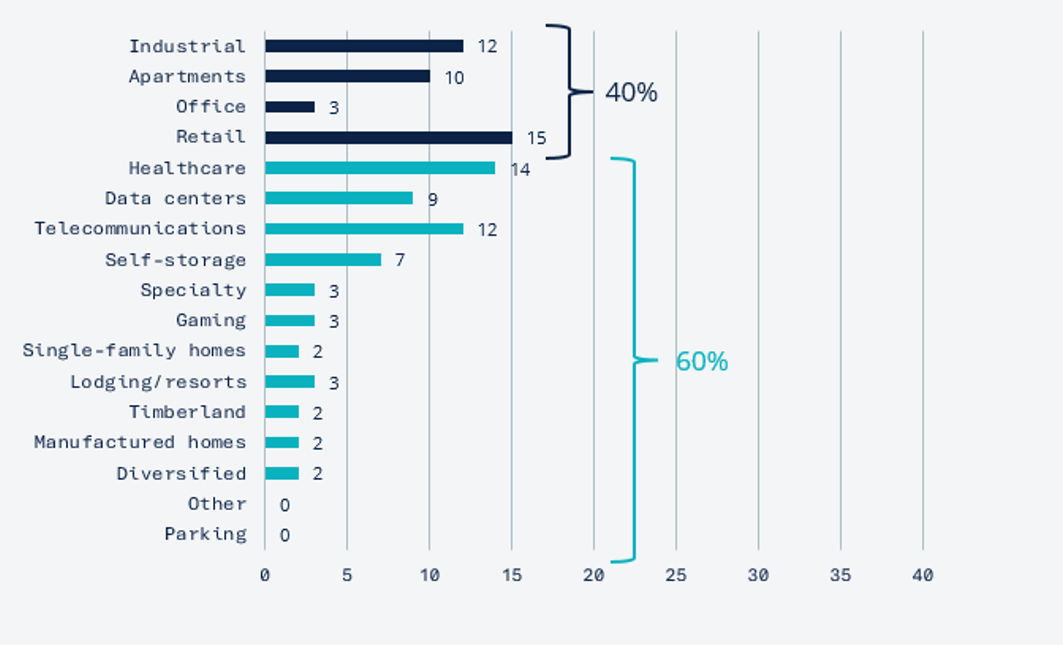
Private vehicles offer direct ownership and appraisal-smoothed volatility; listed vehicles offer daily liquidity, transparency, and efficient rebalancing. The practical advantages of REITs – no cash drag, no lock-up, the ability to tactically tilt sector or geographic exposures – are well understood by institutional allocators. Norges Bank Investment Management runs a roughly 50:50 split between private and listed real estate1, while Dutch institutions such as Bouwinvest and MN use REITs as completion portfolio mechanisms2. Listed real estate also provides exposure to segments difficult to access via private vehicles. The ODCE Index has roughly 90% exposure in industrial, apartments, office, and retail3, whereas listed real estate has approximately 60% outside those categories.
Private Real Estate, %
(ODCE)
REITs, %
(FTSE Nareit All Equity)
Source: NCREIF Open-end Diversified Core Equity ending market value as of Q1 via NCREIF, FTSE Nareit All Equity Index, equity mcap as of March 31, 2025 via Factset. Past performance is not indicative of future results.
A CEM Benchmarking study covering over 200 US pension funds (1998–2022) found that REITs outperformed actively managed private real estate funds by more than 2 percentage points per annum on a net total return basis4,5. This data reflects a specific historical period and US market conditions that may not be replicated elsewhere. The choice between listed and private vehicles involves a trade-off that each allocator must assess according to their own portfolio constraints.
Annual total return for real estate, 1998-2022, %
(Average annual total return net of fees)
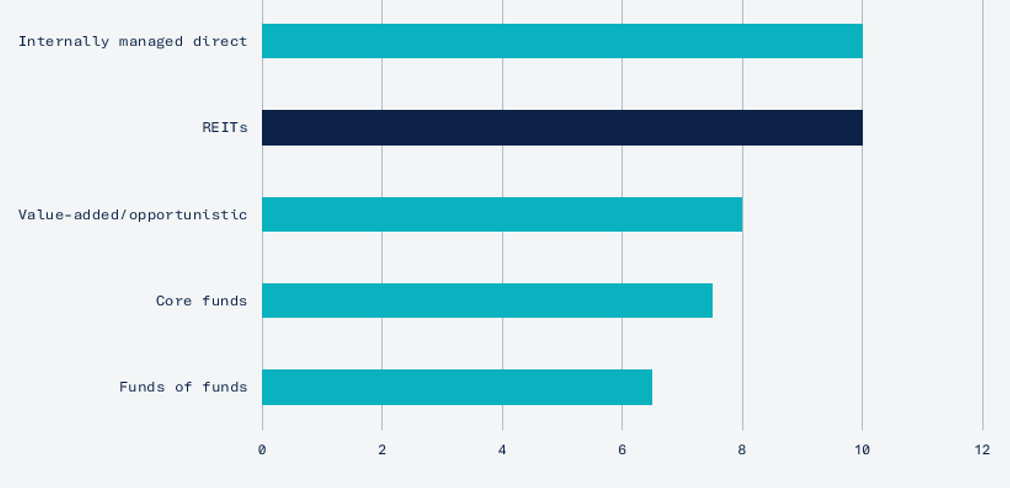
Source: CEM Benchmarking 2024. Returns adjusted for reporting lags. Covers 200+ US pension plans, 1996–2022. Historical performance is not indicative of future results.
REITs exhibit higher short-term volatility than appraisal-based private vehicles. Over longer holding periods, however, correlation converges: from approximately 20% at a one-year horizon to above 50% over five years6. Both asset classes hold the same underlying property; the difference is in repricing speed, not fundamental exposure.
(Quarterly returns)
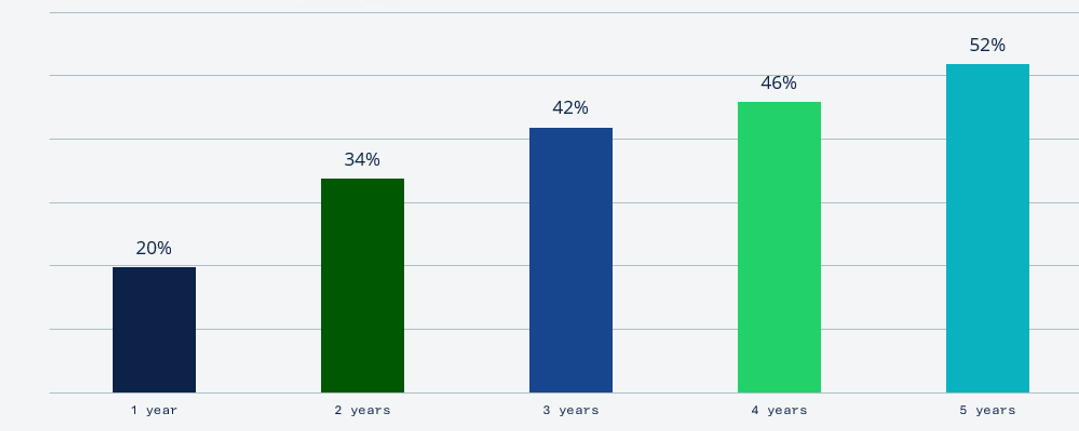
Source: GPR, MSCI, VanEck calculation. Listed real estate represented by the NAREIT index, unlisted real estate by the NCREIF Property Index. 1978–2025. Historical correlations may not persist in the future.
The table below ranks annual returns across major US asset classes from 2009 to 2024. REITs finished in the top three in seven of these sixteen years and delivered positive returns in thirteen. In the deepest equity drawdown years (2018, 2022), REITs experienced comparable or smaller losses than broad equities while outperforming in subsequent recoveries – underscoring their diversification value in a multi-asset portfolio.
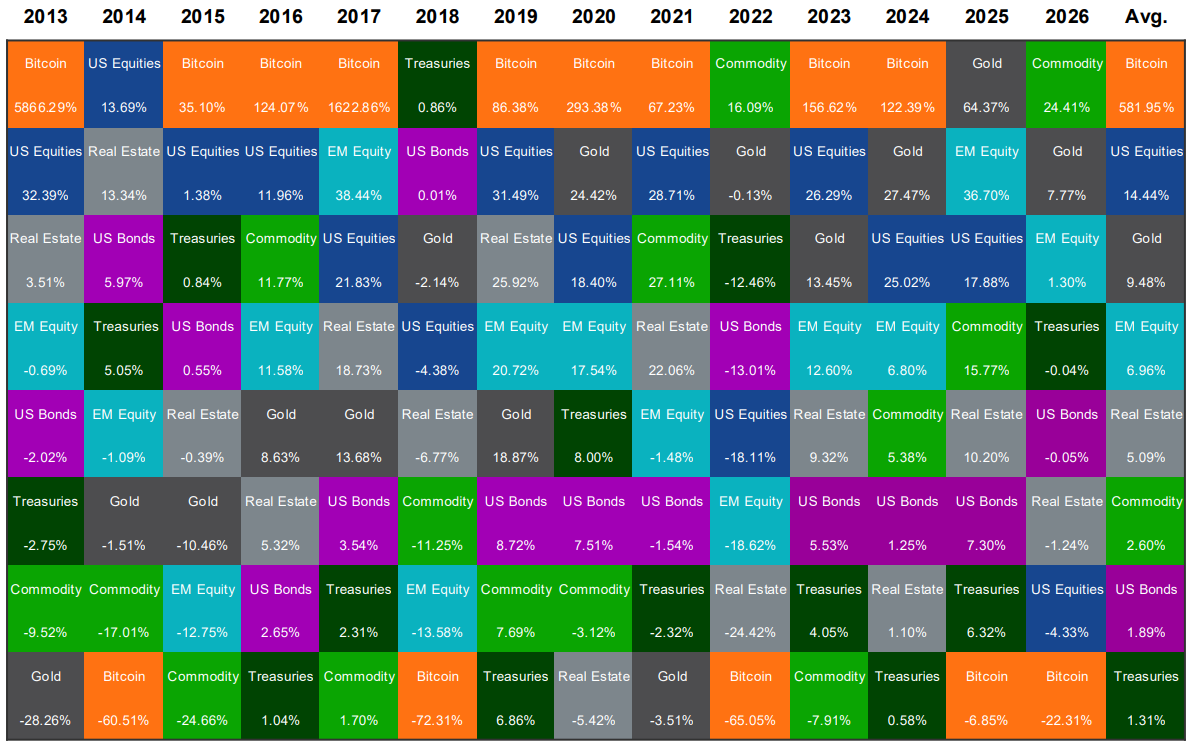
Source: Morningstar as of 3/31/2026. Past performance is no guarantee of future results. Not intended as a recommendation to buy or sell any securities or digital assets referenced herein, or as any call to action. The views expressed are for illustrative purposes only, subject to change without notice, do not constitute investment advice or recommendations, and are those of the author(s) and not necessarily those of VanEck or its other employees. Please see important disclosures and index descriptions at the end of this presentation. Investments in digital assets are subject to significant risk and are not suitable for all investors. The value of digital assets is highly volatile, and you can lose your entire principal investment.
Occupancy rates across most REIT subsectors have recovered towards pre-pandemic levels7, with the notable exception of office – a segment that now represents a relatively small share of both the listed universe and TRET’s portfolio. Leverage ratios are well below levels seen during the 2008–2009 financial crisis8. The ECB has cut its deposit facility rate from 4.00% to 2.00% since June 2024, and the Bank of England has begun its own easing cycle9. EPRA’s 2026 Market Outlook characterises the coming period as a “year of normalisation” for European listed real estate, with inflation returning close to central bank targets11. European listed property companies enter 2026 with strong balance sheets: 85% of debt at fixed rates, stable 1.0x debt-to-equity, and 5.3x EBITDA interest coverage12. The sector raised a four-year record of EUR 28 billion in capital during 202513.
European listed real estate trades at an average NAV discount of approximately 27%14, a level historically associated with above-average forward returns, with EPRA modelling projecting 7–10% annual returns for the Eurozone over five years15. More than 70% of US pension plans by assets now incorporate REITs into their real estate strategies16.
These projections carry significant risks, including geopolitical instability and trade policy uncertainty17. Stickier-than-expected inflation could lead to tighter monetary conditions. Investors should approach forward-looking estimates with appropriate caution.
The VanEck Global Real Estate UCITS ETF (TRET) tracks the GPR Global 100 Index, capturing the 100 largest and most liquid listed real estate companies globally. The focus on large-cap holdings is deliberate: larger REITs tend to be better capitalised, with greater access to long-term fixed-rate financing. The index applies an ESG screening through GRESB’s Public Disclosure Score. The Fund does not have sustainable investment as its objective. TRET uses full physical replication, does not engage in securities lending, and has a TER of 0.25%.
Since inception in April 2011, TRET has delivered an annualized return of 7.02%[DP2.1][DP2.2][RH2.3] (NAV basis, EUR)10. Past performance is not a reliable indicator of future results.
| Index | GPR Global 100 Index (GPR100GI) |
| Inception Date | 14 April 2011 |
| TER | 0.25% |
| AUM | €416.3 million as of 20 Apr 2026 |
| Holdings | 100 global REITs |
| Regional Split | 40 North America, 30 EMEA, 30 Asia Pacific |
| Replication | Fully physical (no securities lending) |
| Income | Quarterly distributions |
| ISIN | NL0009690239 |
Fifteen years of live data reinforces the structural case: listed real estate has delivered returns comparable to private vehicles, provides access to growth segments private benchmarks underweight, and offers the liquidity needed for active portfolio management. With a normalising macro backdrop, improving fundamentals, and attractive valuations, the asset class enters 2026 on a constructive footing. For institutional allocators, TRET provides a low-cost, globally diversified vehicle with a 15-year track record. Investors should consult the fund’s prospectus and Key Information Document before making any investment decision.
Foreign currency risk: as the fund invests in assets denominated in currencies other than the base currency (EUR), currency movements may negatively affect the value of the investment. Equity market risk: the value of equity securities may fluctuate in response to the activities of individual companies and general market and economic conditions. Industry or sector concentration risk: the fund’s investments are concentrated in the real estate sector, making it more susceptible to adverse developments in that sector. Interest rate risk: changes in interest rates may negatively affect the value of real estate securities. Please refer to the KID and the Prospectus for other important information before investing.
1 Norges Bank Investment Management, Annual Report 2024. Top1000funds.com, “NBIM transparently explains half year results”, August 2024. Real estate portfolio split roughly 50:50 between unlisted and listed.
2 Nareit, “Dutch Pension Portfolios Make Strategic, Long-Term Allocations to REITs”, July 2025. Nareit, “Institutional Investors Leverage REITs for Diversification and Growth”, December 2025.
3 NCREIF, ODCE Index ending market value. FTSE Nareit All Equity Index, equity market capitalisation as of March 31, 2025 via Factset.
4 CEM Benchmarking Inc., “Asset Allocation and Fund Performance of Defined Benefit Pension Funds in the United States, 1998–2022”, commissioned by Nareit, December 2024.
5 CEM Benchmarking 2024, op. cit. REITs averaged 9.74% net annual return vs. 7.66% for private real estate. Returns adjusted for reporting lags.
6 Global Property Research (GPR), MSCI. NAREIT index vs. NCREIF Property Index, quarterly returns 1978–2025.
7 Nareit T-Tracker, quarterly REIT industry financial snapshot. Occupancy rates as of Q3 2025.
8 Nareit T-Tracker. US Equity REIT debt-to-book-assets and debt-to-market-assets as of Q3 2025.
9 Bloomberg. ECB deposit facility rate cut from 4.00% to 2.50% (Jun 2024–Mar 2026); BoE Bank Rate cut from 5.25% to 4.50% (Aug 2024–Feb 2025).
10 VanEck. Fund performance as of 31 December 2025. Past performance is not a reliable indicator of future results.
11 EPRA, “2026 Market Outlook: The Year of Normalisation in European Listed Real Estate”, December 2025.
12 EPRA, “A Decade of Change: European Listed Real Estate Sector Report 2015–2025”, 2026. EPRA Research, annual reports, Bloomberg.
13 EPRA Monthly LTV Monitor, December 2025.
14 EPRA Monthly NAV Bulletin, November 2025.
15 EPRA, “A Decade of Change”, op. cit. Time-series modelling: 5-year expected annual returns for Eurozone listed RE: 4.0% (downside), 7.8% (main), 11.7% (upside).
16 Nareit, “2026 REIT Outlook: Trends and Strategies”, December 2025. Nareit, “Optimising Global REIT Returns: Key Trends and Insights for 2026”, December 2025.
17 PwC and Urban Land Institute, “Emerging Trends in Real Estate: Europe 2026”, November 2025.
IMPORTANT INFORMATION
This is marketing communication.
For investors in Switzerland: VanEck Switzerland AG, with registered office in Genferstrasse 21, 8002 Zurich, Switzerland, has been appointed as distributor of VanEck´s products in Switzerland by the Management Company VanEck Asset Management B.V. (“ManCo”). The representative in Switzerland is Zeidler Regulatory Services (Switzerland) AG, Stadthausstrasse 14, CH-8400 Winterthur, Switzerland. Swiss paying agent: Helvetische Bank AG, Seefeldstrasse 215, CH-8008 Zürich.
For investors in the UK: This is a marketing communication targeted to FCA regulated financial intermediaries. Retail clients should not rely on any of the information provided and should seek assistance from a financial intermediary for all investment guidance and advice. VanEck Securities UK Limited (FRN: 1002854) is an Appointed Representative of Strata Global Limited (FRN: 563834), which is authorised and regulated by the Financial Conduct Authority (FCA) in the UK, to distribute VanEck´s products to FCA regulated firms such as financial intermediaries and Wealth Managers.
This information originates from VanEck (Europe) GmbH, which is authorized as an EEA investment firm under the Markets in Financial Instruments Directive (“MiFiD”). VanEck (Europe) GmbH has its registered address at Kreuznacher Str. 30, 60486 Frankfurt, Germany, and has been appointed as distributor of VanEck products in Europe by the ManCo, which is incorporated under Dutch law and registered with the Dutch Authority for the Financial Markets (AFM).
This material is only intended for general and preliminary information and does not constitute an investment, legal or tax advice. VanEck (Europe) GmbH and its associated and affiliated companies (together “VanEck”) assume no liability with regards to any investment, divestment or retention decision on the basis of this information. All relevant documentation must be first consulted.
The views and opinions expressed are those of the author(s) but not necessarily those of VanEck. Opinions are current as of the publication date and are subject to change with market conditions. Information provided by third party sources is believed to be reliable and has not been independently verified for accuracy or completeness and cannot be guaranteed.
Please refer to the Prospectus – in English language - and the KID/KIID - in local language - before making any final investment decisions and for full information on risks. These documents can be obtained free of charge at www.vaneck.com, from the ManCo or from the appointed facility agent.
VanEck Global Real Estate UCITS ETF ("ETF") is a sub-fund of VanEck ETFs N.V., a UCITS umbrella investment company, registered with the AFM, passively managed and tracking an equity index. The product described herein aligns to Article 8 Regulation (EU) 2019/2088 on sustainability-related disclosures in the financial services sector. Information on sustainability-related aspects pursuant to that regulation can be found on www.vaneck.com. Investors must consider all the fund's characteristics or objectives as detailed in the prospectus, in the sustainability-related disclosures or related documents before making an investment decision.
The value of the ETF may fluctuate significantly as a result of the investment strategy. The ETF´s holdings are disclosed on each dealing day on www.vaneck.com under the ETF´s Holdings section and as per PCF under the Documents section and published via one or more market data suppliers. The indicative net asset value (iNAV) of the ETF is available on Bloomberg. For details on the regulated markets where the ETF is listed, please refer to the Trading Information section on the ETF page at www.vaneck.com. Investors must buy and sell units of the UCITS on the secondary market via an intermediary (e.g. a broker) and cannot usually be sold directly back to the UCITS. Brokerage fees may incur. The buying price may exceed, or the selling price may be lower than the current net asset value. Investing in the ETF should be interpreted as acquiring shares of the ETF and not the underlying assets. Tax treatment depends on the personal circumstances of each investor and may vary over time. The ManCo may terminate the marketing of the ETF in one or more jurisdictions. The summary of the investor rights is available in English at: summary-of-investor-rights.pdf.
The VanEck’s ETF is not sponsored, promoted, sold or supported in any other manner by Solactive AG and Global Property Research B.V. nor do Solactive AG and Global Property Research B.V. offer any express or implicit guarantee or assurance either with regard to the results of using the Index and/or Index trademark or the Index Price at any time or in any other respect. The Index is calculated and published by Solactive AG. Solactive AG uses its best efforts to ensure that the Index is calculated correctly. Irrespective of its obligations towards the VanEck’s ETF, Solactive AG has no obligation to point out errors in the Index to third parties including but not limited to investors and/or financial intermediaries of the VanEck’s ETF.
Neither publication of the Index by Solactive AG nor the licensing of the Index or Index trademark for the purpose of use in connection with the VanEck’s ETF constitutes a recommendation by Solactive AG to invest capital in the VanEck’s ETF nor does it in any way represent an assurance or opinion of Solactive AG with regard to any investment in the VanEck’s ETF. It is not possible to invest directly in an index.
Source: VanEck.
Performance quoted represents past performance. Current performance may be lower or higher than average annual returns shown.
The Dutch domiciled ETFs use a gross reinvestment index as opposed to many other ETFs and investment funds that use a net reinvestment index. Comparing with a gross reinvestment index is the purest form since it considers that Dutch investors can reclaim the dividend tax withheld. Please note that the performance includes income distributions gross of Dutch withholding tax because Dutch investors receive a refund of the 15% Dutch withholding tax levied. Different investor types and investors from other jurisdictions may not be able to achieve the same level of performance due to their tax status and local tax rules. Returns may increase or decrease as a result of currency fluctuations. Performance should be assessed over a medium- to long-term.
Investing is subject to risk, including the possible loss of principal. For any unfamiliar technical terms, please refer to ETF Glossary | VanEck.
No part of this material may be reproduced in any form, or referred to in any other publication, without express written permission of VanEck.
© VanEck (Europe) GmbH ©VanEck Switzerland AG © VanEck Securities UK Limited
This is a marketing communication. Please refer to the prospectus of the UCITS and to the KID before making any final investment decisions.
This information originates from VanEck (Europe) GmbH, which has been appointed as distributor of VanEck products in Europe by the Management Company VanEck Asset Management B.V., incorporated under Dutch law and registered with the Dutch Authority for the Financial Markets (AFM). VanEck (Europe) GmbH with registered address at Kreuznacher Str. 30, 60486 Frankfurt, Germany, is a financial services provider regulated by the Federal Financial Supervisory Authority in Germany (BaFin).
The information is intended only to provide general and preliminary information to investors and shall not be construed as investment, legal or tax advice VanEck (Europe) GmbH, VanEck Switzerland AG, VanEck Securities UK Limited and their associated and affiliated companies (together “VanEck”) assume no liability with regards to any investment, divestment or retention decision taken by the investor on the basis of this information. The views and opinions expressed are those of the author(s) but not necessarily those of VanEck. Opinions are current as of the publication date and are subject to change with market conditions. Certain statements contained herein may constitute projections, forecasts and other forward-looking statements, which do not reflect actual results. Information provided by third party sources is believed to be reliable and have not been independently verified for accuracy or completeness and cannot be guaranteed. Brokerage or transaction fees may apply.
All performance information is based on historical data and does not predict future returns. Investing is subject to risk, including the possible loss of principal.
No part of this material may be reproduced in any form, or referred to in any other publication, without express written permission of VanEck.
© VanEck (Europe) GmbH / VanEck Asset Management B.V.