An Active Entry and Exit Strategy?
17 April 2020
Major price fluctuations on the stock market often leads to the question: When should I enter? Or maybe leave? The newspapers and bulletins will give you a performance graph that clearly shows that you should have entered at least six months ago. Or that you should have exited two months ago. It is all so obvious ... after the event!
Trading is for silver, holding is for gold
Personally, I am not in favour of active entry and exit. Why? Because it is difficult to create value from this. Markets sometimes respond very unpredictable to news. Take COVID-19. News filtered through drop by little drop. Some statements produced no reaction at all while others led to a massive response, both positive and negative.
Even well-trained investment specialists who are focused on the news throughout the day, generally with the assistance of very powerful computers, are aware that their decisions do not create any added value. This is also reflected in the disappointing returns on most actively managed funds.
Entering too late can also be very detrimental for your returns. The graph below gives the return on the VanEck Global Equal Weight UCITS ETF since its listing in 2011. The blue line shows the return on the EFT. The orange line when the 10 trading days were missed when the ETF increased the most. The gap speaks for itself.
Effect of missing the 10 most positive trading days
Total returns on an investment of €100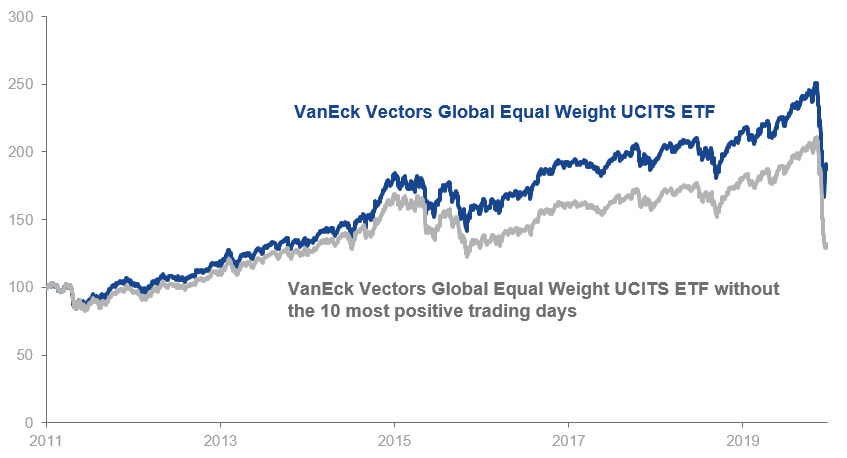
Returns achieved in the past are not a reliable indicator for the future. This is also true for historical market returns.
Source: VanEck. Data for the period from 14 April 2011 (fund listing date) to 31 March 2020. The returns are total returns, including reinvestment of the dividends. Dividends are gross, before deduction of dividend taxes.
Returns simulated in the past...
Do not be fooled by simulated returns. These are also referred to as back tests. They generally show that (surprising) mountains of gold were to be made. However, it is not difficult to determine an investment strategy after the fact that would have worked perfectly in the past. Whether this will be the case in the future, remains an open question.
Risk premium
Time and again, scientific research points to the fact that: the return on an investment comes from a risk premium over the long term. By investing money, you incur a risk: price risk, currency risk, etc. This risk must be rewarded financially and that is the positive investment return anticipated. By exiting, even if only temporarily, you miss out on this risk premium. Transaction fees will also increase if you repeatedly enter and exit.
Stop loss versus reweighting
Certain investors make use of so-called "stop-loss" orders. A stop-loss limit can, for example, be set at 15% below the purchase price. If the security falls to that level, it is automatically sold. The idea is that a loss could still be tolerated up to this level.
In my opinion, this is not the correct approach. Over longer periods, there is a greater possibility of the security falling below the stop-loss limit due to fluctuations that are entirely natural. If you exit at this point, you will miss any subsequent price increases.
If you want to cash in on price gains, you could consider actively changing your allocation between asset classes every now and then. For example, if the value of your shares increases, you could sell some of them and use the proceeds to buy bonds, and vice versa. This way you continue to be invested and continue to benefit from the risk premium.
Our VanEck Multi-Asset Allocation UCITS ETFs also does this on your behalf. It is reweighted every year. If an asset class has increased in relative terms, its weighting is reduced and split across the other asset classes.
The following graph compares the return on the VanEck Multi-Asset Balanced Allocation UCITS ETF against
- the standard VanEck Global Equal Weight UCITS ETF, and
- the VanEck Global Equal Weight UCITS ETF combined with a 15% stop-loss limit without re-entering the market afterwards.
Stop-loss strategy versus a balanced strategy
Total return on an investment of €100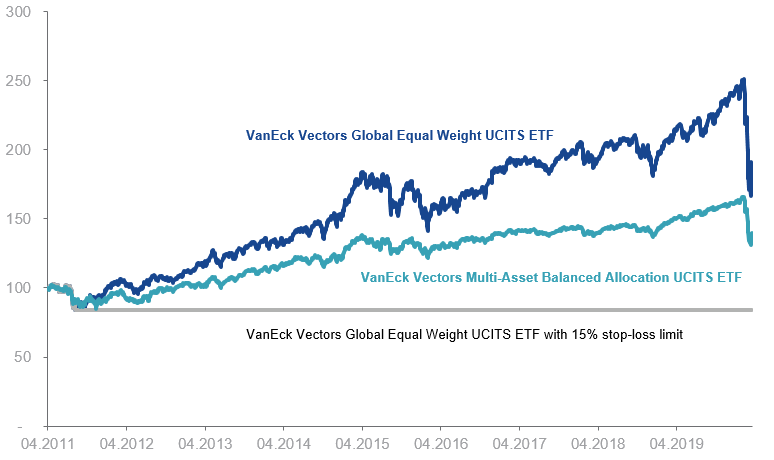
Returns achieved in the past are not a reliable indicator for the future. There are material differences between both ETFs: among others, the VanEck Multi-Asset Balanced Allocation UCITS ETF invests in multiple asset classes, while the VanEck Global Equal Weight UCITS ETF only invests in shares. Furthermore, the VanEck Multi-Asset Balanced Allocation UCITS ETF invests in 400 securities, while the VanEck Global Equal Weight UCITS ETF invests in 250 securities. There is also a difference in geographic exposure. This graph is based on the actual returns generated by our ETFs. Source: VanEck. Data for the period 14 April 2011 - 31 March 2020.
As you can see, with the stop-loss strategy, all that was generated was a 15% loss. In contrast, with the other strategies, you could have profited from a price increase in the long term after the initial fall. The VanEck Multi-Asset Balanced Allocation UCITS ETF has never dropped more than 15% below the issue price.
This example illustrated the market risk of investments. A price fall of 15% (or sometimes significantly more, as we have seen in the past few weeks) is an event an investor should be able to cope with. What is more, after a major fall in prices, the market conditions may make exiting disadvantageous. Increased volatility could also force market makers to increase the gap between bid and offer prices, which could also have a negative impact on your transaction price.
In conclusion
At the end of last week, after frenetic activity on the stock exchange, I sat down on Friday night to enjoy a glass of good red wine, a lovely 2011 Brunello. I realised that, in the circumstances, I too need to be patient for the next 10 years or so if I am to get a good return. On investments, I will once again think long-term.
Important Disclosure
This is a marketing communication. Please refer to the prospectus of the UCITS and to the KID before making any final investment decisions.
This information originates from VanEck (Europe) GmbH, which has been appointed as distributor of VanEck products in Europe by the Management Company VanEck Asset Management B.V., incorporated under Dutch law and registered with the Dutch Authority for the Financial Markets (AFM). VanEck (Europe) GmbH with registered address at Kreuznacher Str. 30, 60486 Frankfurt, Germany, is a financial services provider regulated by the Federal Financial Supervisory Authority in Germany (BaFin).
The information is intended only to provide general and preliminary information to investors and shall not be construed as investment, legal or tax advice VanEck (Europe) GmbH, VanEck Switzerland AG, VanEck Securities UK Limited and their associated and affiliated companies (together “VanEck”) assume no liability with regards to any investment, divestment or retention decision taken by the investor on the basis of this information. The views and opinions expressed are those of the author(s) but not necessarily those of VanEck. Opinions are current as of the publication date and are subject to change with market conditions. Certain statements contained herein may constitute projections, forecasts and other forward-looking statements, which do not reflect actual results. Information provided by third party sources is believed to be reliable and have not been independently verified for accuracy or completeness and cannot be guaranteed. Brokerage or transaction fees may apply.
All performance information is based on historical data and does not predict future returns. Investing is subject to risk, including the possible loss of principal.
No part of this material may be reproduced in any form, or referred to in any other publication, without express written permission of VanEck.
© VanEck (Europe) GmbH / VanEck Asset Management B.V.
Related Insights


Related Insights

14 March 2024

14 March 2024