Bitcoin Correlation to Gold Jumps in 2020
07 April 2020
Quick take:
- Long-term, bitcoin correlations with traditional asset classes remain low.
- Short-term, the market sell-off induced by the COVID-19 pandemic increased bitcoin correlations with traditional asset classes—particularly gold, potentially hinting at bitcoin’s increasing safe-haven status.
- A small bitcoin addition to a 60% equity/40% bond blended portfolio significantly reduced portfolio volatility during the recent market sell-off. While there are no UCITS bitcoin ETFs available today, we believe such products may have significantly reduced volatility for 60% equity/40% bond blended portfolios.
Our analysis shows that bitcoin correlation to gold remains low long-term. However, during the most recent COVID-19 induced broad market sell-off, bitcoin correlation to gold has increased significantly.
Bitcoin’s Correlation to Gold
In The Investment Case for Bitcoin, we discussed how bitcoin may potentially increase portfolio diversification because of its low correlation to traditional asset classes, including broad market equity indices, bonds and gold. As shown in our year-end long-term correlation table, this thesis has held up well. Here we examine bitcoin’s correlation to traditional asset classes during the most recent COVID-19 induced market downturn and the months leading up to it.
In our long-term study, considering correlation data between 2012 and late March 2020, bitcoin exhibits low correlation to traditional asset classes. Bitcoin falls into the -0.1 and 0.1 correlation range with most traditional asset classes.
|
Correlation |
S&P 500 |
Nasdaq |
US Bonds |
Bitcoin |
Gold |
US Real Estate |
Oil |
Emerging Market Currencies |
|
S&P 500 |
- |
0.96 |
-0.26 |
0.01 |
0.00 |
0.72 |
0.36 |
0.30 |
|
Nasdaq 100 |
0.96 |
- |
-0.26 |
0.00 |
-0.01 |
0.64 |
0.32 |
0.27 |
|
US Bonds |
-0.26 |
-0.26 |
- |
0.03 |
0.29 |
0.07 |
-0.16 |
0.11 |
|
Bitcoin |
0.01 |
0.00 |
0.03 |
- |
0.03 |
0.03 |
-0.04 |
-0.01 |
|
Gold |
0.00 |
-0.01 |
0.29 |
0.03 |
- |
0.10 |
0.08 |
0.29 |
|
US Real Estate |
0.72 |
0.64 |
0.07 |
0.03 |
0.10 |
- |
0.23 |
0.29 |
|
Oil |
0.36 |
0.32 |
-0.16 |
-0.04 |
0.08 |
0.23 |
- |
0.23 |
|
Emerging Market Currencies |
0.30 |
0.27 |
0.11 |
-0.01 |
0.29 |
0.29 |
0.23 |
- |
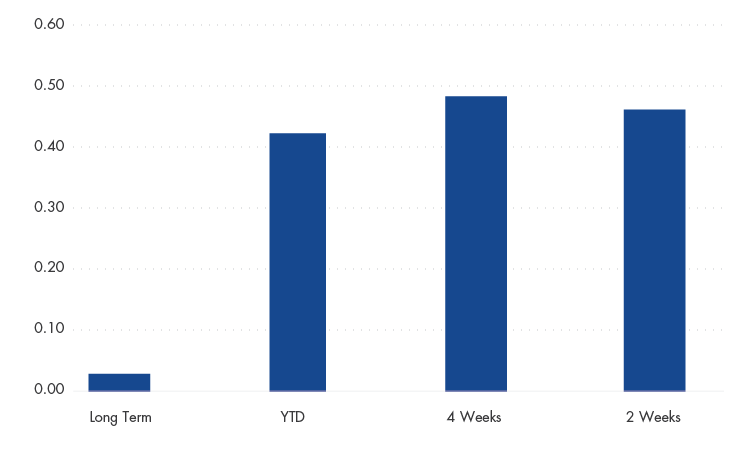
Looking at more recent correlation data, we note that bitcoin’s correlations with traditional asset classes have begun to increase during the COVID-19 induced global market sell-off. Most notably, bitcoin’s correlation with gold has reached levels never before seen. We believe this may further cements its relationship with what is commonly viewed as safe haven assets and may bolster its potential as “digital gold”. We also note that bitcoin correlations with U.S. bonds increased significantly. U.S. bonds historically served as safe-haven assets during equity market sell-offs.
Specifically, from 13 to 27 March, bitcoin’s correlation with gold was 0.47 and 0.13 with U.S. bonds while -0.25 with the S&P500, -0.18 with the Nasdaq 100 and only -0.12 with US real estate. Bitcoin showed no correlation with emerging market currencies and 0.15 with oil.
|
Correlation |
S&P 500 |
Nasdaq |
US Bonds |
Bitcoin |
Gold |
US Real Estate |
Oil |
Emerging Market Currencies |
|
S&P 500 |
- |
0.98 |
-0.22 |
-0.25 |
0.25 |
0.93 |
0.46 |
0.34 |
|
Nasdaq 100 |
0.98 |
- |
-0.24 |
-0.18 |
0.30 |
0.91 |
0.52 |
0.22 |
|
US Bonds |
-0.22 |
-0.24 |
- |
0.13 |
0.36 |
-0.07 |
0.16 |
0.41 |
|
Bitcoin |
-0.25 |
-0.18 |
0.13 |
- |
0.47 |
-0.12 |
0.15 |
0.00 |
|
Gold |
0.25 |
0.30 |
0.36 |
0.47 |
- |
0.26 |
0.19 |
0.13 |
|
US Real Estate |
0.93 |
0.91 |
-0.07 |
-0.12 |
0.26 |
- |
0.57 |
0.47 |
|
Oil |
0.46 |
0.52 |
0.16 |
0.15 |
0.19 |
0.57 |
- |
-0.07 |
|
Emerging Market Currencies |
0.34 |
0.22 |
0.41 |
0.00 |
0.13 |
0.47 |
-0.07 |
- |
After expanding that timeframe to four weeks, bitcoin’s correlation with gold was 0.49, 0.17 with U.S. bonds, 0.15 with the S&P 500, 0.19 with the Nasdaq 100 and only 0.18 with U.S. real estate. Bitcoin showed a 0.31 correlation with emerging market currencies and 0.27 with oil.
|
Correlation |
S&P 500 |
Nasdaq |
US Bonds |
Bitcoin |
Gold |
US Real Estate |
Oil |
Emerging Market Currencies |
|
S&P 500 |
- |
0.99 |
-0.17 |
0.15 |
0.25 |
0.94 |
0.56 |
0.50 |
|
Nasdaq 100 |
0.99 |
- |
-0.18 |
0.19 |
0.27 |
0.92 |
0.60 |
0.42 |
|
US Bonds |
-0.17 |
-0.18 |
- |
0.17 |
0.30 |
-0.05 |
-0.10 |
0.38 |
|
Bitcoin |
0.15 |
0.19 |
0.17 |
- |
0.49 |
0.18 |
0.27 |
0.31 |
|
Gold |
0.25 |
0.27 |
0.30 |
0.49 |
- |
0.30 |
0.16 |
0.27 |
|
US Real Estate |
0.94 |
0.92 |
-0.05 |
0.18 |
0.30 |
- |
0.59 |
0.58 |
|
Oil |
0.56 |
0.60 |
-0.10 |
0.27 |
0.16 |
0.59 |
- |
0.17 |
|
Emerging Market Currencies |
0.50 |
0.42 |
0.38 |
0.31 |
0.27 |
0.58 |
0.17 |
- |
Year to date, bitcoin’s correlation with gold was 0.42, 0.13 with U.S. bonds, 0.13 with the S&P 500, 0.16 with the Nasdaq 100 and 0.15 with U.S. real estate. Bitcoin showed a 0.29 correlation with emerging market currencies and 0.29 with oil.
|
Correlation |
S&P 500 |
Nasdaq |
US Bonds |
Bitcoin |
Gold |
US Real Estate |
Oil |
Emerging Market Currencies |
|
S&P 500 |
- |
0.99 |
-0.19 |
0.13 |
0.21 |
0.92 |
0.54 |
0.50 |
|
Nasdaq 100 |
0.99 |
- |
-0.20 |
0.16 |
0.22 |
0.89 |
0.56 |
0.43 |
|
US Bonds |
-0.19 |
-0.20 |
- |
0.13 |
0.32 |
-0.04 |
-0.08 |
0.33 |
|
Bitcoin |
0.13 |
0.16 |
0.13 |
- |
0.42 |
0.15 |
0.29 |
0.29 |
|
Gold |
0.21 |
0.22 |
0.32 |
0.42 |
- |
0.29 |
0.16 |
0.21 |
|
US Real Estate |
0.92 |
0.89 |
-0.04 |
0.15 |
0.29 |
- |
0.57 |
0.56 |
|
Oil |
0.54 |
0.56 |
-0.08 |
0.29 |
0.16 |
0.57 |
- |
0.19 |
|
Emerging Market Currencies |
0.50 |
0.43 |
0.33 |
0.29 |
0.21 |
0.56 |
0.19 |
- |
We also looked at the proportional addition of a 0.5%, 1% and 3% allocation to bitcoin to a 60% equity/40% bond blended portfolio. While YTD portfolio performance with a bitcoin allocation only held up slightly better than the 60-40 blend, we noted that a small addition of bitcoin significantly reduced the volatility (as measured by standard deviation) of the 60-40 blend.
|
Risk and Return |
Cumulative Return |
Std Dev |
Max Drawdown |
|
S&P 500 |
-20.96% |
69.04 |
-33.79 |
|
Bloomberg Barclays US Agg |
2.67% |
10.01 |
-6.30 |
|
60% EQ / 40% BD |
-11.92% |
39.13 |
-21.54 |
|
59.75% EQ / 39.75% BD / 0.5% BTC |
-11.89% |
32.42 |
-21.64 |
|
59.5% EQ / 39.5% BD / 1% BTC |
-11.86% |
32.39 |
-21.74 |
|
58.5% EQ / 38.5% BD / 3% BTC |
-11.75% |
32.30 |
-22.15 |
During the market selloff beginning on 2/20/2020, we saw that the volatility reduction of the bitcoin-included blended portfolio was even more pronounced than YTD figures.
|
Risk and Return |
Cumulative Return |
Std Dev |
Max Drawdown |
|
S&P 500 |
-24.78% |
101.75 |
-33.79 |
|
Bloomberg Barclays US Agg |
0.66% |
14.57 |
-6.30 |
|
60% EQ / 40% BD |
-15.20% |
57.54 |
-21.54 |
|
59.75% EQ / 39.75% BD / 0.5% BTC |
-15.32% |
49.08 |
-21.64 |
|
59.5% EQ / 39.5% BD / 1% BTC |
-15.44% |
49.02 |
-21.74 |
|
58.5% EQ / 38.5% BD / 3% BTC |
-15.91% |
48.84 |
-22.15 |
We conclude that while long-term bitcoin correlations with traditional asset classes remain low, in the short-term, the COVID-19 induced market sell-off increased bitcoin correlations with traditional asset classes. In particular correlations with gold increased during the sell-off, potentially hinting to bitcoin’s increasing safe-haven status. We also note that a small bitcoin addition to a 60% equity/40% bond blended portfolio may help to reduce portfolio volatility during the recent market sell-off. While there are no UCITS bitcoin exchange traded funds (ETFs) available today, we believe such products may have significantly reduced volatility for 60% equity/40% bond blended portfolios.
Source for all tables: Morningstar. US Bonds is measured by the Bloomberg Barclays US Aggregate Index; Gold is measured by the S&P GSCI Gold Spot Index; US Real Estate is measured by the MSCI US REIT Index; Oil is measured by the Brent Crude oil spot price, Emerging Market Currencies is measured by the Bloomberg Barclays EM Local Currency Government Index.
Belangrijke kennisgeving
Uitsluitend voor informatie- en advertentiedoeleinden.
Deze informatie is afkomstig van VanEck (Europe) GmbH. VanEck (Europe) GmbH is aangesteld als distributeur van VanEck-producten in Europa door VanEck Asset Management B.V., een beheermaatschappij onder Nederlands recht en geregistreerd bij de Nederlandse Autoriteit Financiële Markten (AFM). VanEck (Europe) GmbH, met als vestigingsadres Kreuznacher Str. 30, 60486 Frankfurt, Duitsland, is een financiële dienstverlener die onder toezicht staat van BaFin, de Duitse toezichthouder voor de financiële markten. De informatie is uitsluitend bedoeld om beleggers te voorzien van algemene en voorlopige informatie en mag niet worden opgevat als beleggings-, juridisch of fiscaal advies. VanEck (Europe) GmbH en de aan VanEck (Europe) GmbH verbonden en gelieerde bedrijven (samen "VanEck") wijzen elke aansprakelijkheid van de hand met betrekking tot beslissingen die de belegger op basis van deze informatie neemt ten aanzien van het kopen, verkopen of aanhouden van beleggingen. De visies en meningen die hier worden gegeven, zijn die van de auteur(s) en komen niet noodzakelijkerwijs overeen met die van VanEck. De meningen zijn actueel op de datum van publicatie en kunnen worden aangepast op basis van veranderende marktomstandigheden. Bepaalde verklaringen in deze bijdrage kunnen ramingen, voorspellingen en andere op de toekomst gerichte verklaringen zijn die niet overeenkomen met de werkelijkheid. Wij achten de informatie die afkomstig is van derden, betrouwbaar. Deze informatie is echter niet onafhankelijk gecontroleerd. De nauwkeurigheid en volledigheid ervan kunnen daarom niet worden gegarandeerd. Alle indices die worden vermeld, zijn maatstaven voor het vergelijken van algemene marktsectoren en rendementen. Het is niet mogelijk om rechtstreeks in een index te beleggen.
Alle rendementsgegevens hebben betrekking op het verleden en bieden geen garantie voor toekomstige resultaten. Beleggen brengt risico's met zich mee, waaronder mogelijk verlies van de hoofdsom. Lees het prospectus en de essentiële beleggersinformatie voordat u gaat beleggen.
Niets in dit materiaal mag in welke vorm dan ook worden verveelvoudigd en er mag ook niet naar worden verwezen in andere publicaties zonder de uitdrukkelijke schriftelijke toestemming van VanEck.
© VanEck (Europe) GmbH