China – Growth Weakness vs. Market Optimism
30 November 2022
Read Time 2 MIN
China Slowdown
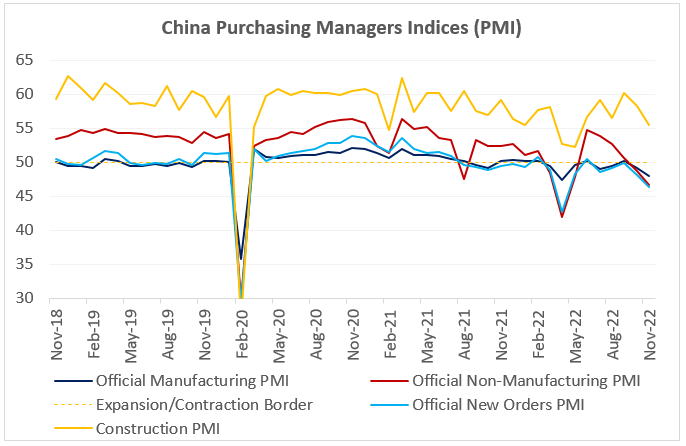
China’s domestic activity gauges for November were bad, no question about it. Most indices were well in contraction zone and deteriorating (see chart below). Even the construction PMI1 (Purchasing Managers Index) – which benefited from the earlier infrastructure stimulus – eased from 58.2 to 55.4. So, why is the market choosing to downplay the weakness? The answer is that authorities made several pre-emptive policy moves before the release, and, importantly, these initiatives address the underlying reasons of the slowdown – primarily real estate and re-opening.
China Real Estate Developers
The re-opening is still very tentative – the 20-point plan focuses on the optimization of the pandemic control, quarantine times, the frequency of testing and risk area delineations – but support for property developers looks more solid. The real estate package includes “stable financing” (the resumption of equity funding for listed companies, bond issuance, “reasonable” loan extension, relending facilities and absolving lenders from personal responsibility if something goes wrong), equal treatment of state-owned and private developers and mortgage support for homebuyers. Given the foregoing, it is not surprising that China’s High Yield/developers’ bonds staged a nice rally in the past week or so.
China Growth – Global Implications
One problem that China cannot fix on its own is weakening global demand – the new export orders PMI dropped to 46.7, which is the lowest level since May. “2023 Growth Cliff” is the most likely scenario for China’s main trade partners, and this underscores the importance of domestic pro-growth policies and orderly re-opening. Earlier reports about vaccination plans for the elderly and the easing of COVID restrictions in Guangzhou look encouraging, even though the progress will probably be slow and uneven (despite assertions that the anti-lockdown protests might turn out “stimulative”). The prospect of China’s domestic rebound – and commodity prices’ reaction to it – raises some interesting questions about (a) global disinflation and (b) growth spillovers in emerging markets (EM) (especially for commodity exporters). But this might be a story for Q2-Q3 next year. Stay tuned!
Chart at a Glance: China Activity Gauges – Still Sliding Down
Source: Bloomberg LP.
1 We believe PMIs are a better indicator of the health of the Chinese economy than the gross domestic product (GDP) number, which is politicized and is a composite in any case. The manufacturing and non-manufacturing, or service, PMIs have been separated in order to understand the different sectors of the economy. These days, we believe the manufacturing PMI is the number to watch for cyclicality.
Related Insights
Related Insights
07 April 2025
06 March 2025
20 February 2025
16 January 2025
07 April 2025
Trump’s tariffs spark trade war fears, fueling market volatility, inflation risk, and recession threats. With global retaliation likely, near-term growth is clearly at risk.
06 March 2025
Trump’s tariffs, AI’s next phase, and a potential U.S. gold revaluation could shake markets—investors who stay ahead of these transitions will be best positioned.
20 February 2025
China's AI breakthrough, persistent inflation, gold’s outperformance, and rising energy demand underscore a shifting investment landscape.
16 January 2025
In 2025, navigating turbulence means balancing tech innovation, inflation hedges, energy shifts, and risks from spending cuts and inflation.
05 December 2024
"Trump Trade 2.0" fueled U.S. equity and digital asset rallies, while real assets faltered under a strong dollar, with global markets reacting unevenly to pro-growth policies.