VanEck Reasserts Case for Gold Investing as Price Hits All-Time Highs
04 August 2020
Read Time 4 MIN
Our outlook has been bullish on gold since last summer, and the case for investing in gold has not been this compelling in years. Gold prices have reached all-time highs in recent days, surpassing the previous high set in September 2011, and we believe current price trends suggest a longer, sustained rally in gold, similar to the 2001-2008 secular rally.
We think the best guidance for the current gold market is to look at prior gold bull markets.
Since 1968, when gold was $35 per ounce, gold bull markets have fallen into two categories: inflationary and deflationary. We don’t see inflation spiking to 5% to 10% in the near future, like in the 1970s, so we believe this is a deflationary cycle. Deflationary conditions imply smaller negative real interest rates compared to the high inflation negative real interest rates of the 1970s—and therefore, we believe we will see a more modest price increases in gold than the 1970s.
Gold Price vs. Real Interest Rates
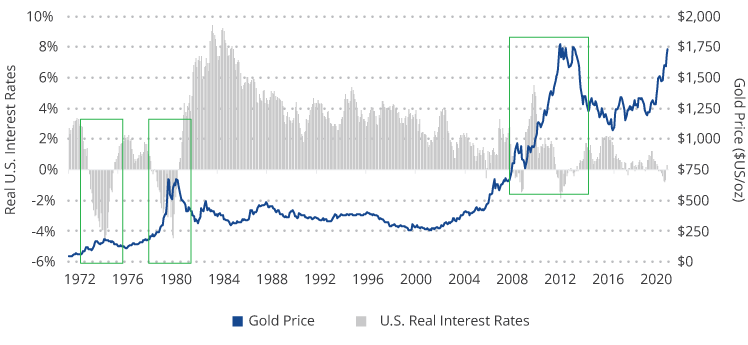
Source: VanEck, FactSet, Bloomberg. Data as of May 2020. Past performance is no guarantee of future results.
But both recent deflationary gold bull markets suggest that a price over $3,000 is reasonable in our view. If one measures the start of this bull market from the 2015 lows, then it appears similar to the long 2001-2008 bull market when gold rose over 200%, which may be over $3,000 per ounce.
Historical Gold Bull Market Rallies
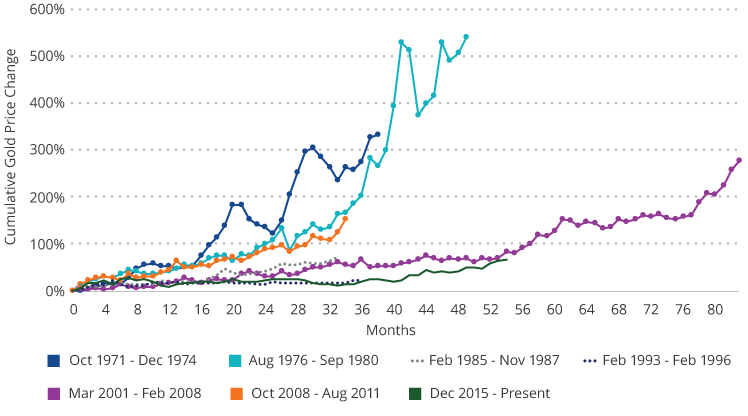
Source: VanEck, Bloomberg. Data as of June 2020. Past performance is no guarantee of future results.
If one believes, as we do, that the current central bank stimulus to fight the COVID-19 virus, along with elevated levels of systemic risks, are similar to those during the global financial crisis, then $3,400 may be the target for this bull market. This target comes from taking the post-financial crisis move of 150% on top of the $1,350 gold price base in the summer of 2019.
Of course, if there is a burst of inflation, major U.S. economic weakness or uncertainty, prices may go much higher. Some technicians also believe the price target could be over $4,000. On the negative side, gold could underperform alternatives like bitcoin, which outperformed gold in 2017, or silver, which outperformed in the bull market that peaked in 2011.1
Along with the persistence of negative real rates, we believe supply and demand dynamics appear in favor of the metal moving forward. Gold continues to be a scarce commodity, and the fact that there have been no significant new gold discoveries since 2016 only adds to its supply pressure. Demand for gold, however, has continued to rise as investors have sought exposure and central banks have added to their gold reserves.
Investors have long been attracted to gold’s many potential benefits. It has historically improved portfolio diversification, acted as an inflation hedge, and proven a safe haven asset in times of market uncertainty. But some may be surprised by its impressive total return since the turn of the century, proving gold’s appreciation potential.
Gold Outperformance (1/1/2000 – 6/30/2020)
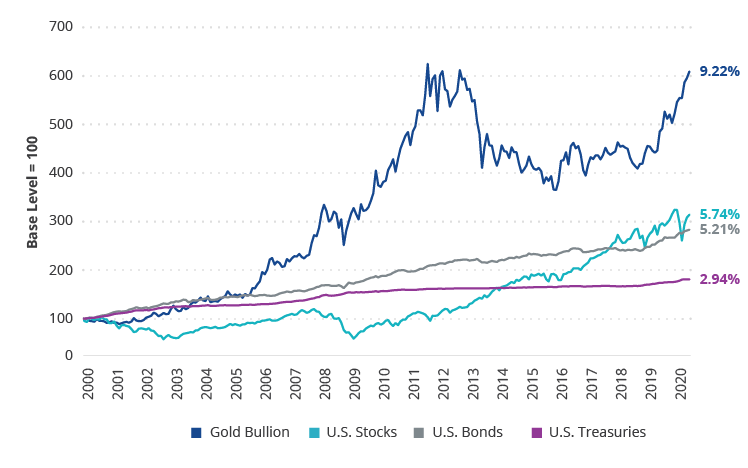
Source: Morningstar. US Stocks represented by S&P 500 Index; US Bonds represented by Bloomberg Barclays US Aggregate Bond Index; Gold Bullion represented by LBMA PM Gold Price; US Treasuries represented by the Bloomberg Barclays US 1-3 Year Treasury Bond Index. Past performance is not indicative of future results. Indices are not securities in which investments can be made. An index’s performance is not illustrative of a fund’s performance.
Investors can consider both a physical gold bullion investment as well as exposure to gold via companies that search for and extract gold from the ground, or gold miners. Both are affected by changes in the price of gold but offer different risk/reward profiles. Gold bullion has displayed a lower volatility profile historically and forms the basis for the price of gold. Gold miners, while a historically more volatile investment offering greater upside and downside, have reemerged from a period of management turnover and fiscal/corporate restructuring and are now better positioned to return value to shareholders in our view.
Current Gold Bull Market: Bullion and Miners Volatility (1/1/2016 – 6/30/2020)
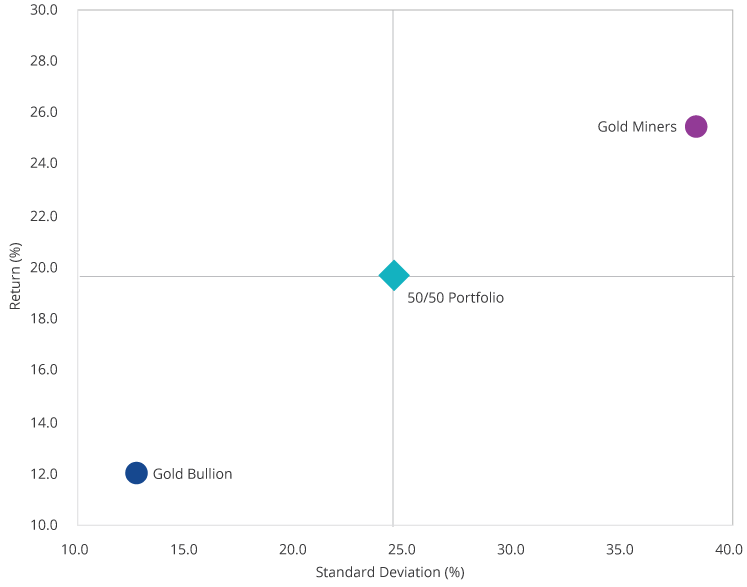
Source: Morningstar; VanEck. Volatility is measured by standard deviation. Standard deviation is a historical measure of the variability of returns relative to the average annual return. Past performance is no guarantee of future results.
Read VanEck’s Investment Case for Gold to learn more about the current gold bull market and how to position a portfolio for it.
Related Insights
Related Insights
10 March 2026
Gold miners are generating record margins and free cash flow as prices remain elevated. With disciplined capital allocation and costs below $2,000 per ounce, the sector appears well positioned for 2026.
10 February 2026
Gold price swings in January highlighted volatility, not weakness. Strong demand, central bank buying and improving miner fundamentals continue to support a durable long-term bull market in 2026.
14 January 2026
Gold hit record highs in 2025 as central banks and investors boosted demand. Mining stocks outpaced bullion, and despite sharp gains, attractive valuations and strong margins point to more upside in 2026.
18 December 2025
Get your portfolio ready for 2026 with detailed insights from VanEck’s investment team about the factors driving risk and returns in their respective asset classes.
09 December 2025
Gold rallied above $4,200 as markets shifted rate expectations. Record prices are driving disciplined mining-sector M&A, with the strongest opportunities in targeted regional consolidation.