Welcome to VanEck
Select Investor Type
15 October 2026
October 9 reports from the US Department of Agriculture (USDA) point to a large US crop. Corn production is forecast at 16.03 billion bushels, the second-largest on record, and soybeans at a record 4.56 billion bushels1. 2026/27 corn ending stocks rose to 1.849 billion bushels, up 282 million from September, while soybean ending stocks are 315 million2. Harvest turns crop volumes and prices into farm income, which shapes spending on seed, fertilizer and machinery over the next 12 to 18 months.
Harvest sets farm revenue, as volume multiplied by price, and that revenue funds the next season’s purchases. Once the crop is in, three activities follow in quick succession:
The United States is the world’s largest corn producer and, alongside Brazil, one of the two dominant soybean exporters. As a result, the US harvest helps set global grain balances, export prices and demand for farm inputs. The 2026 crop is large. USDA’s September Crop Production report puts the corn crop at 15.8 billion bushels, the second-highest on record even though yields of 178.5 bushels per acre are below last year’s record. Soybean production is forecast at 4.53 billion bushels, up 6% year on year and potentially an all-time high3. Prices have also firmed: USDA raised its 2026/27 season-average corn price to $4.80 per bushel and soybeans to $12.004.
Together, higher volumes and prices are lifting crop revenue: USDA expects total crop cash receipts of $253 billion in 2026, up 6.1%, with corn receipts up 11.3% and soybean receipts up 10%. Higher fertilizer, fuel and financing costs still weigh on margins, and net farm income is projected at $158.4 billion, slightly below 20255. Improving crop revenue could support farm spending, although higher costs may limit the effect.
Trade policy, however, remains a source of uncertainty. On September 28, China said it would cut tariffs on a broad range of US farm goods, from corn and wheat to meat, dairy, soyoil and soymeal, but excluded soybeans, its largest US farm import, which remain subject to an additional 10% tariff6.
Equipment demand is where the downturn shows most clearly. Farmers can delay machinery purchases, so sales follow farm profits and costs more than crop prices. Creighton University’s September survey of rural bankers put its farm equipment sales index at 25.0, up slightly from 22.2 in August but below 50, the line between growth and decline for the 37th month in a row7. Deere still expects US and Canadian large-ag industry sales to fall 15% to 20% in fiscal 20268.
At the same time, conditions for a recovery are forming. Manufacturers have spent two years cutting production and inventories; US farm machinery inventories are about 22% below their late-2022 peak9.
Farm Machinery & Equipment Manufacturers’ Total Inventories
Source: Manufacturers’ Total Inventories: Farm Machinery and Equipment Manufacturing. (2026). Stlouisfed.Org.
Deere’s management has stated that it expects 2026 to mark the bottom of the large-ag cycle, and early orders for planters and sprayers are running ahead of last year10. Smaller equipment is already improving: Deere’s Small Ag & Turf sales rose 12% last quarter on healthier livestock economics11.
McKinsey’s Global Farmer Insights 2026, a survey of 5,500 farmers across 10 countries, points to deferred demand. Only 16% of farmers name equipment as the first area to cut, while 36% expect to fund it first as profits recover, the largest positive swing of any spending category12. McKinsey notes that because machinery purchases can be deferred, demand may rebound more sharply when profitability improves.
Consensus forecasts reflect this shift. Sales for a weighted group of farm machinery makers, including Deere, CNH Industrial, AGCO and Kubota, contracted 3.8% a year over the past three years but are forecast to grow 4.3% next fiscal year and 6.7% the year after. Deere’s sales are expected to rise 5.6% and then 8.2%, and CNH’s sales are forecast to grow 10.3% in its second forecast year13.
The sector is concentrated, according to the Agribusiness Atlas 2026: the four largest farm machinery makers hold 43% of the global market14. Deere, the leader, grew net sales and revenues 7% to $35.6 billion in the first nine months of fiscal 2026 and raised its full-year net income outlook15. Leading companies are also expanding into digital agriculture; platforms such as John Deere Operations Center and Bayer’s Climate FieldView, the latter used across 90 million hectares, link machinery to field data and are described as increasingly important sources of profit16.
Across the Atlantic Ocean, on June 17th, 2026, the European Parliament adopted new rules for plants obtained with NGT (New Genomic Techniques), these regulations will come into effect on July 17th, 2026. What does this mean, more concretely? Take a pest-resistant apple, breeding this normally, without any complex genetic mutations this takes anywhere from 15-50 years, and with NGT only takes anywhere from 5-8 years in development time17. Before the new NGT law, in 2018 a European Court of Justice ruling classed organisms obtained through newer mutagenesis techniques, including gene editing as genetically modified organism (GMO)18 meaning that before any GMO can be sold it must pass a rigorous case by case safety assessment by the European Food Safety Authority, making it more difficult and time consuming to employ in Europe while other countries like Brazil already commercially deployed it. Meanwhile, European farmers were competing for market share against, for example Brazilian farmers19, who face less strict safety assessments for GM crops.
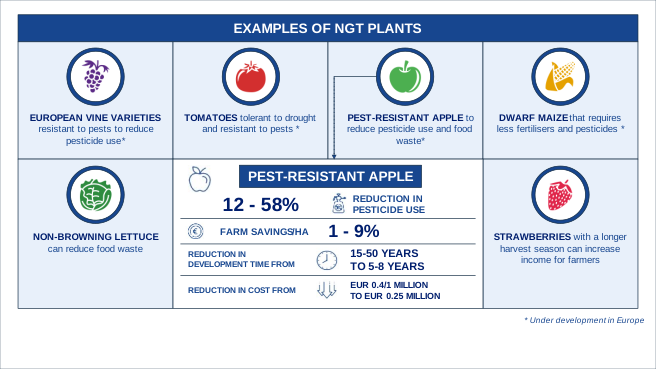
Source: EU Regulation (EU) 2026/1388 of the European Parliament and of the Council of 17 June 2026 on plants obtained by certain new genomic techniques and their products, and amending Regulation (EU) 2017/625 (Text with EEA relevance).
The main point of the new legislation is about the classifications of NGT plants applying for both import and EU grown plants. They are divided into two categories; NGT category 1, these are the plants that contain genetic changes that could also appear through conventional breeding or naturally, they then need to pass a verification procedure and then they are exempted from traditional GMO legislation. This means they are being treated like conventional plants. The 2nd category are plants with more (complex) genetic modifications and plants altered to be tolerant to herbicides or to produce known insecticidal substances, and thus they are being subjected to the standard EU GMO laws. This new framework also provides transparency because of the seed labeling for the category 1 plants, the GMO labeling for the category 2 plants, and the creation of a public database for NGT plants.
According to the European commission these new rules support innovation and sustainability while maintaining high health and environmental protection standards20. For European farmers this means they can now grow gene edited crops without the extra costs and delay of full GMO approval, provided they fall under category 1, making it easier for European farmers to compete with their international colleagues.
Taken together, the 2026 season links three parts of agribusiness. A large crop may support farm income, and farm income influences how quickly farmers return to buying inputs and machinery. Grain handlers and fertilizer producers could feel that first, while equipment makers may follow with a lag. Europe’s move on gene-edited crops is a longer-term development that may point to faster seed innovation and a more level playing field for European growers. Three things are worth watching: the remaining harvest, input and financing costs, and trade policy. These are forecasts on third-party data and assumptions that are subject to revision, and weather, commodity prices, tariffs, interest rates or geopolitical events could change the picture, so actual results may differ materially.
1 U.S. Department of Agriculture, National Agricultural Statistics Service. (2026, October 9). Crop production.
2 U.S. Department of Agriculture, Office of the Chief Economist. (2026, October 9). World agricultural supply and demand estimates [Report].
3 U.S. Department of Agriculture, National Agricultural Statistics Service. (2026, September 11). Crop production.
4 The Farm. (2026, September). September USDA report predicts less corn, more soybeans & milk.
5 Munch, D. (2026, September). USDA revises farm income higher, but costs still bite. American Farm Bureau Federation.
6 Cao, E., Thukral, N., & Jackson, L. (2026, September 28). China to cut tariffs on US farm goods, but list excludes soybeans. Reuters.
7 NAFB News Service. (2026, October 2). Rural Mainstreet Index falls on farm cost concerns. NewsDakota.
8 Market Review. (2026, August). Deere reports $1.38 billion quarterly profit as farm equipment market faces pressure. Deere & Company. (2026, August 20). Third quarter 2026 earnings release [Form 8-K].
9 farmdoc daily. (2026, August). Farm machinery demand remains weak as manufacturers manage production. University of Illinois.
10 Investing.com. (2026, August). Deere Q3 2026 slides: Construction strength offsets ag weakness.
11 aginsights. (2026, August). Q3 results: Deere sees 2026 as the bottom of the ag cycle as small ag rebounds ahead of large equipment.
12 McKinsey & Company. (2026, September 8). Global farmer insights 2026.
13 Bloomberg. (2026). Consensus estimates: Sales and EPS growth forecasts [Data set]. Retrieved October 1, 2026, from Bloomberg Terminal.
14 Heinrich-Böll-Stiftung, Friends of the Earth Europe, IPES-Food, & Association of Ethical Shareholders. (2026). Agribusiness atlas 2026: Facts and figures about the corporations that control what we eat (pp. 10–11).
15 Deere & Company. (2026, August 20). Third quarter 2026 earnings release [Form 8-K].
16 Heinrich-Böll-Stiftung, Friends of the Earth Europe, IPES-Food, & Association of Ethical Shareholders. (2026). Agribusiness atlas 2026: Facts and figures about the corporations that control what we eat (p. 30).
17 European Commission. (2026). EU rules on new genomic techniques (NGTs) [Fact sheet].
18 Bartunek, R.-J. (2018, July 25). Top EU court: GMO rules cover plant gene editing technique. Reuters.
19 USDA Foreign Agricultural Service. (2023, December). Agricultural biotechnology annual: Brazil (GAIN Report No. BR2023-0027).
20 European Commission. (n.d.). New genomic techniques.
IMPORTANT INFORMATION
This is marketing communication.
This information originates from VanEck (Europe) GmbH, which is authorized as an EEA investment firm under the Markets in Financial Instruments Directive (“MiFiD”). VanEck (Europe) GmbH has its registered address at Kreuznacher Str. 30, 60486 Frankfurt, Germany, and has been appointed as distributor of VanEck products in Europe by the Management Company, VanEck Asset Management B.V.(“ManCo”), which is incorporated under Dutch law and registered with the Dutch Authority for the Financial Markets (AFM).
This material is only intended for general and preliminary information and does not constitute an investment, legal or tax advice. No representation or warranty is made as to the accuracy or completeness of the information and no liability is accepted to the fullest extent permitted by law.
The views and opinions expressed are those of the author(s) but not necessarily those of VanEck. Opinions are current as of the publication date and are subject to change with market conditions. Information provided by third party sources is believed to be reliable and has not been independently verified for accuracy or completeness and cannot be guaranteed.
Investing is subject to risk, including the possible loss of principal. For any unfamiliar technical terms, please refer to ETF Glossary | VanEck.
No part of this material may be reproduced in any form, or referred to in any other publication, without express written permission of VanEck.
© VanEck (Europe) GmbH
This is a marketing communication. Please refer to the prospectus of the UCITS and to the KID before making any final investment decisions.
This information originates from VanEck (Europe) GmbH, which has been appointed as distributor of VanEck products in Europe by the Management Company VanEck Asset Management B.V., incorporated under Dutch law and registered with the Dutch Authority for the Financial Markets (AFM). VanEck (Europe) GmbH with registered address at Kreuznacher Str. 30, 60486 Frankfurt, Germany, is a financial services provider regulated by the Federal Financial Supervisory Authority in Germany (BaFin).
The information is intended only to provide general and preliminary information to investors and shall not be construed as investment, legal or tax advice VanEck (Europe) GmbH, VanEck Switzerland AG, VanEck Securities UK Limited and their associated and affiliated companies (together “VanEck”) assume no liability with regards to any investment, divestment or retention decision taken by the investor on the basis of this information. The views and opinions expressed are those of the author(s) but not necessarily those of VanEck. Opinions are current as of the publication date and are subject to change with market conditions. Certain statements contained herein may constitute projections, forecasts and other forward-looking statements, which do not reflect actual results. Information provided by third party sources is believed to be reliable and have not been independently verified for accuracy or completeness and cannot be guaranteed. Brokerage or transaction fees may apply.
All performance information is based on historical data and does not predict future returns. Investing is subject to risk, including the possible loss of principal.
No part of this material may be reproduced in any form, or referred to in any other publication, without express written permission of VanEck.
© VanEck (Europe) GmbH / VanEck Asset Management B.V.