Welcome to VanEck
Select Investor Type
19 October 2026
For most of the past decade, the bond allocation in a portfolio did one thing well and one thing badly. It cushioned growth scares well, because when recession fears hit equities, bond yields fell and prices rose. But it was bad at delivering real return as it earned almost nothing from yields that were near zero. When inflation returned in 2022, though, it didn’t do anything well because bonds fell alongside equities, and the more of them you held the more you lost.
That experience has left many investors not knowing how to regard fixed income. This article makes the case, with some arithmetic, that the prospects for bonds look very different from five years ago. Following the recent rises in yields, bonds carry a margin of safety they did not have then. Among higher-yielding bond categories, that margin is large, and the income on offer compares well with equities’ total returns delivered over the long run.
To understand why bonds are in a better position, a little arithmetic is needed1. A bond’s total return over the next year is, to a close approximation, its yield less its duration (which measures price sensitivity to yields: a duration of eight means a one percentage point rise in yields triggers a fall of roughly 8% in a bond’s price) multiplied by any rise in yields2. That calculation explains why 2022 was so painful.
At the end of 2021, the 7–10 year US Treasury index yielded just 1.45% with a duration of 8.2 years: a rise in yields of just 18 basis points (0.18 percentage points) over the following 12 months would have wiped out a year’s income. In the event, yields rose 237 basis points, and the index lost 15%3,12.
Run the same arithmetic today and the picture is far brighter. The same Treasury index yields 5.2% with a duration of 6.9 years, so it can now absorb a 78 basis point rise before its 12-month return turns negative — four times the cushion of 2021. The improvement comes from both ends: yields are much higher, and durations have shortened as companies have repaid the low-coupon bonds of the previous decade.
Income Now Covers a Meaningful Rise in Yields
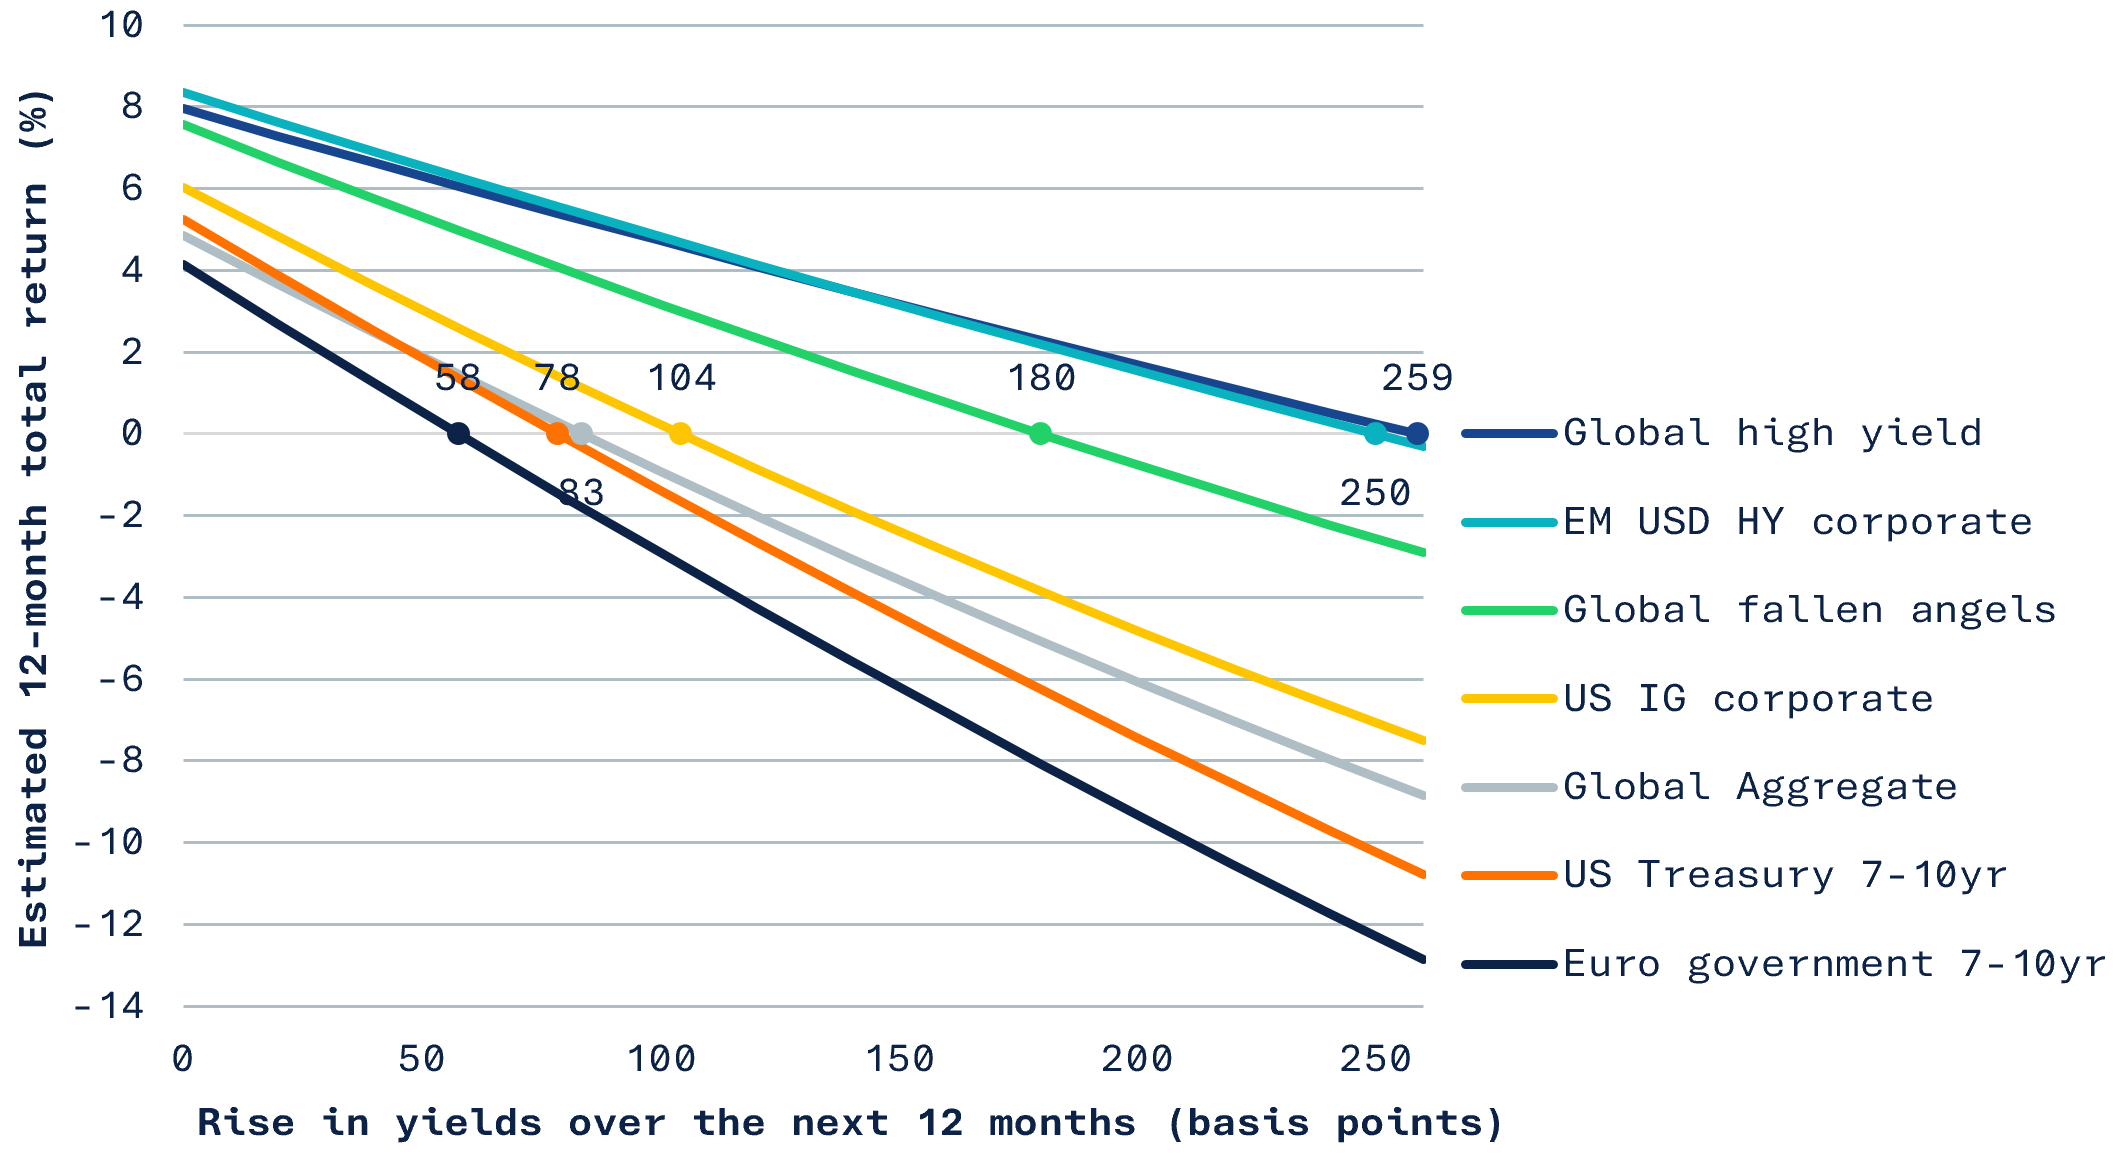
Estimated 12-month total return under a parallel rise in yields, by fixed income segment, as of 30 September 2026. Dots mark the breakeven: the rise in yields at which the 12-month return reaches zero, including the convexity term. Spreads assumed unchanged. Source: ICE Data Indices; VanEck calculations.
All fixed income categories can now absorb a bigger increase in yields, although higher yield bonds have a bigger cushion. Assuming a 100 basis point rise in yields, every government bond segment in the chart above loses money and every corporate bond segment still makes money. Global high yield bonds, with a yield of 7.95% and a duration of 3.3 years, return an estimated +4.7% in that scenario and the total return is still positive at +200 basis points. The breakeven — the rise in yields that would erase a year of income — is 259 basis points, against 122 at the end of 2021.
The arithmetic above assumes that spreads remain constant, although in reality spreads can widen. The global high yield index’s option-adjusted spread of 312 basis points sits in the bottom sixth of its range over the past decade4. Measured against government bonds, the cushion is thin: a widening of around 96 basis points would erase high yield’s extra return over government bonds for the year, leaving an investor no better off. Measured in absolute terms, though, global high yield still looks in a strong position: spreads would need to widen by roughly 260 basis points for the year’s income to be lost entirely. The case made here rests on the bonds’ income, not on spreads tightening further.
The second caveat regards what kind of event might shock the fixed income market. In an economic growth scare, rates and spreads tend to move in opposite directions and partly offset each other. In 2020, high yield spreads widened by over 700 basis points during the worst of the pandemic selloff, yet the US high yield index ended the year up 6% as US Treasury bond yields fell5. In an inflation shock they move together, as 2022 showed — though even then the US high yield index lost less than the Treasury index, because its income was higher and its duration shorter5. If inflation is now a recurring risk rather than a dormant one, the second kind of shock is the one to plan for, and that is where the cushion matters most.
Over longer horizons, the starting yield does more than cushion your returns: it indicates them. For investment grade corporate bonds, the starting yield at the time an investment is made explains around 70% of the variation in the subsequent five-year annualized return, and realized returns have on average matched the starting yield almost exactly6. For high yield bonds the relationship is looser, because it’s disrupted by credit defaults and because the yield at which you sell five years later is rarely the yield at which you bought. Starting yield explains 57% of the variation in the global high yield index’s subsequent five-year returns, and realized returns have fallen short of the starting yield by a median of 1.0 percentage point a year6.
Starting Yield and the Return That Followed
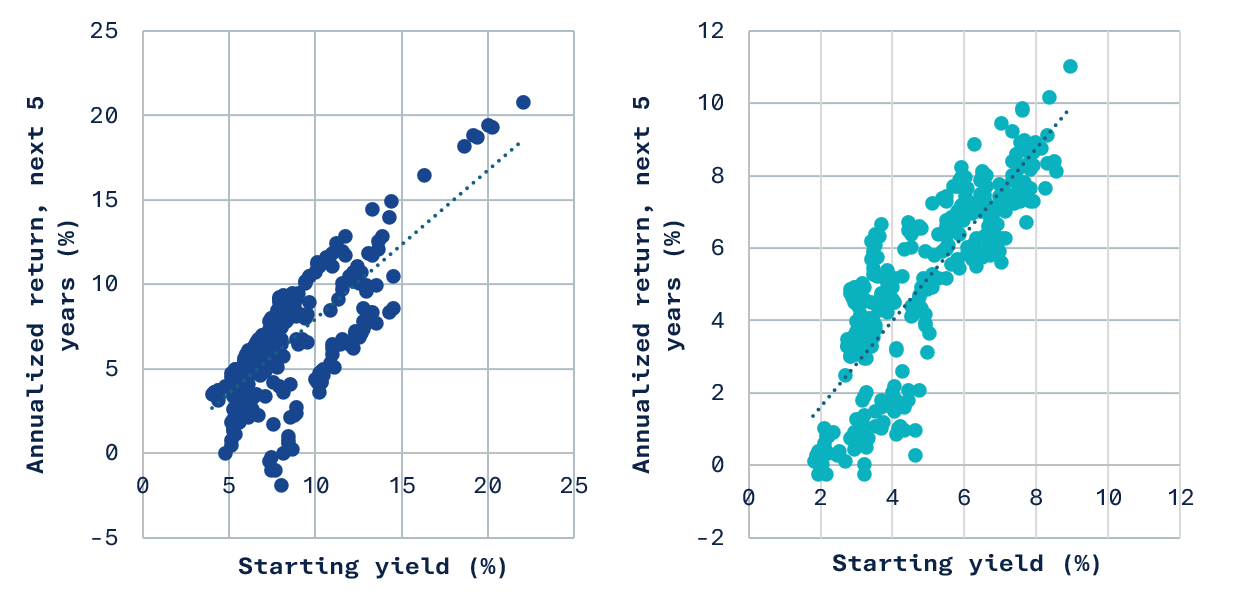
Yield to worst at month-end against annualized total return over the following five years, December 1997 to September 2021 (global high yield) and October 1994 to September 2021 (US investment grade). Dashed line shows return equal to starting yield. Source: ICE Data Indices; VanEck calculations.
Two numbers anchor this calculation. From 2014–2025, the global high yield index experienced a par-weighted default rate (a metric that measures the proportion of the index that has defaulted) averaging 1.6% a year, with recoveries of around 35% — a credit loss of roughly 1% a year7. The worst year, 2020, cost 2.4%.
From starting yields between 7% and 9% — the band today’s global high yield index yield of 7.95% sits in — the median five-year return that followed was 7.4% a year. Half the outcomes fell between 5.9% and 8.4%; every outcome below 5% came from a period including 20086. Around 7% annual return is what the record suggests. Nobody should call that a forecast — a yield is not a return, and it changes as prices move — but it is a better guide than most.
Past performance is not a reliable indicator of future results. Index returns are shown gross of fees and other costs; it is not possible to invest directly in an index.
Around 7% is a number worth comparing with returns from equities. The global high yield index has not matched them outright — returning 6.2% a year over the 28 years to the end of 2025 against 7.6% for the MSCI World index — but it came closer than bonds’ reputation suggests. What’s more, the global high yield index’s 9% volatility was considerably less than the MSCI World Index’s 15%8.
Over rolling ten-year holding periods, the two have achieved similar returns: a median of 7.1% a year for global high yield, against 7.2% for global equities. Where they differ is at the bottom of the performance range. High yield’s worst decade saw it return 1.4% a year; in the global equity index’s worst decade it lost 2.5% a year. Equities win over five-year windows in terms of performance, but with a worst case loss of 5.7% a year against just 1.6% for global high yield bonds8.
Level Over a Decade
Annualized total return over the preceding ten years, monthly, windows ending December 2007 to September 2026. Dashed line is global high yield’s yield to worst at 30 September 2026. Source: ICE Data Indices; Bloomberg; VanEck calculations.
The reason for the discrepancy is that when the equity market has fallen hard, high yield has fallen far less. Measured peak to trough, the MSCI World index fell 50% in 2000–03 against 15% for bonds, 58% in 2007–09 against 36%, 30% in 2011 against 12%, and 17% in the correction of early 2025 against 3%9. The exception is 2022, when both fell together and the gap narrowed to 26% for equities against 21% for high yield — caused by the inflation shock described earlier. The two episodes where the gap was widest, 2000–03 and 2025, were both selloffs led by the largest stocks in the index.
Past performance is not a reliable indicator of future results. Index returns are shown gross of fees and other costs; it is not possible to invest directly in an index.
A Fraction of the Fall
Drawdown from previous peak, daily, 31 December 1997 to 30 September 2026. Source: ICE Data Indices; Bloomberg; VanEck calculations.
What few people appreciate is that the global high yield index is far more diversified than the equity index. The ten largest stocks in the MSCI World Index account for 28% of it; the largest single stock accounts for 5.8%, and its three largest sectors come to 58%10. By contrast, the global high yield index holds 1,520 issuers, with its ten largest making up 8% and no single name above 2%10. But the sharper point is not the count. Not one of the ten largest companies in MSCI World appears anywhere in the global high yield index — they are all investment grade borrowers. Where the equity index is concentrated in a handful of American technology companies, high yield bond concentration runs to energy, basic industry, telecoms and utilities.
Within global high yield bonds, an investor can choose which version of that risk to take. For instance, the global fallen angel index looks concentrated — its ten largest issuers account for 39% of it — but they span six countries and six industries. This index is also the highest-quality corner of high yield: with 88% of the bonds by value BB-rated, defaulting at around 40% below the rate of the broad index over the past 12 years, and 8% of the index’s par value returning to investment grade each year (against less than 4% for the broad index)11. Emerging market high yield corporates are more diversified: the index holds 326 issuers, with some 18% of market value in the ten largest. Moreover, this index has the lowest correlation to global equities over 10 years of any high yield segment at 0.6511.
Neither is a free lunch. The fallen angels index has a longer duration than the broad high yield index — 4.6 years against 3.3 — so its income covers a 180 basis point rise in yields rather than 259. Emerging market high yield has the weakest ten-year record of the group and fell 27% in 2022 — though it starts from the highest yield of the three, at 8.35%11.
Different Concentration
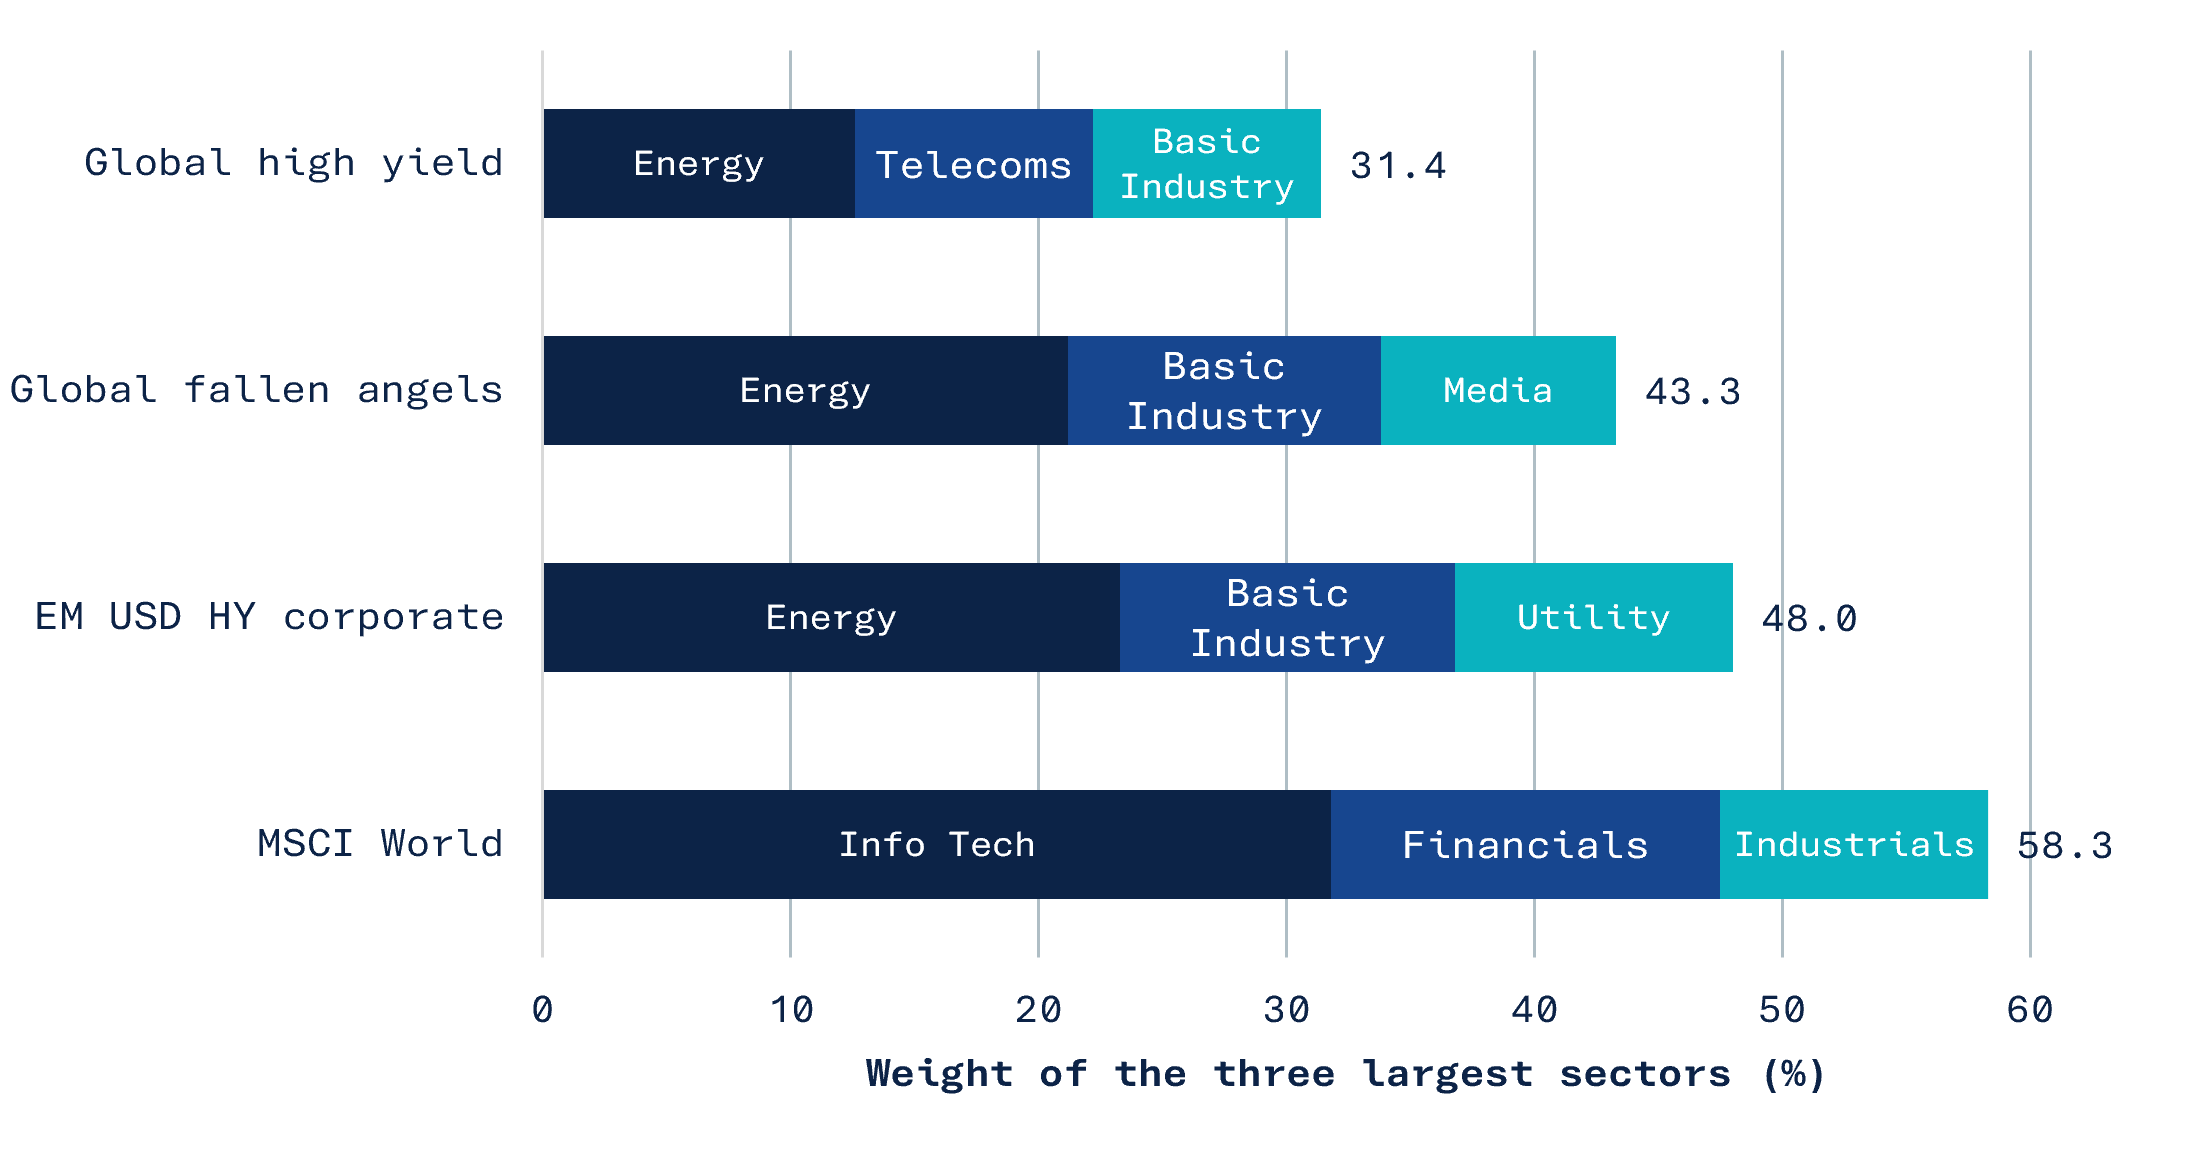
Weight of the three largest sectors in each index, as of 30 September 2026. Bond index sectors per ICE level-3 classification; MSCI World per GICS, as of 30 September 2026. Source: ICE Data Indices; MSCI; VanEck calculations.
Global high yield is a second source of return, not a hedge against equities: its monthly correlation to the MSCI World Index is 0.74, and it falls when equities fall8. What it offers is a return that does not depend on the same ten companies, with a shallower drawdown (price fall from peak to trough) and an income that is paid regardless of whether the equity market rallies. Other bonds can fulfil the role in a portfolio of diversifying away from equities — government bonds can do so in a growth shock, and assets such as local-currency emerging market debt can do so more generally, as their interest rate cycles run independently of developed market central banks.
None of what’s set out in this article depends on a view of whether interest rates are set to rise or fall. It’s just pointing out that while bonds were priced for perfection five years ago, they’re priced very differently now. Income once again compensates for the possibility of a bad year for interest rates; in high yield bonds it compensates for a very bad one.
For a euro-based investor, hedging the dollar exposure in the global high yield index costs roughly the gap between US and euro short-term rates — currently around 1.4 percentage points, though less at the index level because a fifth of the index is already euro-denominated. Over the past 28 years that cost has averaged 1.0 point a year, leaving a euro-hedged starting yield near 6.8% against 4.1% in euro government bonds. The yield cushion is smaller in euros, but it is still there — and that, after a decade in which it was not, is the point.
1 Indices referred to in this article, with the short forms used in the text. Global high yield: ICE BofA Global High Yield Index (HW00). US high yield: ICE BofA US High Yield Index (H0A0). Euro high yield: ICE BofA Euro High Yield Index (HE00). Global fallen angel: ICE Global Fallen Angel High Yield 10% Constrained Index (HWCF). Emerging market high yield corporates: ICE BofA Diversified High Yield US Emerging Markets Corporate Plus Index (EMLH). US investment grade: ICE BofA US Corporate Index (C0A0). Euro investment grade: ICE BofA Euro Corporate Index (ER00). Global aggregate: ICE BofA Global Broad Market Index (GBMI). US Treasury 7–10 year: ICE US Treasury 7–10 Year Bond Index (IDCOT7). Euro government 7–10 year: ICE BofA 7–10 Year All Euro Government Index (E4AS). Emerging market US dollar sovereign: ICE BofA US Emerging Markets External Sovereign Index (DGOV). Emerging market local currency: ICE BofA Local Debt Markets Plus Index (LDMP). Global equities: MSCI World Net Total Return Index.
2 Twelve-month total return approximated as yield to worst less effective duration times the change in yield, plus a convexity adjustment, assuming a parallel shift and unchanged spreads. The approximation ignores roll-down, reinvestment and defaults.
3 ICE US Treasury 7–10 Year Bond Index (IDCOT7), 31 December 2021 to 30 December 2022. Source: ICE Data Indices.
4 ICE BofA Global High Yield Index (HW00) option-adjusted spread, monthly, October 2016 to September 2026: 312bp at 30 September 2026 versus a low of 270bp and a median of 389bp. Source: ICE Data Indices.
5 ICE BofA US High Yield Index (H0A0) and ICE US Treasury 7–10 Year Bond Index, daily. 2020: spread widening from 19 February to 23 March 2020; calendar-year total returns. 2022: change in yield and spread, and total return, 31 December 2021 to 30 December 2022. Source: ICE Data Indices.
6 Regression of annualized total return over the following 60 months on month-end yield to worst. Global high yield: ICE BofA Global High Yield Index, 286 monthly starts, December 1997 to September 2021, R² 0.57; realized returns fell short of starting yield by a median of 0.97 and a mean of 1.85 percentage points. US investment grade: ICE BofA US Corporate Index, 324 starts, October 1994 to September 2021, R² 0.69. From starting yields of 7–9%, the median subsequent five-year return was 7.4% a year, with an interquartile range of 5.9% to 8.4%. Total returns in local-currency terms. Source: ICE Data Indices; VanEck calculations.
7 ICE BofA Global High Yield Index rating-migration data, monthly par-weighted default rates summed to annual, 2014–2025. Counts bonds that defaulted while in the index and so excludes most distressed exchanges; rating-agency default rates run higher. Source: ICE Data Indices.
8 MSCI World Net Total Return Index and ICE BofA Global High Yield Index, both in US dollars, month-end. Annualized returns and volatility measured over the 28 years from 31 December 1997 to 31 December 2025, a whole number of twelve-month periods. Rolling windows of 120 and 60 months, the last ending 30 September 2026. Correlation of monthly returns over the full period to 30 September 2026. Correlation and annualized volatility of monthly returns. Euro-hedged high yield returns use the index’s EUR-hedged variant. The earlier sections on carry and on yield versus forward return use local-currency returns instead, since yield to worst on a multi-currency index is itself a local-currency measure; for global high yield the two bases differ by three basis points a year over this period. Source: Bloomberg; ICE Data Indices; VanEck calculations.
9 Peak-to-trough drawdowns on daily data: ICE BofA Global High Yield Index and MSCI World Net Total Return Index. Episodes: March 2000 to March 2003; October 2007 to March 2009; 29 April to 31 October 2011; January to October 2022; February to April 2025. Source: ICE Data Indices; Bloomberg; VanEck calculations.
10 ICE BofA Global High Yield Index constituents as of 30 September 2026, issuers grouped by ICE ticker, weights by market value; sector per ICE level-3 classification. MSCI World Index factsheet, 30 September 2026: ten largest constituents 27.85%, Information Technology 31.78%. The two sector classifications are not directly equivalent — ICE level-3 and GICS divide the market differently — so the comparison is of each index’s three largest sectors rather than of like-for-like categories. Source: ICE Data Indices; MSCI.
11 ICE Global Fallen Angel High Yield 10% Constrained Index (HWCF) and ICE BofA Diversified High Yield US Emerging Markets Corporate Plus Index (EMLH). Composition, rating distribution and sector weights from constituent files as of 30 September 2026, by market value; sector per ICE level-3 classification; issuer domicile per ICE country code. Yield to worst, effective duration and breakeven as of 30 September 2026. Default and rising-star rates from ICE rating-migration data, 2014–2025, par-weighted. Returns, volatility, correlation to the MSCI World Net Total Return Index and maximum drawdown measured month-end over the common history from October 2016 to September 2026; the 2022 drawdown is peak-to-trough on daily data. Source: ICE Data Indices; Bloomberg; VanEck calculations.
12 All return, yield and volatility figures in this article are index figures, shown gross of the commissions, fees and other charges an investor would incur. It is not possible to invest directly in an index. An investment tracking an index would bear ongoing charges, transaction costs and, depending on the route to market, custody or platform fees, each of which reduces the return actually achieved.
IMPORTANT INFORMATION
This is marketing communication.
This information originates from VanEck (Europe) GmbH, which is authorized as an EEA investment firm under the Markets in Financial Instruments Directive (“MiFiD”). VanEck (Europe) GmbH has its registered address at Kreuznacher Str. 30, 60486 Frankfurt, Germany, and has been appointed as distributor of VanEck products in Europe by the Management Company, VanEck Asset Management B.V.(“ManCo”), which is incorporated under Dutch law and registered with the Dutch Authority for the Financial Markets (AFM).
This material is only intended for general and preliminary information and does not constitute an investment, legal or tax advice. No representation or warranty is made as to the accuracy or completeness of the information and no liability is accepted to the fullest extent permitted by law.
The views and opinions expressed are those of the author(s) but not necessarily those of VanEck. Opinions are current as of the publication date and are subject to change with market conditions. Information provided by third party sources is believed to be reliable and has not been independently verified for accuracy or completeness and cannot be guaranteed.
The MSCI information may only be used for your internal use, may not be reproduced or redisseminated in any form and may not be used as a basis for or a component of any financial instruments or products or indices. None of the MSCI information is intended to constitute investment advice or a recommendation to make (or refrain from making) any kind of investment decision and may not be relied on as such. Historical data and analysis should not be taken as an indication or guarantee of any future performance analysis, forecast or prediction. The MSCI information is provided on an “as is” basis and the user of this information assumes the entire risk for any use made of this information. MSCI, each of its affiliates and each other person involved in or related to compiling, computing or creating any MSCI information (collectively, the “MSCI Parties”), expressly disclaims all warranties (including, without limitation, any warranties of originality, accuracy, completeness, timeliness, noninfringement, merchantability and fitness for a particular purpose) with respect to this information. Without limiting any of the foregoing, in no event shall any MSCI Party have any liability for any direct, indirect, special, incidental, punitive, consequential (including, without limitation, lost profits) or any other damages. It is not possible to invest directly in an index.
Investing is subject to risk, including the possible loss of principal. For any unfamiliar technical terms, please refer to ETF Glossary | VanEck.
No part of this material may be reproduced in any form, or referred to in any other publication, without express written permission of VanEck.
© VanEck (Europe) GmbH
This is a marketing communication. Please refer to the prospectus of the UCITS and to the KID before making any final investment decisions.
This information originates from VanEck (Europe) GmbH, which has been appointed as distributor of VanEck products in Europe by the Management Company VanEck Asset Management B.V., incorporated under Dutch law and registered with the Dutch Authority for the Financial Markets (AFM). VanEck (Europe) GmbH with registered address at Kreuznacher Str. 30, 60486 Frankfurt, Germany, is a financial services provider regulated by the Federal Financial Supervisory Authority in Germany (BaFin).
The information is intended only to provide general and preliminary information to investors and shall not be construed as investment, legal or tax advice VanEck (Europe) GmbH, VanEck Switzerland AG, VanEck Securities UK Limited and their associated and affiliated companies (together “VanEck”) assume no liability with regards to any investment, divestment or retention decision taken by the investor on the basis of this information. The views and opinions expressed are those of the author(s) but not necessarily those of VanEck. Opinions are current as of the publication date and are subject to change with market conditions. Certain statements contained herein may constitute projections, forecasts and other forward-looking statements, which do not reflect actual results. Information provided by third party sources is believed to be reliable and have not been independently verified for accuracy or completeness and cannot be guaranteed. Brokerage or transaction fees may apply.
All performance information is based on historical data and does not predict future returns. Investing is subject to risk, including the possible loss of principal.
No part of this material may be reproduced in any form, or referred to in any other publication, without express written permission of VanEck.
© VanEck (Europe) GmbH / VanEck Asset Management B.V.

15 October 2026
15 October 2026