The Moat Stocks that Powered 2019 Outperformance
13 January 2020
2019 was an impressive capstone to an equally impressive decade for the Morningstar® Wide Moat Focus IndexTM (“Moat Index”). Superior stock selection was the theme of the year, with KLA Corp. (KLAC), Applied Materials Inc. (AMAT) and Facebook (FB) being the top contributors to Moat Index performance. Each company benefits from sustainable competitive advantages according to Morningstar equity analysts, and the Moat Index allocated to these companies at attractive entry points based on their market price relative to Morningstar’s assessment of fair value. The Moat Index finished the year ahead of the S&P 500 Index by more than four percent (35.65% vs. 31.49%, respectively) and led in all standard trailing periods for the decade.
Decade of Outperformance
Trailing Return (%) as of 31/12/2019
| 1 YR | 3 YR | 5 YR | 10 YR | |
|---|---|---|---|---|
| Moat Index | 35.65 | 18.57 | 14.32 | 15.03 |
| S&P 500 Index | 31.49 | 15.27 | 11.70 | 13.56 |
All Systems Are Go for This Semiconductor Moat Stock
KLA Corp. may not be a household name, but it is a powerhouse in the semiconductor industry. According to Morningstar, its portfolio process, diagnostics and control tools combined with its leading technical expertise allow KLAC products to be in every major chip manufacturing facility in the world.
2010 was the last time KLAC was present in the Moat Index. At the time it traded at a steep discount to Morningstar’s fair value estimate but has since traded mostly at or above fair value until a buying opportunity presented itself. KLAC was first added to the Moat Index in September 2018 and its weighting was subsequently increased in December 2018. The discount to fair value has since eroded, and KLAC ended the year trading above Morningstar’s fair value estimate.
KLAC’s position was scaled back in September 2019 allowing the Moat Index to lock in much of the gains during that period.
KLA Corp (KLAC)
Price and Fair Value of 1/1/19 - 31/12/19
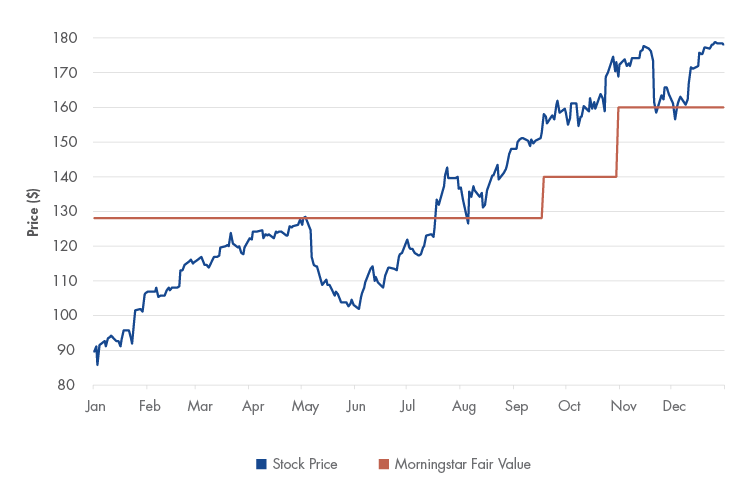
Source: Morningstar. Past performance is no guarantee of future results. For illustrative purposes only. Not a recommendation to buy or sell any security. Visit vaneck.com to view daily ETF and index holdings.
Another Semiconductor Moat Stock Chipping In
Another member of the semiconductor industry, Applied Materials, followed a similar near-term allocation pattern in the Moat Index. AMAT supplies semiconductor manufacturing equipment and benefits from intangible assets related to its equipment design expertise and R&D cost advantages, according to Morningstar. Major chipmakers typically develop strong relationships with their equipment company that span multiple steps of their chip production process. In short, AMAT’s materials engineering solutions are involved in making nearly every chip in the world.
As the semiconductor industry struggled through the second half of 2018, AMAT presented an attractive entry point relative to Morningstar’s fair value estimate. It was added to the Moat Index in September 2018 and December 2018 at steep discounts to fair value, particularly in December 2018 when AMAT was trading at less than 70% of Morningstar’s fair value estimate. The Moat Index pared back its AMAT weighting in September 2019, and the stock finished 2019 near fair value, according to Morningstar. Unlike KLAC, AMAT has been a frequent member of the Moat Index, making five separate appearances including one that lasted nearly four years.
Applied Materials Inc. (AMAT)
Price and Fair Value of 1/1/19 - 31/12/19
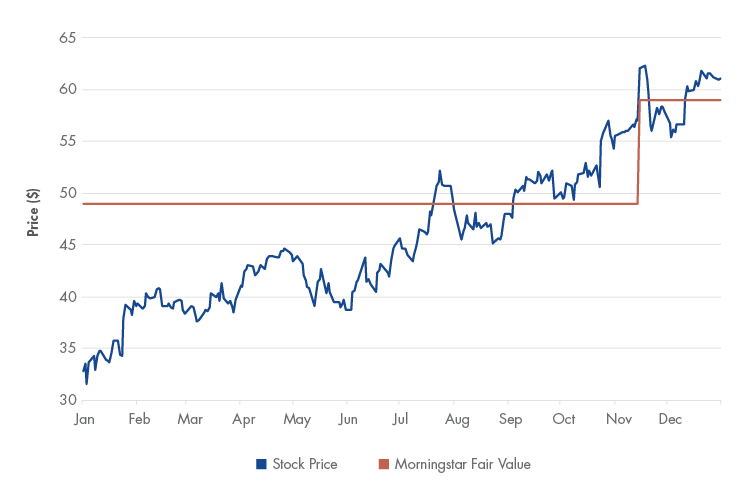
Source: Morningstar. Past performance is no guarantee of future results. For illustrative purposes only. Not a recommendation to buy or sell any security. Visit vaneck.com to view daily ETF and index holdings.
Do You Like This Moat Stock Now?
I’ve written about Facebook before and for good reason: it was the top contributing company to Moat Index returns for the decade. Morningstar assigned Facebook a wide economic moat rating out of the gate when it went public in May 2012 and cites its network effect around its massive user base and intangible assets related to user data.
While FB’s stock price has certainly trended up since its IPO, it hasn’t been without volatility. The key to the Moat Index’s allocations to FB has been its focus on valuations. Each instance of exposure to FB in the Moat Index began with attractive valuations and ultimately concluded with outperformance of the broad market.
| Date Included | Date Removed | Facebook Inc. Total Return (%) | S&P 500 Index Total Return (%) |
|---|---|---|---|
*Facebook was added to the U.S. Moat Index in September 2018 and its position was subsequently increased at the December 2018 review. It remains in the index and returns are for these positions are displayed though 30 April 2018. Source: Morningstar. Past performance is no guarantee of future results. For illustrative purposes only. Not a recommendation to buy or sell any security. Visit vaneck.com to view daily ETF and index holdings.
While not all companies contribute to Moat Index returns the way these three tech companies have in 2019, far more have contributed positively than have detracted from performance. Information technology was the top contributing sector to both Moat Index performance and that of the broad U.S. equity markets for the year. But other sectors also stood out in the Moat Index such as health care, consumer staples and financials. Even smaller sectors such as materials contributed meaningfully to its performance during the year, far more so than in the broad market.
Top and Bottom Contributors to 2019 Moat Index Return (%)
|
Top 10 |
Bottom 10 |
||||
|
Name |
Ticker |
Contribution |
Name |
Ticker |
Contribution |
|
KLA Corp |
KLAC |
2.16 |
Core Laboratories |
CLB |
-0.66 |
|
Applied Materials Inc |
AMAT |
1.72 |
Cheniere Energy Inc |
LNG |
-0.21 |
|
Facebook Inc |
FB |
1.28 |
Veeva Systems Inc |
VEEV |
-0.13 |
|
The Western Union Co |
WU |
1.27 |
Pfizer Inc |
PFE |
-0.07 |
|
Microchip Technology Inc |
MCHP |
1.17 |
Harley-Davidson Inc |
HOG |
0.09 |
|
Campbell Soup Co |
CPB |
1.17 |
Cerner Corp |
CERN |
0.12 |
|
Compass Minerals International |
CMP |
1.12 |
John Wiley & Sons Inc |
JWA |
0.13 |
|
General Mills Inc |
GIS |
1.12 |
Berkshire Hathaway Inc |
BRKB |
0.14 |
|
Zimmer Biomet Holdings Inc |
ZBH |
1.08 |
Merck & Co Inc |
MRK |
0.14 |
|
State Street Corporation |
STT |
1.00 |
General Dynamics Corp |
GD |
0.15 |
Source: Morningstar. Past performance is no guarantee of future results. For illustrative purposes only. Not a recommendation to buy or sell any security. Visit vaneck.com to view daily ETF and index holdings.
Important Disclosure
This is a marketing communication. Please refer to the prospectus of the UCITS and to the KID before making any final investment decisions.
This information originates from VanEck (Europe) GmbH, which has been appointed as distributor of VanEck products in Europe by the Management Company VanEck Asset Management B.V., incorporated under Dutch law and registered with the Dutch Authority for the Financial Markets (AFM). VanEck (Europe) GmbH with registered address at Kreuznacher Str. 30, 60486 Frankfurt, Germany, is a financial services provider regulated by the Federal Financial Supervisory Authority in Germany (BaFin).
The information is intended only to provide general and preliminary information to investors and shall not be construed as investment, legal or tax advice VanEck (Europe) GmbH, VanEck Switzerland AG, VanEck Securities UK Limited and their associated and affiliated companies (together “VanEck”) assume no liability with regards to any investment, divestment or retention decision taken by the investor on the basis of this information. The views and opinions expressed are those of the author(s) but not necessarily those of VanEck. Opinions are current as of the publication date and are subject to change with market conditions. Certain statements contained herein may constitute projections, forecasts and other forward-looking statements, which do not reflect actual results. Information provided by third party sources is believed to be reliable and have not been independently verified for accuracy or completeness and cannot be guaranteed. Brokerage or transaction fees may apply.
VanEck Asset Management B.V., the management company of VanEck Morningstar US Sustainable Wide Moat UCITS ETF (the "ETF"), a sub-fund of VanEck UCITS ETFs plc, is a UCITS management company under Dutch law registered with the Dutch Authority for the Financial Markets (AFM). The ETF is registered with the Central Bank of Ireland, passively managed and tracks an equity index. Investing in the ETF should be interpreted as acquiring shares of the ETF and not the underlying assets. Investors must read the sales prospectus and key investor information before investing in a fund. These are available in English and the KIIDs/KIDs in certain other languages as applicable and can be obtained free of charge at www.vaneck.com, from the Management Company or from the following local information agents:
UK - Facilities Agent: Computershare Investor Services PLC
Austria - Facility Agent: Erste Bank der oesterreichischen Sparkassen AG
Germany - Facility Agent: VanEck (Europe) GmbH
Spain - Facility Agent: VanEck (Europe) GmbH
Sweden - Paying Agent: Skandinaviska Enskilda Banken AB (publ)
France - Facility Agent: VanEck (Europe) GmbH
Portugal - Paying Agent: BEST – Banco Eletrónico de Serviço Total, S.A.
Luxembourg - Facility Agent: VanEck (Europe) GmbH
Morningstar® US Sustainability Moat Focus Index is a trade mark of Morningstar Inc. and has been licensed for use for certain purposes by VanEck. VanEck Morningstar US Sustainable Wide Moat UCITS ETF is not sponsored, endorsed, sold or promoted by Morningstar and Morningstar makes no representation regarding the advisability in VanEck Morningstar US Sustainable Wide Moat UCITS ETF.
Effective December 17, 2021 the Morningstar® Wide Moat Focus IndexTM has been replaced with the Morningstar® US Sustainability Moat Focus Index.
Effective June 20, 2016, Morningstar implemented several changes to the Morningstar Wide Moat Focus Index construction rules. Among other changes, the index increased its constituent count from 20 stocks to at least 40 stocks and modified its rebalance and reconstitution methodology. These changes may result in more diversified exposure, lower turnover and longer holding periods for index constituents than under the rules in effect prior to this date.
It is not possible to invest directly in an index.
All performance information is based on historical data and does not predict future returns. Investing is subject to risk, including the possible loss of principal.
No part of this material may be reproduced in any form, or referred to in any other publication, without express written permission of VanEck.
© VanEck (Europe) GmbH / VanEck Asset Management B.V.
Related Insights


Related Insights

11 March 2024


11 March 2024