A Great Rotation into Value?
November 20, 2020
Read Time 5 MIN
The VanEck Vectors® Real Asset Allocation ETF (RAAX®) uses a data-driven, rules-based process that leverages over 50 indicators (technical, macroeconomic and fundamental, commodity price, and sentiment) to allocate across 12 individual real asset segments in five broad real asset sectors. These objective indicators identify the segments with positive expected returns. Then, using correlation and volatility, an optimization process determines the weight to these segments with the goal of creating a portfolio with maximum diversification while reducing risk. The expanded PDF version of this commentary can be downloaded here.
Overview
The VanEck Vectors® Real Asset Allocation ETF (RAAX) returned -1.51% versus +1.41% for the Bloomberg Commodity Index, -0.84% for its custom blended benchmark and -2.31% for the S&P North America Natural Resources Index.
October was yet another weak month for real asset prices due to fears of a slowdown in global growth and general market turmoil leading into the U.S. elections. RAAX’s investments in diversified commodity futures, energy, coal and gold miners were amongst the largest detractors from performance. The top performing assets were clean energy and steel equities. Gold bullion prices were modestly negative during the period.
Joseph Biden is now expected to become the 46th President of the United States and will serve with a split congress. This news sent markets rallying because the cloud of uncertainty over the elections has been removed and the threat of the “Big Blue Wave” has been stopped. The base case scenario is now that there will be no substantial changes to either taxes or regulations–-a clear positive for the stock market.
| Average Annual Total Returns (%) as of October 31, 2020 | ||||
| 1 Mo† | YTD† | 1 Year | Life | |
| (04/09/18) | ||||
| RAAX (NAV) | -1.51 | -22.85 | -19.94 | -7.83 |
| RAAX (Share Price) | -1.69 | -22.94 | -19.96 | -7.88 |
| Bloomberg Commodity Index* | 1.41 | -10.85 | -8.75 | -6.13 |
| Blended Real Asset Index* | -0.84 | -14.72 | -11.39 | -3.47 |
| Average Annual Total Returns (%) as of September 30, 2020 | ||||
| 1 Mo† | YTD† | 1 Year | Life | |
| (04/09/18) | ||||
| RAAX (NAV) | -5.08 | -21.67 | -18.32 | -7.53 |
| RAAX (Share Price) | -5.00 | -21.62 | -18.36 | -7.51 |
| Bloomberg Commodity Index* | -3.35 | -12.08 | -8.20 | -6.85 |
| Blended Real Asset Index* | -3.57 | -14.00 | -9.28 | -3.26 |
The table presents past performance which is no guarantee of future results and which may be lower or higher than current performance. Returns reflect temporary contractual fee waivers and/or expense reimbursements. Had the ETF incurred all expenses and fees, investment returns would have been reduced. Investment returns and ETF share values will fluctuate so that investors’ shares, when redeemed, may be worth more or less than their original cost.
†Returns less than a year are not annualized.
Expenses: Gross 1.13%; Net 0.75%. Expenses are capped contractually at 0.55% through February 1, 2021. Expenses are based on estimated amounts for the current fiscal year. Cap exclude certain expenses, such as interest, acquired fund fees and expenses, and trading expenses.
Great news also came on the fight against COVID-19. Pfizer announced that its vaccine trail showed 90% effectiveness in blocking the transmission of COVID -19. A return to normalcy offers the opportunity to close the valuation gap between the growth oriented sectors, like technology, that have benefited, and cyclical industries, like energy and REITs, that have been hard hit. There are few industries that stand to benefit more than energy. On the day of the Pfizer announcement, many companies in the energy sector were up nearly 20%!
The chart below shows acceleration in the trend of growth stocks versus value stocks in 2020:
Energy May Benefit if Value Comes Back
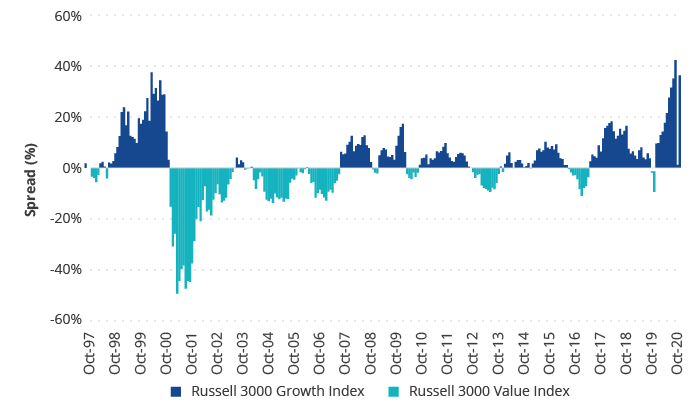
Source: Bloomberg. Data as of October 30, 2020. Charts are for illustrative purposes only. Past performance is not a guarantee of future results.
As you can see, the spread between the performance of growth and value stocks has reached extremes not seen since the Technology Bubble. When that bubble popped, the markets experienced a powerful and extended period of outperformance in the value sectors. Just to be clear, we are not claiming that the growth sectors are in a bubble nor are we suggesting that prices in growth-oriented stocks will fall substantially from here. What we are however pointing out is how lopsided the market returns have been and how, we believe, value-oriented stocks, like many of the real assets in RAAX, are well positioned to perform with an effective vaccine.
There were no changes this month to the allocations within RAAX. It is maintaining a diversified allocation to real assets, including a 34% allocation to natural resource equities (including a 5% allocation to renewable energy), a 27% allocation to gold, a 15% allocation to diversified commodity futures, a 14% allocation to global infrastructure, a 5% allocation to REITs, and a 5% allocation to MLPs.
A Deeper Dive
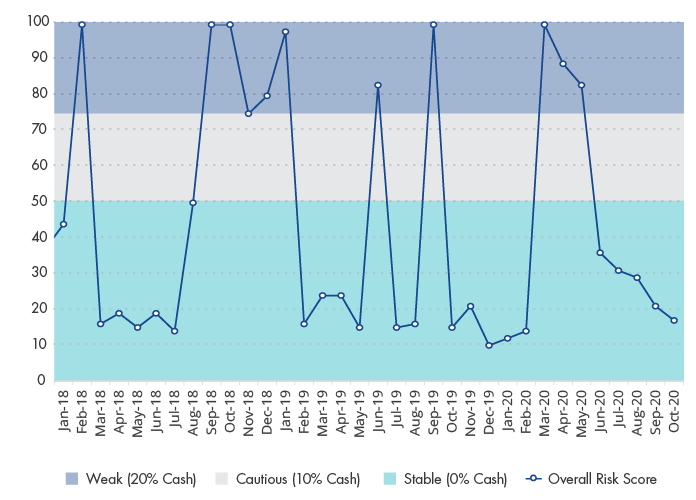
The chart below shows the overall real asset composite. A score of 0 represents the lowest risk level and a score of 100 represents the highest risk level. A score of 60 or higher will result in our most defensive posture. The current score is 17, which indicates a stable risk regime for real assets.
Overall Risk Score
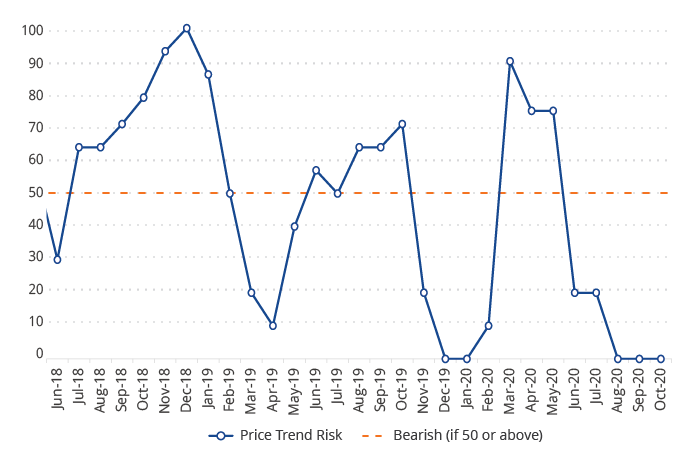
The risk score can be decomposed into key factors that drive real asset prices. These include price trends, economic activity, realized volatility and investor sentiment.
Price trends, in aggregate, are positive. The price trends that are currently negative are in the energy sector.
Price Trend Risk Score
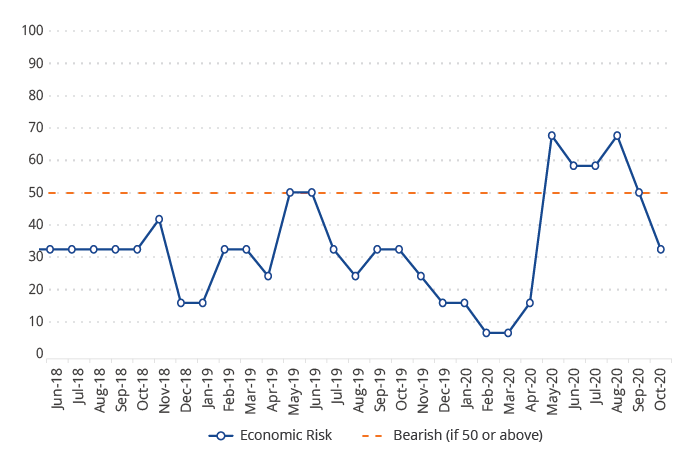
Economic risk has subsided due to the rebound in economic activity.
Economic Risk Score
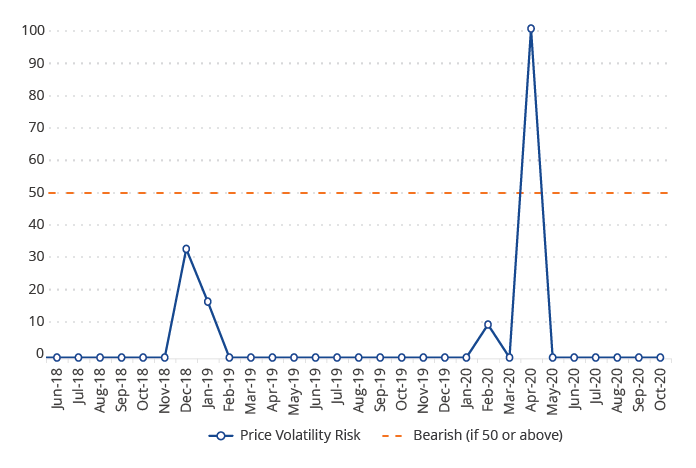
Price volatility is within normal ranges.
Price Volatility Risk Score
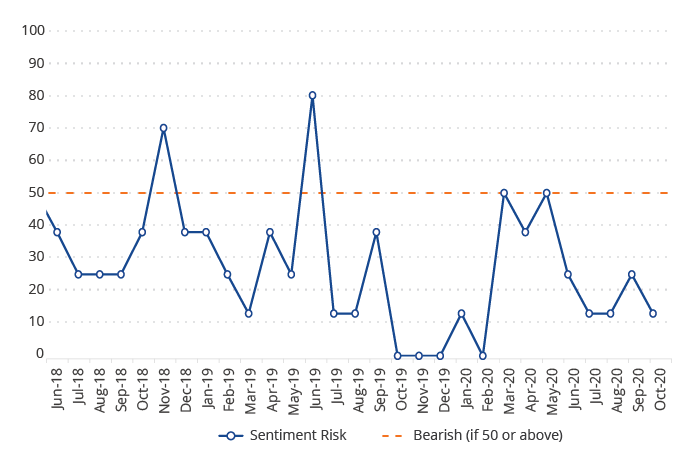
Investor sentiment is not at an extreme.
Investor Sentiment Risk Score
RAAX will remain diversified and fully invested across a set of unique real asset investments, while continuing to monitor the current environment. It will adjust its allocations, if needed, to balance the risk and rewards of the asset class.
Real Asset Sector Allocations Since Inception
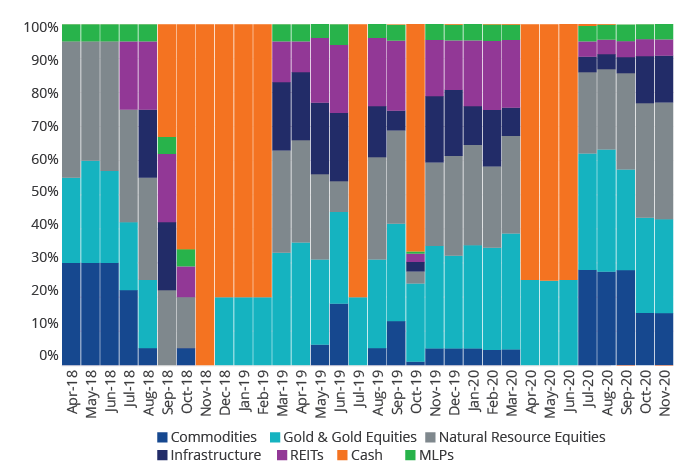
Real Asset Class Allocations
| Nov-20 | Oct-20 | Change from Previous Month |
||
| Oil Services Equities | 2.8% | 2.6% | 0.2% | Increase |
| Low Carbon Energy Equities | 5.2% | 5.0% | 0.2% | Increase |
| Steel Equities | 4.0% | 3.8% | 0.2% | Increase |
| Unconventional Oil & Gas Equities | 2.9% | 2.8% | 0.1% | Increase |
| Agribusiness Equities | 7.3% | 7.2% | 0.1% | Increase |
| Energy Equitiess | 4.8% | 4.7% | 0.1% | Increase |
| MLPs | 4.5% | 4.4% | 0.1% | Increase |
| Global Metals & Mining Equities | 3.6% | 3.6% | 0.0% | No Change |
| Cash | 0.0% | 0.0% | 0.0% | No Change |
| Diversified Commodities | 15.2% | 15.3% | -0.1% | Decrease |
| Global Infrastructure | 13.7% | 13.8% | -0.1% | Decrease |
| REITs | 4.8% | 4.9% | -0.1% | Decrease |
| Gold Equities | 5.1% | 5.3% | -0.2% | Decrease |
| Gold Bullion | 22.5% | 22.7% | -0.2% | Decrease |
| Coal Equities | 3.7% | 3.9% | -0.2% | Decrease |
Related Insights

Related Insights
February 28, 2024
February 22, 2024

December 19, 2023

DISCLOSURES
Please note that the information herein represents the opinion of the author, but not necessarily those of VanEck, and these opinions may change at any time and from time to time. Non-VanEck proprietary information contained herein has been obtained from sources believed to be reliable, but not guaranteed. Not intended to be a forecast of future events, a guarantee of future results or investment advice. Historical performance is not indicative of future results. Current data may differ from data quoted. Any graphs shown herein are for illustrative purposes only. No part of this material may be reproduced in any form, or referred to in any other publication, without express written permission of VanEck.
This content is published in the United States for residents of specified countries. Investors are subject to securities and tax regulations within their applicable jurisdictions that are not addressed on this content. Nothing in this content should be considered a solicitation to buy or an offer to sell shares of any investment in any jurisdiction where the offer or solicitation would be unlawful under the securities laws of such jurisdiction, nor is it intended as investment, tax, financial, or legal advice. Investors should seek such professional advice for their particular situation and jurisdiction.
The Blended Real Assets Index consists of an equally weighted blend of the returns of Bloomberg Commodity Index, S&P Real Assets Equity Index, and VanEck® Natural Resources Index. Equal weightings are reset monthly. The S&P Real Assets Equity Index measures the performance of equity real return strategies that invest in listed global property, infrastructure, natural resources, and timber and forestry companies. The VanEck Natural Resources Index is a rules-based index intended to give investors a means of tracking the overall performance of a global universe of listed companies engaged in the production and distribution of commodities and commodity-related products and services. Sector weights are set annually based on estimates of global natural resources consumption, and stock weights within sectors are based on market capitalization, float-adjusted and modified to conform to various asset diversification requirements. The Bloomberg Commodity Index is a broadly diversified index that tracks the commodity markets through commodity futures contracts and is made up of exchange-traded futures on physical commodities, which are weighted to account for economic significance and market liquidity. The S&P 500® Index (S&P 500) consists of 500 widely held common stocks, covering four broad sectors (industrials, utilities, financial and transportation).
The S&P Real Assets Equity Index is a product of S&P Dow Jones Indices LLC and/or its affiliates and has been licensed for use by Van Eck Associates Corporation. Copyright © 2020 S&P Dow Jones Indices LLC, a division of S&P Global, Inc., and/or its affiliates. All rights reserved. Redistribution or reproduction in whole or in part are prohibited without written permission of S&P Dow Jones Indices LLC. For more information on any of S&P Dow Jones Indices LLC’s indices please visit www.spdji.com. S&P® is a registered trademark of S&P Global and Dow Jones® is a registered trademark of Dow Jones Trademark Holdings LLC. Neither S&P Dow Jones Indices LLC, Dow Jones Trademark Holdings LLC, their affiliates nor their third party licensors make any representation or warranty, express or implied, as to the ability of any index to accurately represent the asset class or market sector that it purports to represent and neither S&P Dow Jones Indices LLC, Dow Jones Trademark Holdings LLC, their affiliates nor their third party licensors shall have any liability for any errors, omissions, or interruptions of any index or the data included therein.
The Solactive MLP & Energy Infrastructure Index tracks the performance of MLPs and energy infrastructure corporations. The MVIS US Listed Oil Services 25 Index is intended to track the overall performance of U.S.-listed companies involved in oil services to the upstream oil sector, which include oil equipment, oil services, or oil drilling. The Dow Jones Equity All REIT Index, designed to measure all publicly traded real estate investment trusts in the Dow Jones U.S. stock universe classified as equity REITs according to the S&P Dow Jones Indices REIT Industry Classification Hierarchy. The NYSE Arca Gold Miners Index is a modified market capitalization-weighted index composed of publicly traded companies involved primarily in the mining for gold. The Index is calculated and maintained by the New York Stock Exchange. The S&P® North American Natural Resources Sector Index: a modified capitalization-weighted index which includes companies involved in the following categories: extractive industries, energy companies, owners and operators of timber tracts, forestry services, producers of pulp and paper, and owners of plantations. The S&P® GSCI Total Return Index is a world production-weighted commodity index comprised of liquid, exchange-traded futures contracts and is often used as a benchmark for world commodity prices.
Any indices listed are unmanaged indices and include the reinvestment of all dividends, but do not reflect the payment of transaction costs, advisory fees or expenses that are associated with an investment in the Fund. Certain indices may take into account withholding taxes. An index’s performance is not illustrative of the Fund’s performance. Indices are not securities in which investments can be made.
An investment in the Fund may be subject to risks which include, among others, in fund of funds risk which may subject the Fund to investing in commodities, gold, natural resources companies, MLPs, real estate sector, infrastructure, equities securities, small- and medium-capitalization companies, foreign securities, emerging market issuers, foreign currency, credit, high yield securities, interest rate, call and concentration risks, all of which may adversely affect the Fund. The Fund may also be subject to affiliated fund, U.S. Treasury Bills, subsidiary investment, commodity regulatory (with respect to investments in the Subsidiary), tax (with respect to investments in the Subsidiary), liquidity, gap, cash transactions, high portfolio turnover, model and data, management, operational, authorized participant concentration, no guarantee of active trading market, trading issues, market, fund shares trading, premium/discount and liquidity of fund shares, non-diversified and risks of ETPs. Foreign investments are subject to risks, which include changes in economic and political conditions, foreign currency fluctuations, changes in foreign regulations, and changes in currency exchange rates which may negatively impact the Fund’s returns. Small- and medium-capitalization companies may be subject to elevated risks.
Diversification does not assure a profit or protect against a loss.
Investing involves substantial risk and high volatility, including possible loss of principal. Bonds and bond funds will decrease in value as interest rates rise. An investor should consider the investment objective, risks, charges and expenses of the Fund carefully before investing. To obtain a prospectus and summary prospectus, which contain this and other information, call 800.826.2333 or visit vaneck.com. Please read the prospectus and summary prospectus carefully before investing.
© VanEck.
Related Funds
DISCLOSURES
Please note that the information herein represents the opinion of the author, but not necessarily those of VanEck, and these opinions may change at any time and from time to time. Non-VanEck proprietary information contained herein has been obtained from sources believed to be reliable, but not guaranteed. Not intended to be a forecast of future events, a guarantee of future results or investment advice. Historical performance is not indicative of future results. Current data may differ from data quoted. Any graphs shown herein are for illustrative purposes only. No part of this material may be reproduced in any form, or referred to in any other publication, without express written permission of VanEck.
This content is published in the United States for residents of specified countries. Investors are subject to securities and tax regulations within their applicable jurisdictions that are not addressed on this content. Nothing in this content should be considered a solicitation to buy or an offer to sell shares of any investment in any jurisdiction where the offer or solicitation would be unlawful under the securities laws of such jurisdiction, nor is it intended as investment, tax, financial, or legal advice. Investors should seek such professional advice for their particular situation and jurisdiction.
The Blended Real Assets Index consists of an equally weighted blend of the returns of Bloomberg Commodity Index, S&P Real Assets Equity Index, and VanEck® Natural Resources Index. Equal weightings are reset monthly. The S&P Real Assets Equity Index measures the performance of equity real return strategies that invest in listed global property, infrastructure, natural resources, and timber and forestry companies. The VanEck Natural Resources Index is a rules-based index intended to give investors a means of tracking the overall performance of a global universe of listed companies engaged in the production and distribution of commodities and commodity-related products and services. Sector weights are set annually based on estimates of global natural resources consumption, and stock weights within sectors are based on market capitalization, float-adjusted and modified to conform to various asset diversification requirements. The Bloomberg Commodity Index is a broadly diversified index that tracks the commodity markets through commodity futures contracts and is made up of exchange-traded futures on physical commodities, which are weighted to account for economic significance and market liquidity. The S&P 500® Index (S&P 500) consists of 500 widely held common stocks, covering four broad sectors (industrials, utilities, financial and transportation).
The S&P Real Assets Equity Index is a product of S&P Dow Jones Indices LLC and/or its affiliates and has been licensed for use by Van Eck Associates Corporation. Copyright © 2020 S&P Dow Jones Indices LLC, a division of S&P Global, Inc., and/or its affiliates. All rights reserved. Redistribution or reproduction in whole or in part are prohibited without written permission of S&P Dow Jones Indices LLC. For more information on any of S&P Dow Jones Indices LLC’s indices please visit www.spdji.com. S&P® is a registered trademark of S&P Global and Dow Jones® is a registered trademark of Dow Jones Trademark Holdings LLC. Neither S&P Dow Jones Indices LLC, Dow Jones Trademark Holdings LLC, their affiliates nor their third party licensors make any representation or warranty, express or implied, as to the ability of any index to accurately represent the asset class or market sector that it purports to represent and neither S&P Dow Jones Indices LLC, Dow Jones Trademark Holdings LLC, their affiliates nor their third party licensors shall have any liability for any errors, omissions, or interruptions of any index or the data included therein.
The Solactive MLP & Energy Infrastructure Index tracks the performance of MLPs and energy infrastructure corporations. The MVIS US Listed Oil Services 25 Index is intended to track the overall performance of U.S.-listed companies involved in oil services to the upstream oil sector, which include oil equipment, oil services, or oil drilling. The Dow Jones Equity All REIT Index, designed to measure all publicly traded real estate investment trusts in the Dow Jones U.S. stock universe classified as equity REITs according to the S&P Dow Jones Indices REIT Industry Classification Hierarchy. The NYSE Arca Gold Miners Index is a modified market capitalization-weighted index composed of publicly traded companies involved primarily in the mining for gold. The Index is calculated and maintained by the New York Stock Exchange. The S&P® North American Natural Resources Sector Index: a modified capitalization-weighted index which includes companies involved in the following categories: extractive industries, energy companies, owners and operators of timber tracts, forestry services, producers of pulp and paper, and owners of plantations. The S&P® GSCI Total Return Index is a world production-weighted commodity index comprised of liquid, exchange-traded futures contracts and is often used as a benchmark for world commodity prices.
Any indices listed are unmanaged indices and include the reinvestment of all dividends, but do not reflect the payment of transaction costs, advisory fees or expenses that are associated with an investment in the Fund. Certain indices may take into account withholding taxes. An index’s performance is not illustrative of the Fund’s performance. Indices are not securities in which investments can be made.
An investment in the Fund may be subject to risks which include, among others, in fund of funds risk which may subject the Fund to investing in commodities, gold, natural resources companies, MLPs, real estate sector, infrastructure, equities securities, small- and medium-capitalization companies, foreign securities, emerging market issuers, foreign currency, credit, high yield securities, interest rate, call and concentration risks, all of which may adversely affect the Fund. The Fund may also be subject to affiliated fund, U.S. Treasury Bills, subsidiary investment, commodity regulatory (with respect to investments in the Subsidiary), tax (with respect to investments in the Subsidiary), liquidity, gap, cash transactions, high portfolio turnover, model and data, management, operational, authorized participant concentration, no guarantee of active trading market, trading issues, market, fund shares trading, premium/discount and liquidity of fund shares, non-diversified and risks of ETPs. Foreign investments are subject to risks, which include changes in economic and political conditions, foreign currency fluctuations, changes in foreign regulations, and changes in currency exchange rates which may negatively impact the Fund’s returns. Small- and medium-capitalization companies may be subject to elevated risks.
Diversification does not assure a profit or protect against a loss.
Investing involves substantial risk and high volatility, including possible loss of principal. Bonds and bond funds will decrease in value as interest rates rise. An investor should consider the investment objective, risks, charges and expenses of the Fund carefully before investing. To obtain a prospectus and summary prospectus, which contain this and other information, call 800.826.2333 or visit vaneck.com. Please read the prospectus and summary prospectus carefully before investing.
© VanEck.