Welcome to VanEck
Select Investor Type
01 December 2020
The VanEck Unconstrained Emerging Markets Bond UCITS Fund utilizes a flexible approach to emerging markets debt investing and invests in debt securities issued by governments, quasi-government entities or corporations in emerging markets countries. These securities may be denominated in any currency, including those of emerging markets. By investing in emerging markets debt securities, the Fund offers exposure to emerging markets fundamentals, generally characterized by lower debts and deficits, higher growth rates and independent central banks.
Our basic stance remains and the changes we made were largely telegraphed in previous monthlies—we’ve generally been more diversified and selective after the “buy of the century” view started to get fully priced in July. Since then, we’ve gradually reduced some of the high-flying winners, as discussed in our monthlies. These have generally been in USD. Replacing them are mostly EM local currency markets. Importantly, we’d note that not all local currency markets are the same and a number of EM local currency markets (such as China’s) are low volatility affairs. Anyway, given these developments in the portfolio, we thought we’d review “the case for EM local currency”.
What’s the case for EM local currency? EMFX has lagged and many currencies have good policy that can offer a combination of defensive and offensive (i.e., beta to growth) characteristics. We’ll go into that argument in detail, below. What we should add, though, is that the global context supports EM local currency bond markets in many ways. Global government bond markets are undergoing two serious challenges right now. First, many of them pay low yields or even a high probability of losses. Their safety value is arguably fully priced, if not subject to distortive “hothouse” effects. Second, the classic “60/40” stocks/bond portfolio is challenged by these low or negative yields on many developed markets (DM) bonds. We think EM bonds will be a growing answer to filling in whatever that, perhaps declining, “40” is.
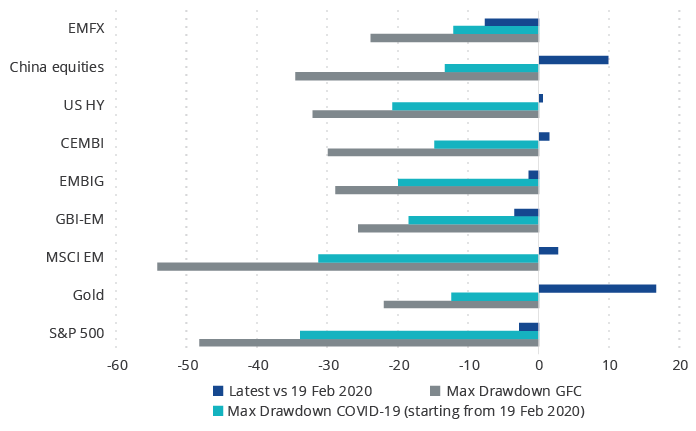
EMFX hasn’t even retraced half of its pre-COVID lows. Let’s discuss lagging and catching-up, first. Exhibit 1 below makes the point that most asset prices are largely back to their pre-COVID highs, with gold (wow!) and Chinese equities (even more impressive!) being well above pre-COVID highs. (VanEck happens to have leading funds in both gold and EM equities). Everything else—including all the EM debt categories such as the EMBIG and CEMBI—is back to pre-Covid levels. Except for EMFX, though—it’s only retraced under half of its pre-COVID lows.
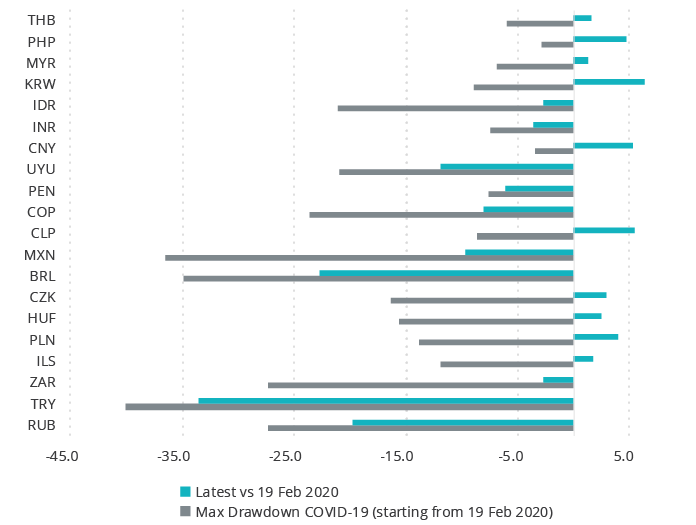
There are a number of individual EM foreign currencies that have lagged significantly, but which do not have an obvious fundamental that deteriorated enough to explain it: why is the Russian ruble down in line with the (so far) de-rating Turkish lira? Exhibit 2 goes through the major EMFX in detail. The ruble really stands out to us, given the country’s low debt, high reserves, plenty of fiscal and monetary space and improving economic structure. We don’t see a good reason for this lagged currency performance. Similarly for Peru, which has beta to global growth due to its mining sector, but also great defensive characteristics due to its strong balance sheet and good policy track record. Both of these examples pay high real interest rates relative to their fundamentals, consistent with the core of our investment process, of course.
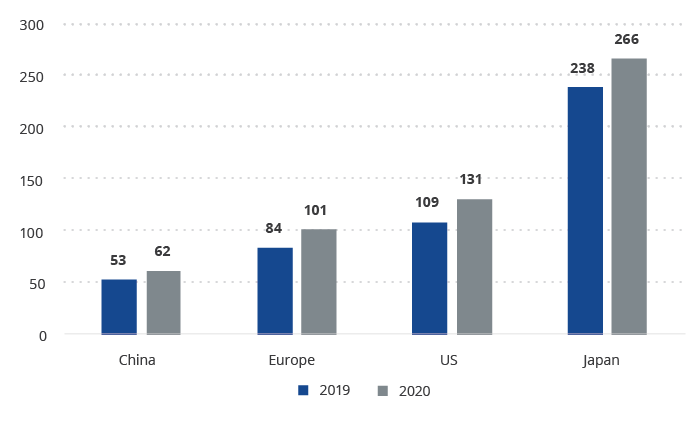
Another reason supportive of local currency is their policymakers’ generally orthodox stances—paying high real interest rates and maintaining fiscal space via limiting debt and deepening structural reform. China will be our poster child for this type of bond market. First, let’s look at Chinese government debt, relative to DM. Fine, a large portion of Chinese debt is on the part of corporates with varying degrees of implicit government support, but let’s put that aside given the tightness of the country’s financial controls. China has a lot of flexibility to stimulate, if growth is needed to drive asset prices, but also pays high real yields if growth doesn’t materialize quickly.
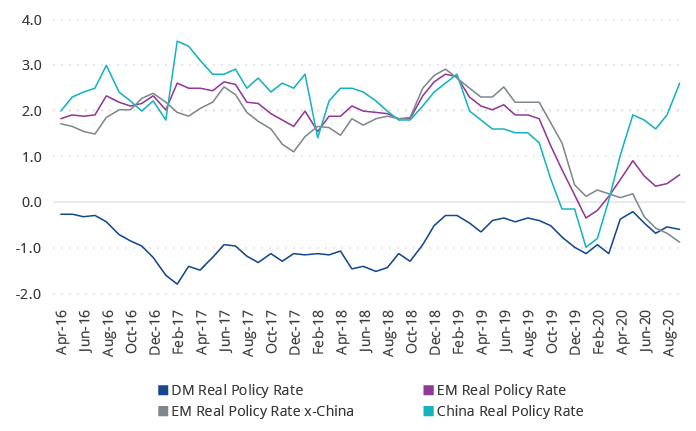
Another example of policy orthodoxy which rewards government bondholders also comes from China. The Exhibit below shows the higher real policy rates offered by Chinese bonds. This is a reflection of the Chinese authorities’ position of strength. They do not have to gin-up growth and markets without end and can afford to tighten policy when needed. This obviously optimizes long-term outcomes, because any adversity can be met by loosening. It’s a sign of strength to be tightening policy in the current nascent growth environment.
The changes to our top positions are summarized below. Our largest positions in October were: Mexico, China, South Africa, Thailand and Indonesia.
The VanEck Unconstrained Emerging Markets Bond UCITS Fund (USD I1 Inc) lost 0.01% in October compared to a gain of 0.20% for the 50/50 J.P. Morgan Government Bond Index-Emerging Markets Global Diversified (GBI-EM) local currency and the J.P. Morgan Emerging Markets Bond Index (EMBI) hard-currency index.
Turning to the market’s performance, GBI-EM’s biggest winners were Mexico, Indonesia, and South Africa. Its biggest losers were Turkey, Brazil and Poland. The EMBI’s biggest winners were South Africa, Egypt, and Ukraine. Its losers were Sri Lanka, Argentina and Costa Rica.
| 1 Mo | 3 Mo | YTD | 1 Year | 5 Year | Life | |
| USD I1 Inc (Inception 20/08/13) | -0.01 | 0.64 | 1.04 | 7.39 | 4.48 | 2.33 |
| 50 GBI-EM GD / 50% EMBI GD | 0.20 | -1.63 | -3.21 | -1.38 | 4.82 | 2.56 |
Life performance for the indices is presented in USD as of Class I1 inception date of 20/8/13. The Fund's benchmark index (50% GBI-EM/50% EMBI) is a blended index consisting of 50% J.P. Morgan Government Bond Index-Emerging Markets (GBI-EM) Global Diversified (GD) and 50% J.P. Morgan Emerging Markets Bond Index (EMBI) GD. The J.P. Morgan GBI-EM GD tracks local currency bonds issued by Emerging Markets governments. The index spans over 15 countries. The J.P. Morgan EMBI GD tracks returns for actively traded external debt instruments in emerging markets, and is also J.P. Morgan’s most liquid U.S-dollar emerging markets debt benchmark. Information has been obtained from sources believed to be reliable but J.P. Morgan does not warrant its completeness or accuracy. The indices are used with permission. The indices may not be copied, used or distributed without J.P. Morgan’s written approval. Copyright 2014, J.P. Morgan Chase & Co. All rights reserved.
Source of all Data: VanEck, Bloomberg.
This is a marketing communication. Please refer to the prospectus of the UCITS and to the KID before making any final investment decisions.
This information originates from VanEck Switzerland AG which has been appointed as distributor of VanEck products in Switzerland by the Management Company VanEck Asset Management B.V., incorporated under Dutch law and registered with the Dutch Authority for the Financial Markets (AFM). VanEck Switzerland AG’s registered address is at Genferstrasse 21, 8002 Zürich, Switzerland.
The information is intended only to provide general and preliminary information to investors and shall not be construed as investment, legal or tax advice. VanEck Switzerland AG and its associated and affiliated companies (together “VanEck”) assume no liability with regards to any investment, divestment or retention decision taken by the investor on the basis of this information. The views and opinions expressed are those of the author(s) but not necessarily those of VanEck. Opinions are current as of the publication date and are subject to change with market conditions. Certain statements contained herein may constitute projections, forecasts and other forward-looking statements, which do not reflect actual results. Information provided by third party sources is believed to be reliable and have not been independently verified for accuracy or completeness and cannot be guaranteed. Brokerage or transaction fees may apply. A copy of the latest prospectus, the Articles, the Key Information Document, the annual report and semi-annual report can be found on our website www.vaneck.com or can be obtained free of charge from the representative in Switzerland: First Independent Fund Services Ltd, Feldeggstrasse 12, 8008 Zurich, Switzerland. Swiss paying agent: Helvetische Bank AG, Seefeldstrasse 215, CH-8008 Zürich.
All performance information is based on historical data and does not predict future returns. Investing is subject to risk, including the possible loss of principal.
No part of this material may be reproduced in any form, or referred to in any other publication, without express written permission of VanEck.
© VanEck Switzerland AG

11 December 2025
11 December 2025