Welcome to VanEck
Select Investor Type
20 July 2026
Read Time 6 MIN
This article covers market developments through the end of June 2026. All performances are stated in USD. Returns may increase or decrease as a result of currency fluctuations.
Gold price volatility increased in the first half of 2026. Intraday, gold traded as high as $5,595 on January 29. On June 30, it traded at its year-to-date low of $3,943 but managed to close just above the $4,000 mark – ending the month at $4,008.02 per ounce. Gold declined 14.14% in the month of June and was down 7.21% year-to-date1. The gold stocks lagged the metal, as expected during a period of declining gold prices. The MarketVector™ Global Gold Miners Index (MVGDX)2 fell 15.54% in June, down 12.41% year to date. Investing is subject to risk, including the possible loss of principal.
After reaching new all-time highs of nearly $5,600 per ounce in early January, gold prices have come under pressure from a stronger U.S. dollar and expectations for higher interest rates since the beginning of the war with Iran. The dominant macro narrative has become self-reinforcing: higher oil prices keep inflation expectations elevated, elevated inflation expectations keep the Federal Reserve (“Fed”) on hold, a Fed on hold keeps real yields elevated, and elevated real yields support the U.S. dollar, weighing on gold.
As a result, many commodity analysts have reduced their gold price forecasts for 2026. However, even after those downward revisions, at present, the consensus mean estimate (as per Bloomberg data) for average annual gold prices stands at around $4,700 for 2026 and 2027, and above $4,000 for 2028 and 2029. Analysts at Goldman Sachs, Citigroup and Deutsche Bank forecast gold at or above $5,000 in 2027. (Source: Bloomberg. For illustrative purposes only. Not intended as a prediction of future results. Past performance is no guarantee of future results. Forecasts are not a reliable indicator of future performance.)
At the end of June, the apparent end of the conflict in the Middle East further eroded gold’s safe-haven appeal, as markets have shifted toward a risk-on environment and equity markets trade near recently established highs. Gold is now trading around $4,000 per ounce, representing an approximately 25% pullback from its January highs. However, gold stocks remain one of the best-performing asset classes over the past year, while gold continues to outperform most other major asset classes.
Source: Morningstar. Data as of June, 2026. “Gold Stocks” represented by MV Global Gold Miners Index (net of fees). “U.S. Stocks” represented by the S&P 500 Index. “EM Stocks” represented by MSCI Emerging Markets Index. “REITs” represented by FTSE NAREIT All Equity REITs Index. “International (Int’l) Stocks” represented by MSCI AC World ex USA Index. “Commodities” represented by Bloomberg Commodity Index. “U.S. TIPS” represented by Bloomberg U.S. TIPS (1-3 Year) Index. “U.S. Bonds” represented by Bloomberg U.S. Aggregate Bond Index. “International (Int’l) Bonds” represented by Bloomberg Global Aggregate ex US Index. Past performance is not indicative of future results. It is not possible to directly invest in an index. Investing involves risk, including possible loss of principal.
Gold price volatility and the recent pullback may be weighing on investors. However, in our view, it is important to look past near-term noise. The continued strength in equity markets suggests a degree of optimism that could be tested. Geopolitical tensions, the prolonged effects of the Middle East conflict, and the outlook for inflation remain key considerations in the current environment.
A prolonged “Fed on hold” environment could contribute to lower, or even negative, real rates over time, a backdrop that has historically been among the most favorable for gold. In that scenario, gold has often played a prominent role as a diversifier and potential hedge for investors seeking portfolio protection and diversification. Gold stocks may also play a role in a diversified allocation. There is no guarantee this backdrop will persist, however: real rates could rise, gold pays no income and can experience sharp or prolonged price declines, and it may not act as an effective hedge or diversifier in any given period.
Even Fed hikes have not always been negative for gold. According to World Gold Council data covering 44 Fed hikes from March 1997 through July 2023, gold positively surprised on hike days more than 50% of the time. This reflects historical outcomes over a specific period only; past performance is not a reliable indicator of future results, and gold may respond differently to future changes in interest rates.
Central bank gold statistics for May, also published by the World Gold Council, show that central banks remain committed to gold, with net monthly buying near record levels, and 89% of surveyed central bankers expecting global gold reserves to increase in the next 12 months.
Strong, regionally diversified central bank buying and resilient investment demand from Asia continue to underpin gold demand at current levels. A return of Western investor participation, similar to what happened in 2025, could provide additional support and may contribute to further upside in the gold market. Such demand dynamics are not guaranteed, however, and central bank buying and investment demand could slow or reverse. Gold has historically performed well during periods when central bank activity and investment together account for more than 30% of total demand (chart below – from WGC Gold Mid-Year Outlook 2026: Point break | World Gold Council).
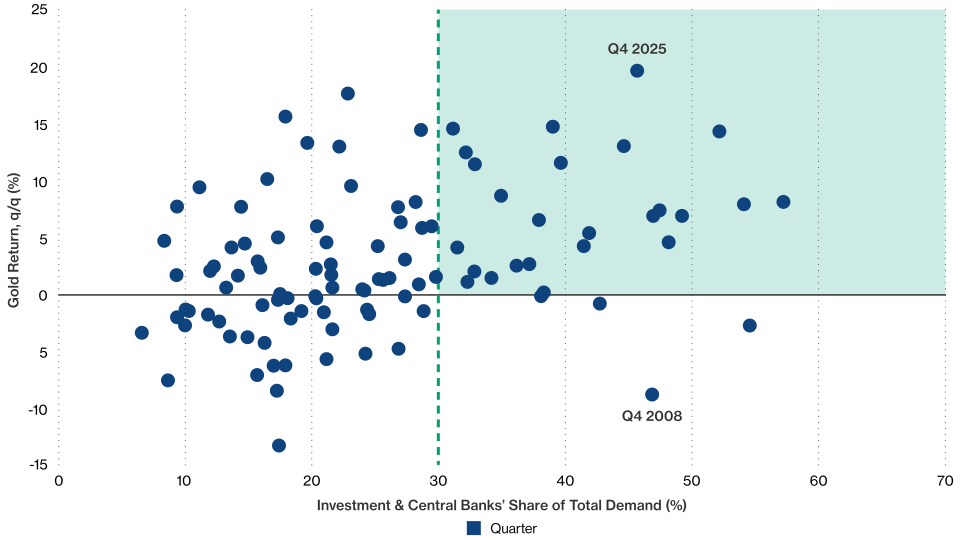
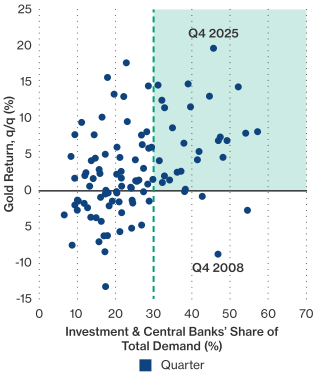
Source: World Gold Council, as of June 2026.
Gold stocks have historically outperformed the metal itself in rising gold price environments. Notably, the current gold price environment has already proven supportive of strong company fundamentals, with Q1 2026 earnings reflecting record cash flow. Gold has traded at an average price of approximately $4,700 per ounce so far in 2026. With all-in sustaining costs for the sector estimated to average below $2,000 per ounce in 2026, margins remain very strong even at $4,000 gold. This gives companies the ability to finance growth, pay dividends and repurchase shares. Gold stocks continue to trade at valuations that remain low relative to historical levels, while the sector appears to be in strong financial and operational health by historical standards. Current equity prices appear to reflect more conservative assumptions than those implied by prevailing gold prices. Gold equities also carry risks beyond those of the metal, including operational, cost, financing, jurisdictional and company-specific risks, and they have historically been more volatile than gold — as seen in the first half of 2026, gold stocks can decline more sharply than the metal when gold prices fall.
If investors rotate capital away from sectors with much richer valuations, particularly against a backdrop of rising pullback risk, gold stocks could be beneficiaries.
To receive more Gold Investing insights, sign up to our newsletter.
1 World Gold Council (30.06.2026)
2 MarketVector (30.06.2026)
Sources for data/information unless otherwise indicated: Bloomberg and company research, June 2026.
IMPORTANT INFORMATION
This is marketing communication.
This information originates from VanEck Switzerland AG, which has been appointed as distributor of VanEck products in Switzerland by the Management Company, VanEck Asset Management B.V. (“ManCo”), incorporated under Dutch law and registered with the Dutch Authority for the Financial Markets (AFM). VanEck Switzerland AG’s registered address is at Genferstrasse 21, 8002 Zürich, Switzerland. The representative in Switzerland is Zeidler Regulatory Services (Switzerland) AG, Stadthausstrasse 14, CH-8400 Winterthur, Switzerland. Swiss paying agent: Helvetische Bank AG, Seefeldstrasse 215, CH-8008 Zürich.
This material is only intended for general and preliminary information and does not constitute an investment, legal or tax advice. VanEck Switzerland AG and its associated and affiliated companies (together “VanEck”) assume no liability with regards to any investment, divestment or retention decision on the basis of this information. All relevant documentation must be first consulted.
The views and opinions expressed are those of the author(s) but not necessarily those of VanEck. Opinions are current as of the publication date and are subject to change with market conditions. Information provided by third party sources is believed to be reliable and has not been independently verified for accuracy or completeness and cannot be guaranteed.
The MarketVector™ Global Gold Miners Index is the exclusive property of MarketVector Indexes GmbH (a wholly owned subsidiary of Van Eck Associates Corporation), which has contracted with Solactive AG to maintain and calculate the Index. Solactive AG uses its best efforts to ensure that the Index is calculated correctly. Irrespective of its obligations towards MarketVector Indexes GmbH (“MarketVector”), Solactive AG has no obligation to point out errors in the Index to third parties. VanEck’s ETF is not sponsored, endorsed, sold or promoted by MarketVector and MarketVector makes no representation regarding the advisability of investing in the ETF. Effective September 19, 2025 the NYSE Arca Gold Miners Index has been replaced with the MarketVector™ Global Gold Miners Index. It is not possible to invest directly in an index.
The MSCI information may only be used for your internal use, may not be reproduced or redisseminated in any form and may not be used as a basis for or a component of any financial instruments or products or indices. None of the MSCI information is intended to constitute investment advice or a recommendation to make (or refrain from making) any kind of investment decision and may not be relied on as such. Historical data and analysis should not be taken as an indication or guarantee of any future performance analysis, forecast or prediction. The MSCI information is provided on an “as is” basis and the user of this information assumes the entire risk for any use made of this information. MSCI, each of its affiliates and each other person involved in or related to compiling, computing or creating any MSCI information (collectively, the “MSCI Parties”), expressly disclaims all warranties (including, without limitation, any warranties of originality, accuracy, completeness, timeliness, noninfringement, merchantability and fitness for a particular purpose) with respect to this information. Without limiting any of the foregoing, in no event shall any MSCI Party have any liability for any direct, indirect, special, incidental, punitive, consequential (including, without limitation, lost profits) or any other damages. It is not possible to invest directly in an index.
The S&P 500 Index (“Index”) is a product of S&P Dow Jones Indices LLC and/or its affiliates and has been licensed for use by Van Eck Associates Corporation. Copyright © 2020 S&P Dow Jones Indices LLC, a division of S&P Global, Inc., and/or its affiliates. All rights reserved. Redistribution or reproduction in whole or in part are prohibited without written permission of S&P Dow Jones Indices LLC. For more information on any of S&P Dow Jones Indices LLC’s indices please visit www.spdji.com. S&P® is a registered trademark of S&P Global and Dow Jones® is a registered trademark of Dow Jones Trademark Holdings LLC. Neither S&P Dow Jones Indices LLC, Dow Jones Trademark Holdings LLC, their affiliates nor their third party licensors make any representation or warranty, express or implied, as to the ability of any index to accurately represent the asset class or market sector that it purports to represent and neither S&P Dow Jones Indices LLC, Dow Jones Trademark Holdings LLC, their affiliates nor their third party licensors shall have any liability for any errors, omissions, or interruptions of any index or the data included therein. It is not possible to invest directly in an index.
Investing is subject to risk, including the possible loss of principal. For any unfamiliar technical terms, please refer to ETF Glossary | VanEck.
No part of this material may be reproduced in any form, or referred to in any other publication, without express written permission of VanEck.
© VanEck Switzerland AG
This is a marketing communication. Please refer to the prospectus of the UCITS and to the KID before making any final investment decisions.
This information originates from VanEck Switzerland AG which has been appointed as distributor of VanEck products in Switzerland by the Management Company VanEck Asset Management B.V., incorporated under Dutch law and registered with the Dutch Authority for the Financial Markets (AFM). VanEck Switzerland AG’s registered address is at Genferstrasse 21, 8002 Zürich, Switzerland.
The information is intended only to provide general and preliminary information to investors and shall not be construed as investment, legal or tax advice. VanEck Switzerland AG and its associated and affiliated companies (together “VanEck”) assume no liability with regards to any investment, divestment or retention decision taken by the investor on the basis of this information. The views and opinions expressed are those of the author(s) but not necessarily those of VanEck. Opinions are current as of the publication date and are subject to change with market conditions. Certain statements contained herein may constitute projections, forecasts and other forward-looking statements, which do not reflect actual results. Information provided by third party sources is believed to be reliable and have not been independently verified for accuracy or completeness and cannot be guaranteed. Brokerage or transaction fees may apply. A copy of the latest prospectus, the Articles, the Key Information Document, the annual report and semi-annual report can be found on our website www.vaneck.com or can be obtained free of charge from the representative in Switzerland: First Independent Fund Services Ltd, Feldeggstrasse 12, 8008 Zurich, Switzerland. Swiss paying agent: Helvetische Bank AG, Seefeldstrasse 215, CH-8008 Zürich.
All performance information is based on historical data and does not predict future returns. Investing is subject to risk, including the possible loss of principal.
No part of this material may be reproduced in any form, or referred to in any other publication, without express written permission of VanEck.
© VanEck Switzerland AG