China Recovery – Seeing Is Believing
01 March 2023
Read Time 2 MIN
China Reopening
China’s faster recovery thesis got some major support from February’s activity gauges. All PMIs (Purchasing Managers Indices) improved significantly last month, with the vast majority in the expansion zone now – not only services and manufacturing, but also the new export orders and small companies PMIs (see chart below). Importantly, the construction PMI shot above 60.0, pointing to the ongoing infrastructure push but also a signal that the housing sector might be getting more “alive.” China’s equities and FX – as well as many risky assets - had a very good day today. China’s credit aggregates would be the next important dataset to watch – especially proxies for mortgage lending, which are vital for consumer confidence and the consumption-led recovery (in addition to the stronger employment PMI).
EM Growth Outlook
China’s new export orders gains (up from 46.1 to 52.4) sent a positive signal regarding the state of global demand, albeit the growth “landscape” looks more mixed on a country level. Emerging markets (EM) Asia mostly stayed in the expansion zone (including Thailand’s “upgrade”), but Central Europe continued to struggle deep in the contraction zone. We were also concerned by a sharp deterioration in two major African economies – South Africa and Nigeria – where February’s PMIs unexpectedly plunged below 50.0. LATAM’s high-frequency growth indicators have shown more signs of life lately – including today’s economic activity proxy in Chile and Brazil’s PMI – but this is an uphill struggle as high real interest rates – and political noise - continue to bite.
DM Rates And Inflation
Even though a recession is no longer the base-case scenario for most developed markets (DMs) this year, the “bumpy” activity dataflow in the U.S. – including February’s surprisingly weak consumer confidence index - raised questions about further growth upgrades. Today’s mixed ISM survey showed that these concerns might be justified. There were improvements, but one of the strongest upside surprises came in the “prices paid” category. And this helps to explain why the market continues to price in the higher peak rate in the U.S. and a 74% probability of a rate hike in June. Will China’s V-shaped comeback prove a more important global driver for EMs than higher for longer U.S. rates? We this that this is indeed the case for some EMs, especially in EM Asia. Stay tuned!
Chart at a Glance: China Recovery – V-Shape After All?
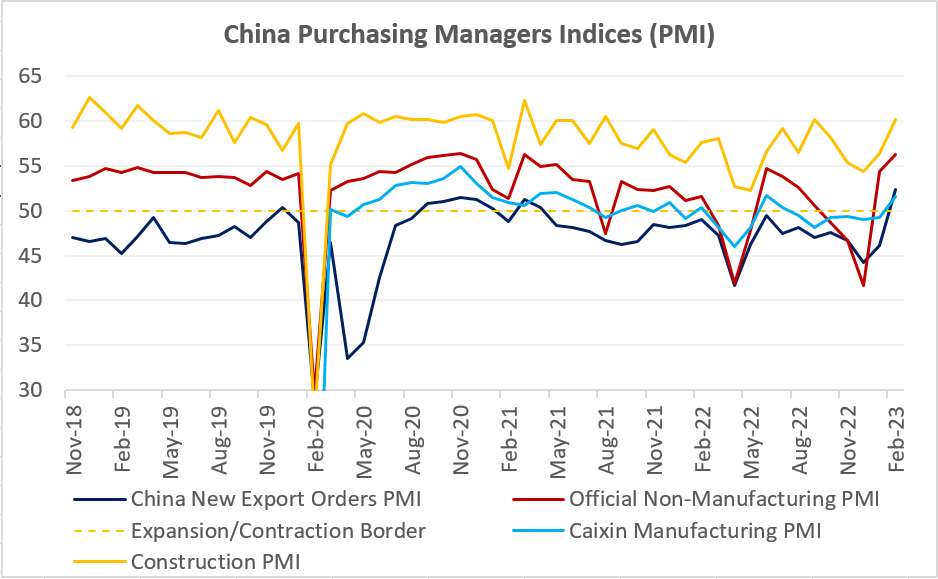
Source: Bloomberg LP.
Related Insights
Related Insights
07 April 2025
06 March 2025
20 February 2025
10 February 2026
Debasement is back in focus. Here’s what’s driving it, what could reverse it and how we’re positioning portfolios for both scenarios.
07 April 2025
Trump’s tariffs spark trade war fears, fueling market volatility, inflation risk, and recession threats. With global retaliation likely, near-term growth is clearly at risk.
06 March 2025
Trump’s tariffs, AI’s next phase, and a potential U.S. gold revaluation could shake markets—investors who stay ahead of these transitions will be best positioned.
20 February 2025
China's AI breakthrough, persistent inflation, gold’s outperformance, and rising energy demand underscore a shifting investment landscape.
16 January 2025
In 2025, navigating turbulence means balancing tech innovation, inflation hedges, energy shifts, and risks from spending cuts and inflation.