Spreads Boost EM High Yield Bonds Opportunity
01 September 2020
Like most credit oriented sectors, emerging markets high yield corporate bonds have rallied strongly over the past few months, after initially lagging U.S. high yield peers.1 With yields still over 7%, many income-seeking investors have taken notice, and we believe that an attractive opportunity remains in this asset class.
Compared with most other emerging markets debt sectors, high yield corporates have held up remarkably well. Although returns are still slightly negative year to date (-1% as of July 31,2020), this represents significant outperformance versus high yield emerging markets sovereigns, which are down nearly 7% due to severe distress that several lower rated and financially weak countries have experienced following the onset of the pandemic.2 The default rate among emerging markets high yield sovereigns has already exceeded 16% year to date, compared with only about 2% among high yield emerging markets corporates, according to J.P. Morgan (as of June 9, 2020).
This relatively low default rate also compares favorably with U.S. high yield bonds, which have a default rate that is nearly twice as high. Despite the significant rally in spreads, emerging markets high yield remains attractive from a historical perspective. As of July 31, 2020, the asset class provided a spread pickup of nearly 200 basis points relative to U.S. high yield, nearly 60 basis points above the 10-year average.3 That spread is compensation for the perceived added risk of investing in emerging markets, and exists despite the fact that emerging markets high yield corporates have a higher BB allocation and lower CCC and below allocation than U.S. high yield.
Spread Pickup Above Historical Average
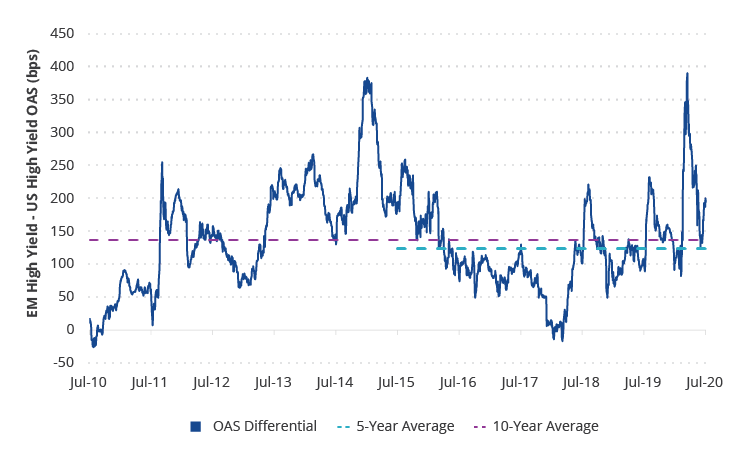
Source: ICE Data Indices. Data as of 7/31/2020. Emerging markets high yield corporate bonds represented by ICE BofA Diversified High Yield US Emerging Markets Corporate Plus Index. U.S. high yield corporate bonds represented by ICE BofA US High Yield Index.
In addition to the higher quality tilt, we believe there are several differences that may make emerging markets high yield an attractive part of a global high yield bond portfolio. To the extent the impressive recovery in China continues, we believe China issuers will likely remain among the largest contributors to performance in the index.4
The greater presence of quasi-sovereigns may also provide relative stability. For example, although exposure to energy issuers is approximately equal to the broad U.S. high yield market, emerging markets issuers within this sector have significantly outperformed.5 An increase in fallen angels, whether driven by weaker standalone fundamentals or sovereign downgrades, may also benefit returns for emerging markets corporates going forward. Including Pemex, there have been more than $80B of emerging markets fallen angels by market value in 2020, and we believe there is high potential for further downgrades over the next 12 months. Much as with developed market credit, fallen angels have been historically a source of excess return within the emerging markets high yield universe.
Several risks remain, including the ongoing tensions between the U.S. and China, the risks of a second wave and the impact of receding fiscal and monetary stimulus down the road. However, with the current spread pickup and potential catalysts for additional momentum, we believe emerging markets high yield corporates present an attractive opportunity.
For further reading:
- New Fallen Angel Bonds Drive Performance
- Fed Stimulus Clears Path for Gold Run
- China’s Economic Growth
1 Emerging markets high yield corporate bonds represented by ICE BofA Diversified High Yield US Emerging Markets Corporate Plus Index. U.S. high yield corporate bonds represented by ICE BofA US High Yield Index.
2 Source: ICE Data Indices.
3 Source: ICE Data Indices.
4 ICE BofA Diversified High Yield US Emerging Markets Corporate Plus Index
5 Source: FactSet. Data as of 7/31/2020.
Related Insights
Related Insights

11 February 2026
05 December 2025
28 April 2026
The Emerging Markets Debt team just returned from Spring 2026 IMF meetings in Washington, meeting with finance, banking, and political authorities from around the world.
18 December 2025
Get your portfolio ready for 2026 with detailed insights from VanEck’s investment team about the factors driving risk and returns in their respective asset classes.
05 December 2025
EM local-currency bonds offer high real yields, strong 2025 returns, and resilience to shocks, driven by credible policy and solid fundamentals.
04 December 2025
EM high yield has extended its 2025 momentum, delivering strong carry and compelling yields. With higher credit quality and lower defaults, the segment offers a more attractive risk profile than US high yield.
28 October 2025
The EM Debt team just returned from the Fall IMF Annual Meeting, here are their takeaways.