Focusing on Valuations in a Distorted Market
08 September 2020
Read Time 4 MIN
Less than half of S&P 500 Index constituents have posted a positive total return thus far in 2020, yet the blue chip index sits comfortably in the black with a return of 9.74% through August. Navigating a market driven by so few companies can be challenging as the so-called rich companies seem to be getting richer. A focus on valuations has long been the cornerstone of Morningstar’s moat investment philosophy, and valuations certainly seem stretched amidst the multiple global uncertainties that remain (see: global pandemic and U.S. elections).
The Morningstar® Wide Moat Focus IndexSM (the “Index”) finished August trailing the S&P 500 Index by 6% thus far in 2020 on a total return basis (3.70% vs. 9.74%, respectively). This underperformance has been largely driven by the Index’s recent positioning, which shifted following its June index review.
In June, the Index moved further away from big tech as valuations appeared stretched relative to other opportunities within Morningstar’s U.S. wide moat universe. This shift away from growth-oriented stocks has certainly contributed to the Index’s near term underperformance. Relative to the S&P 500, the Index’s underweight to big tech – namely Apple (AAPL), which features a narrow moat rating from Morningstar – has impacted returns. But other allocations within the tech sector have also affected relative returns, such as an overweight to chip companies Intel (INTC) and Microchip Technologies (MCHP) as well as insurance software company Guidewire Software (GWRE).
Stock selection in other sectors has also muted recent returns. John Wiley & Sons (JW/A), a leading academic publisher, has struggled through the global pandemic, but long-term prospects remain high according to Morningstar, who pegs the company’s stock price at a 25% discount to fair value. The high end jeweler, Tiffany & Co. (TIF), has also struggled as consumer demand dropped in the first and second quarter of the year, dampening Index returns. Its sales have bounced back slightly, and its pending acquisition by LVMH is still on track, albeit delayed. TIF remains nearly 10% undervalued, according to Morningstar. General Dynamics (GD), another leading detractor in recent months, currently sits at nearly 20% undervalued despite the defense and aerospace contractor’s rare ability to produce highly specialized products for the industry. As a long-term strategy, the Index isn’t intended to outperform over short periods of time and underperformance can and will occur. Time will tell if these attractive valuations will translate into share price appreciation.
In the near term, many investors have expressed more concern over whether certain segments of the market are far too overvalued.
Tech Sector Leads 2020 Market Returns
Much has been written on market dynamics in recent years: growth over value and the dominance of big tech and FAANG stocks are among other trends that have been highly documented. In 2020, only consumer discretionary stocks have posted returns anywhere near the tech sector through the turmoil of March and April and subsequent rebound through August.
Few Sectors Have Driven 2020 S&P 500 Index Returns (%)
As of 8/31/2020
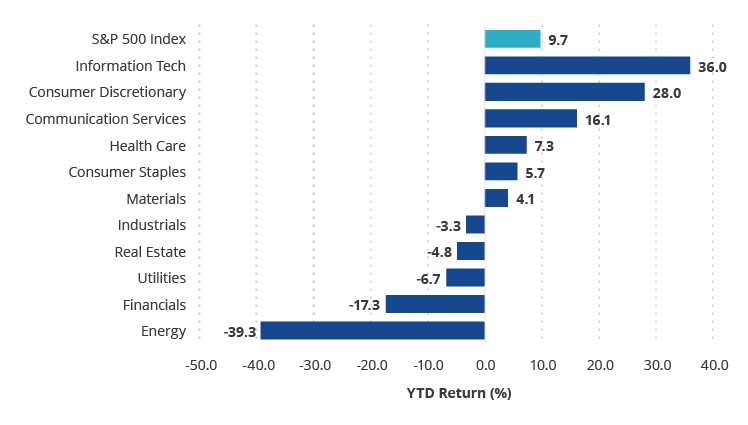
Source: Morningstar. Sector returns are represented by sector sub-indices of the S&P 500 Index. Past performance is no guarantee of future results.
With many of the largest constituents in many major market capitalization-weighted indices coming from the tech sector, there is no surprise that the sector’s influence on many investment portfolios has been profound. Tech companies currently represent approximately 28% of the S&P 500 Index weighting with health care (14%) and consumer discretionary (11%) a distant second and third place. Communications services companies, which include the likes of Facebook (FB), Google/Alphabet (GOOGL) and Netflix (NFLX) are also prominent members of the S&P 500 Index at an 11% weighting as of August 31, 2020.
One admittedly rudimentary, yet informative way of looking at 2020 U.S. market returns is to compare the market capitalization-weighted S&P 500 Index to the equal-weighted version of the S&P 500. In the equal-weighted version, the impact of big tech and other high fliers are muted, leading to negative year-to-date total return through August, a spread of over 12%.
Equal Prominence Has Resulted in Negative Returns (%)
As of 8/31/2020
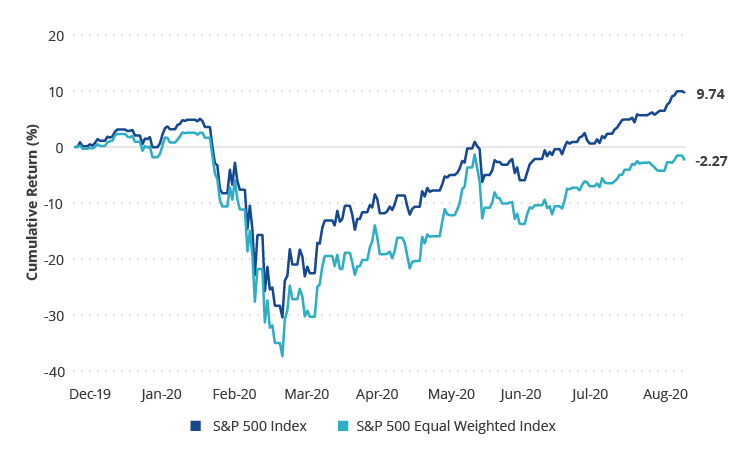
Source: Morningstar. Past performance is no guarantee of future results.
Focusing on Valuations: Are Certain Sectors Overvalued?
Market valuations have taken off in recent months. U.S. large cap stocks led by big tech have seen their shares exceed Morningstar’s estimate of fair value to, in some cases, staggering levels.
Moat Investment Philosophy Avoids Exposure to Excessive Valuations
Index Price/Fair Value Ratios
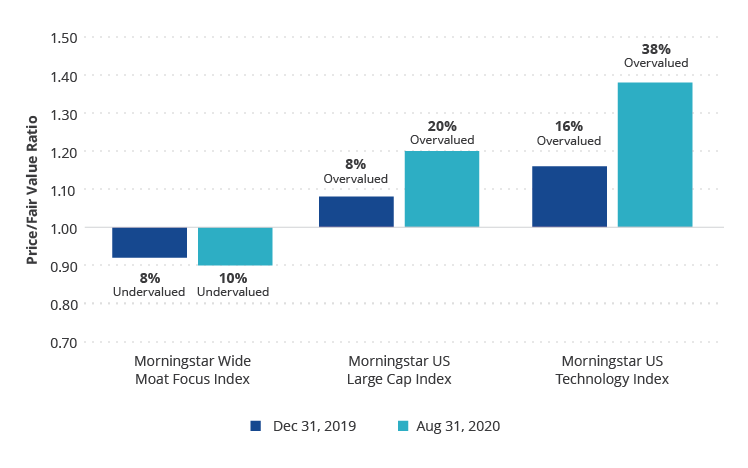
Source: Morningstar. Past performance is no guarantee of future results.
The Morningstar Wide Moat Focus Index does as its name implies: it focuses on valuation opportunities each quarter to maintain exposure to those stocks with wide economic moats and attractive entry points. Whether big tech and other growth stocks continue to provide investors compelling appreciation and also remain drivers of market returns remains to be seen. The Index’s long-term track record supports the case for a wait and see approach as the strategy navigates unprecedented macro market influences.
VanEck Vectors Morningstar Wide ETF (MOAT) seeks to replicate as closely as possible, before fees and expenses the price and yield performance of the Morningstar Wide Moat Focus Index.
For further reading:
- Moat Index Shifts Away from Big Tech
- Fed Stimulus Clears Path for Gold Run
- 5 Ways to Get Investment Ready
Related Insights

Related Insights

09 July 2026
As mega-cap tech pulled back in June, the Moat Index gained on semiconductor and cybersecurity strength and the SMID Moat Index rose on AI chips and a notable health care deal.
09 June 2026
Software and cybersecurity earnings showed that AI is broadening demand for enterprise tech, not eroding it, as Moat Indexes rebounded late in the month.
08 May 2026
Tech and semiconductor stocks led April’s rebound. Moat stocks participated in the rally though narrow leadership favoring mega-cap growth weighed on relative performance.
10 April 2026
U.S. equities fell in March as oil surged on geopolitical tensions. The Moat Index lagged on no energy exposure, while the SMID Moat Index held up with help from energy and materials.
30 March 2026
The Moat Index added NVIDIA, Broadcom and new names following its quarterly review, as tech dislocations created opportunity, while maintaining a value tilt and notable discount to fair value.