The Moat Stocks that Powered 2019 Outperformance
07 January 2020
Read Time 5 MIN
2019 was an impressive capstone to an equally impressive decade for the Morningstar® Wide Moat Focus IndexSM (“Moat Index”). Superior stock selection was the theme of the year, with KLA Corp. (KLAC), Applied Materials Inc. (AMAT) and Facebook (FB) being the top contributors to Moat Index performance. Each company benefits from sustainable competitive advantages according to Morningstar equity analysts, and the Moat Index allocated to these companies at attractive entry points based on their market price relative to Morningstar’s assessment of fair value. The Moat Index finished the year ahead of the S&P 500 Index by more than four percent (35.65% vs. 31.49%, respectively) and led in all standard trailing periods for the decade.
Decade of Outperformance
Trailing Return (%) as of 12/31/2019
All Systems Are Go for This Semiconductor Moat Stock
KLA Corp. may not be a household name, but it is a powerhouse in the semiconductor industry. According to Morningstar, its portfolio process, diagnostics and control tools combined with its leading technical expertise allow KLAC products to be in every major chip manufacturing facility in the world.
2010 was the last time KLAC was present in the Moat Index. At the time it traded at a steep discount to Morningstar’s fair value estimate but has since traded mostly at or above fair value until a buying opportunity presented itself. KLAC was first added to the Moat Index in September 2018 and its weighting was subsequently increased in December 2018. The discount to fair value has since eroded, and KLAC ended the year trading above Morningstar’s fair value estimate.
KLAC’s position was scaled back in September 2019 allowing the Moat Index to lock in much of the gains during that period.
KLA Corp (KLAC)
Price and Fair Value of 1/1/19 - 12/31/19
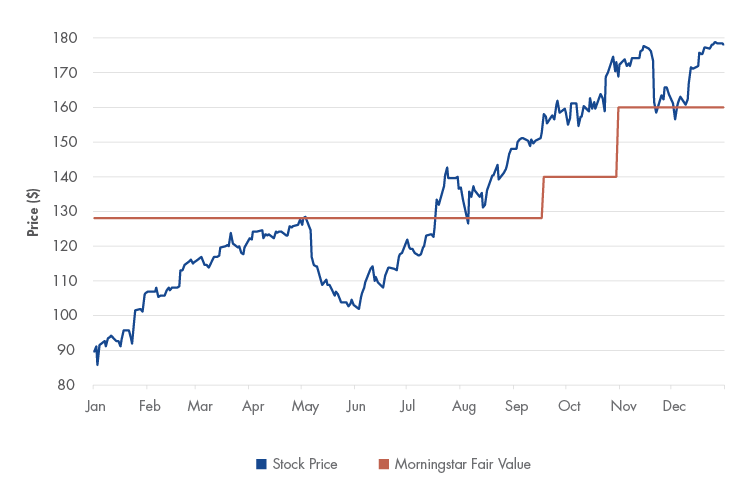
Source: Morningstar. Past performance is no guarantee of future results. For illustrative purposes only. Not a recommendation to buy or sell any security. Visit vaneck.com to view daily ETF and index holdings.
Another Semiconductor Moat Stock Chipping In
Another member of the semiconductor industry, Applied Materials, followed a similar near-term allocation pattern in the Moat Index. AMAT supplies semiconductor manufacturing equipment and benefits from intangible assets related to its equipment design expertise and R&D cost advantages, according to Morningstar. Major chipmakers typically develop strong relationships with their equipment company that span multiple steps of their chip production process. In short, AMAT’s materials engineering solutions are involved in making nearly every chip in the world.
As the semiconductor industry struggled through the second half of 2018, AMAT presented an attractive entry point relative to Morningstar’s fair value estimate. It was added to the Moat Index in September 2018 and December 2018 at steep discounts to fair value, particularly in December 2018 when AMAT was trading at less than 70% of Morningstar’s fair value estimate. The Moat Index pared back its AMAT weighting in September 2019, and the stock finished 2019 near fair value, according to Morningstar. Unlike KLAC, AMAT has been a frequent member of the Moat Index, making five separate appearances including one that lasted nearly four years.
Applied Materials Inc. (AMAT)
Price and Fair Value of 1/1/19 - 12/31/19
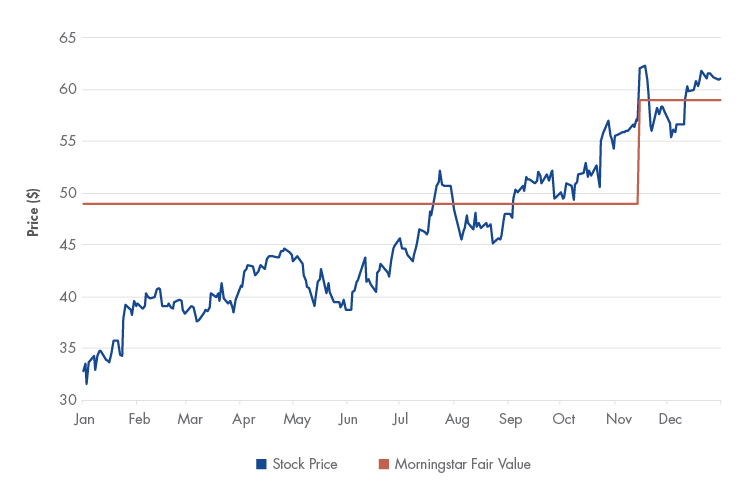
Source: Morningstar. Past performance is no guarantee of future results. For illustrative purposes only. Not a recommendation to buy or sell any security. Visit vaneck.com to view daily ETF and index holdings.
Do You Like This Moat Stock Now?
I’ve written about Facebook before and for good reason: it was the top contributing company to Moat Index returns for the decade. Morningstar assigned Facebook a wide economic moat rating out of the gate when it went public in May 2012 and cites its network effect around its massive user base and intangible assets related to user data.
While FB’s stock price has certainly trended up since its IPO, it hasn’t been without volatility. The key to the Moat Index’s allocations to FB has been its focus on valuations. Each instance of exposure to FB in the Moat Index began with attractive valuations and ultimately concluded with outperformance of the broad market.
*Facebook was added to the U.S. Moat Index in September 2018 and its position was subsequently increased at the December 2018 review. It remains in the index and returns are for these positions are displayed though December, 31, 2019. Source: Morningstar. Past performance is no guarantee of future results. For illustrative purposes only. Not a recommendation to buy or sell any security. Visit vaneck.com to view daily ETF and index holdings.
While not all companies contribute to Moat Index returns the way these three tech companies have in 2019, far more have contributed positively than have detracted from performance. Information technology was the top contributing sector to both Moat Index performance and that of the broad U.S. equity markets for the year. But other sectors also stood out in the Moat Index such as health care, consumer staples and financials. Even smaller sectors such as materials contributed meaningfully to its performance during the year, far more so than in the broad market.
Top and Bottom Contributors to 2019 Moat Index Return (%)
|
Top 10 |
Bottom 10 |
||||
|
Name |
Ticker |
Contribution |
Name |
Ticker |
Contribution |
|
KLA Corp |
KLAC |
2.16 |
Core Laboratories |
CLB |
-0.66 |
|
Applied Materials Inc |
AMAT |
1.72 |
Cheniere Energy Inc |
LNG |
-0.21 |
|
Facebook Inc |
FB |
1.28 |
Veeva Systems Inc |
VEEV |
-0.13 |
|
The Western Union Co |
WU |
1.27 |
Pfizer Inc |
PFE |
-0.07 |
|
Microchip Technology Inc |
MCHP |
1.17 |
Harley-Davidson Inc |
HOG |
0.09 |
|
Campbell Soup Co |
CPB |
1.17 |
Cerner Corp |
CERN |
0.12 |
|
Compass Minerals International |
CMP |
1.12 |
John Wiley & Sons Inc |
JWA |
0.13 |
|
General Mills Inc |
GIS |
1.12 |
Berkshire Hathaway Inc |
BRKB |
0.14 |
|
Zimmer Biomet Holdings Inc |
ZBH |
1.08 |
Merck & Co Inc |
MRK |
0.14 |
|
State Street Corporation |
STT |
1.00 |
General Dynamics Corp |
GD |
0.15 |
Source: Morningstar. Past performance is no guarantee of future results. For illustrative purposes only. Not a recommendation to buy or sell any security. Visit vaneck.com to view daily ETF and index holdings.
Related Insights

Related Insights
09 June 2026
Software and cybersecurity earnings showed that AI is broadening demand for enterprise tech, not eroding it, as Moat Indexes rebounded late in the month.
08 May 2026
Tech and semiconductor stocks led April’s rebound. Moat stocks participated in the rally though narrow leadership favoring mega-cap growth weighed on relative performance.
10 April 2026
U.S. equities fell in March as oil surged on geopolitical tensions. The Moat Index lagged on no energy exposure, while the SMID Moat Index held up with help from energy and materials.
30 March 2026
The Moat Index added NVIDIA, Broadcom and new names following its quarterly review, as tech dislocations created opportunity, while maintaining a value tilt and notable discount to fair value.
11 March 2026
Valuation discipline and sector allocation tilted exposure towards consumer staples, industrials and health care, supporting gains as software lagged.