Welcome to VanEck
Select Investor Type
13 January 2022
Bitcoin's share of the total crypto market fell below 40% in January for the first time since 2018.1 Three years ago, Bitcoin's underperformance heralded a year-long crypto bear market as the ICO (initial coin offering) boom succumbed to a regulatory crackdown and global equities ended the year down for the only time in the last six years. Recall that the MSCI All-Country World Index fell 11% in 2018.2
Today, the situation appears very different. While crypto generally and Bitcoin more specifically remain positively correlated to risk assets such as stocks (fig 1), recently rising inflation expectations appear to be providing some support to digital assets (figs 2 and 3). Indeed, layer 1 smart contract platforms, of which Ethereum is the largest, now comprise $600B+ in market cap with 2022 revenues expected to surpass $30B.3 Meanwhile, as venture capitalists pumped $30B+ into blockchain and crypto startups in 2021 vs. a total of $10B in 2017 and 2018 combined4, crypto entrepreneurs have used those funds to build new open-source products that are now driving further adoption: total addresses on the Ethereum blockchain rose 2.6% m/m in December to 141M, while Bitcoin addresses grew 1.4% m/m to 923M. This is as total transactions on Ethereum now surpass Bitcoin by a multiple of 4.5x (1.2M daily for ETH vs 261K daily for BTC).5 Clearly, the on-chain data continue to indicate strong demand for the rules-based monetary policies of open-source blockchain protocols with smart contract capabilities.

Source: Bloomberg as of 4/1/2022.

Source: Bloomberg as of 4/1/2022.
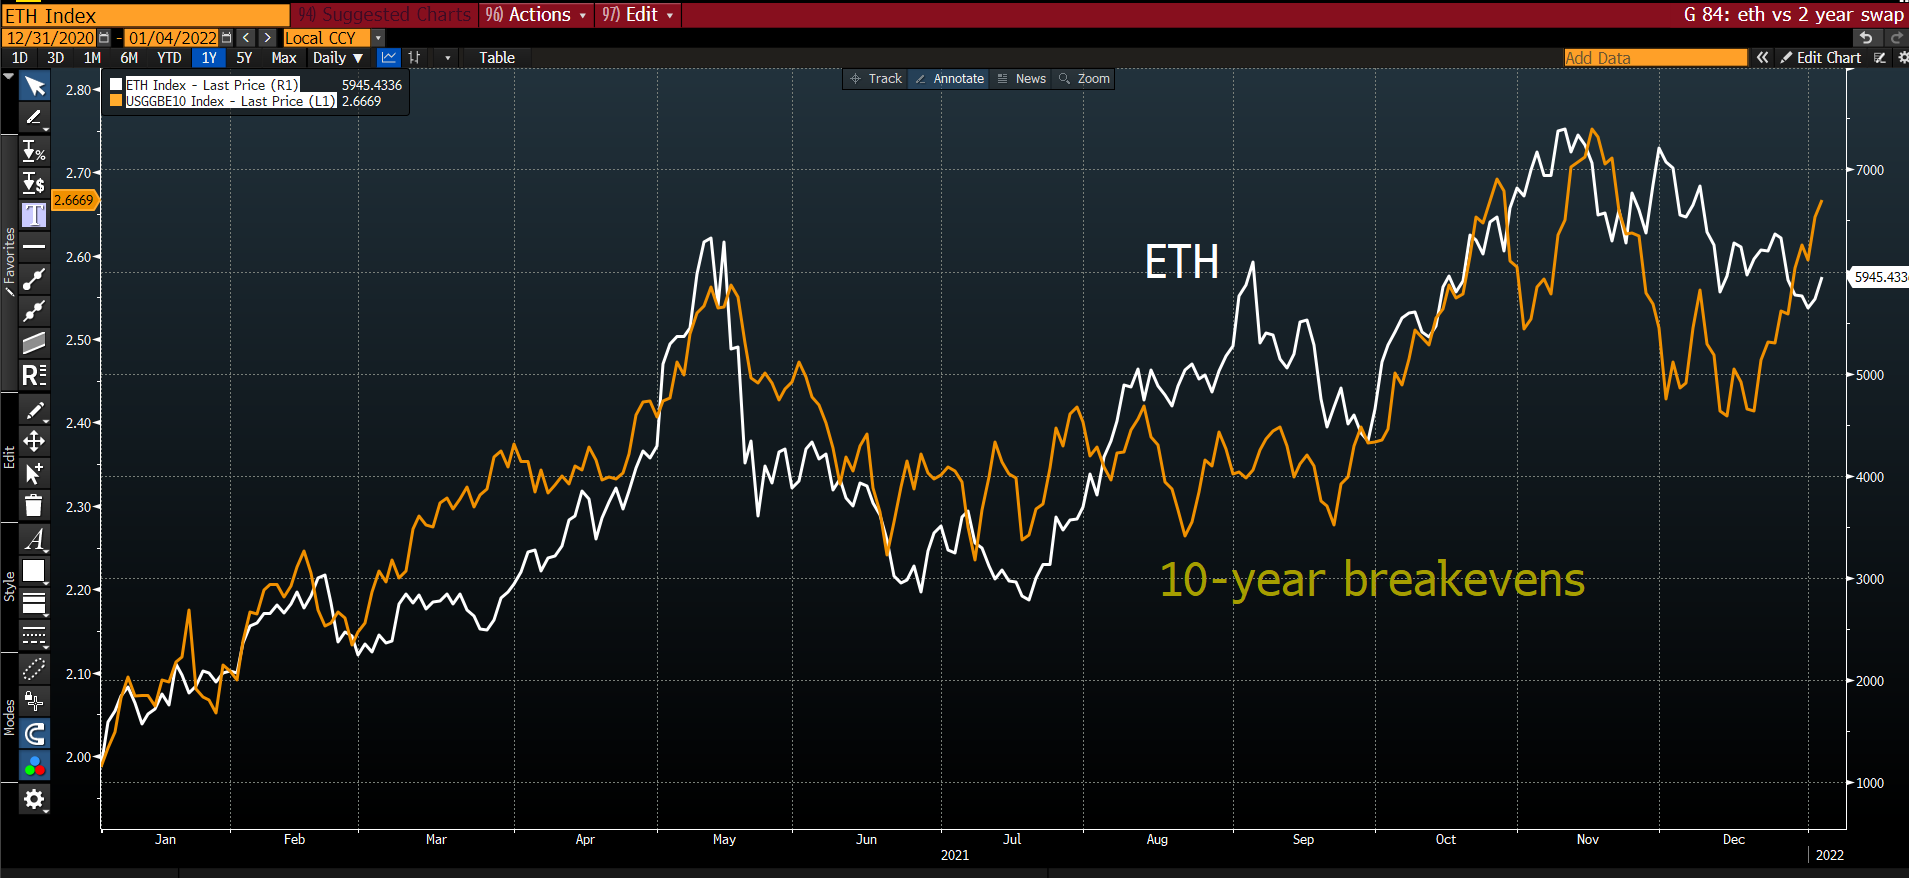
Source: Bloomberg as of 4/1/2022. 10-Year Breakeven Inflation Rate is a measure of expected inflation based on the difference between 10-Year Bond and Treasury Inflation Protected Securities.
But while 2021 saw massive outperformance from smart contract platforms, DeFi protocols struggled mightily as competitive pressures drove multiple forks of popular automated market makers (AMMs), such as Uniswap, with the result being fee pressure and commoditization leading to underperformance. Thus, the MVIS CryptoCompare Smart Contract Leaders Index rose 294% in 2021 vs. a 13% decline for the MVIS CryptoCompare Decentralized Finance Leaders Index6, opening up an enormous discrepancy between token valuations. Indeed, six of the top smart contract platforms trade at an average of 5,450x protocol sales, while six of the top DeFi platforms trade at an average of 9x sales (figs 4 & 5).7

Source: TokenTerminal, as of 4/1/2022.

Source: TokenTerminal, as of 4/1/2022.
Markets often exhibit mean reversion tendencies around year-end, and the snap-back in DeFi performance since late November has been substantial, with the MVIS CryptoCompare Decentralized Finance Leaders Index returning 25% in the last 30 days vs. the MVIS CryptoCompare Smart Contract Leaders Index and MVIS CryptoCompare Media & Entertainment Leaders Index, both flat.8 The catalyst for the re-rating appears to be a number of protocol-specific restructuring and M&A actions, including xDai’s hostile bid for Gnosis, a $2B TVL (total value locked) merger between Rari Capital and Fei, and the likely restructuring of Uniswap fork SushiSwap at the request of institutional investors Arca and Frog Nation. With valuations so low in DeFi, investors should expect additional event-driven catalysts in the sector, though making money from them can be quite labor intensive given the lack of standardized information dissemination processes in crypto. Over the last 30-days, some notable DeFi returns include Curve +74%, yearn.finance +61%, Sushiswap +53% and Aave +37%. Contrast these positive marks to the negative returns from some notable smart contract platform tokens: Solana -13%, Ethereum -9%, and Algorand -3%. For perspective, Bitcoin fell 9%.9
On the topic of uneven information dissemination, we should highlight one important method for evaluating blockchain protocols, in addition to measuring on-chain activity such as address and transaction growth. That is, to track the number and commitment of software developers working on any given blockchain. Github, the cloud-based repository that helps developers store and manage their code, serves as a convenient measuring stick, given its ~85% market share in source-code management.10 Evaluating projects based on the number of Github software commits in the last 30 days, we notice that Solana and Bitcoin have fallen out of the top 5, replaced by Fei (an algorithmic stablecoin governed by the TRIBE governance token, which recently announced a merger with DeFi lending/borrowing pool operator Rari Capital), and NEAR Protocol, a $10B market cap smart contract protocol whose non-profit foundation announced an $800M global funding initiative in October aimed at fostering the development of its DeFi ecosystem and incentivizing developers to build new product.11, 12 Since the announcement of that fund, daily transactions on the NEAR protocol have risen from 300k/day to 500k/day and NEAR’s Github commits have outperformed sharply. Meanwhile the NEAR token has doubled over the same period.13 Catching these inflections in Github commits will be an important element in VanEck’s fund management process as we seek to launch active liquid token strategies in 2022.

Source: Cryptomiso.
The MVIS CryptoCompare Media and Entertainment Leaders Index (MVMELE) is designed to track the performance of the largest and most liquid media & entertainment assets, and is an investable subset of MVIS CryptoCompare Media & Entertainment Index.
MVIS CryptoCompare Media and Entertainment Leaders Index is the exclusive property of MV Index Solutions GmbH (a wholly owned subsidiary of the Adviser), which has contracted with Solactive AG to maintain and calculate the Index. Solactive AG uses its best efforts to ensure that the Index is calculated correctly. Irrespective of its obligations towards MV Index Solutions GmbH, Solactive AG has no obligation to point out errors in the Index to third parties.
1 TradingView, 4/1/22.
2 Bloomberg.
3 Messari, VanEck research as of 4/1/22.
4 Pitchbook, “Venture Capital Funding for Crypto Companies is Surging,” NYTimes, 12/1/2021.
5 Glassnode, 4/1/22.
6 MVIS, as of 4/1/22.
7 TokenTerminal, VanEck, as of 4/1/22.
8 MVIS, as of 4/1/22.
9 Messari, as of 4/1/22.
10 Slintel, https://www.slintel.com/tech/source-code-management/github-market-share#alternatives-and-competitors.
11 “Near announces $800M in funding initiatives to support ecosystem growth,” 25/10/21, https://near.org/blog/near-announces-800-million-in-funding-initiatives-to-support-ecosystem-growth/.
12 Cryptomiso.
13 Messari, NEAR Protocol Blockchain explorer, as of 4/1/22.
This is a marketing communication. Please refer to the prospectus of the UCITS and to the KID before making any final investment decisions.
This information originates from VanEck (Europe) GmbH, which has been appointed as distributor of VanEck products in Europe by the Management Company VanEck Asset Management B.V., incorporated under Dutch law and registered with the Dutch Authority for the Financial Markets (AFM). VanEck (Europe) GmbH with registered address at Kreuznacher Str. 30, 60486 Frankfurt, Germany, is a financial services provider regulated by the Federal Financial Supervisory Authority in Germany (BaFin).
The information is intended only to provide general and preliminary information to investors and shall not be construed as investment, legal or tax advice VanEck (Europe) GmbH, VanEck Switzerland AG, VanEck Securities UK Limited and their associated and affiliated companies (together “VanEck”) assume no liability with regards to any investment, divestment or retention decision taken by the investor on the basis of this information. The views and opinions expressed are those of the author(s) but not necessarily those of VanEck. Opinions are current as of the publication date and are subject to change with market conditions. Certain statements contained herein may constitute projections, forecasts and other forward-looking statements, which do not reflect actual results. Information provided by third party sources is believed to be reliable and have not been independently verified for accuracy or completeness and cannot be guaranteed. Brokerage or transaction fees may apply.
All performance information is based on historical data and does not predict future returns. Investing is subject to risk, including the possible loss of principal.
No part of this material may be reproduced in any form, or referred to in any other publication, without express written permission of VanEck.
© VanEck (Europe) GmbH / VanEck Asset Management B.V.

09 March 2026
09 March 2026