Welcome to VanEck
Select Investor Type
14 October 2020
U.S. dollar strength kept pressure on gold throughout September. The dollar, as measured by the U.S. Dollar Index (DXY),1 trended higher as the stock market trended lower from its all-time highs. The pandemic stimulus-driven bull market looks to be in jeopardy as the S&P 5002 fell sharply at the beginning of the month and the dollar responded to the risk-off sentiment. Gold may have seen additional pressure as a source of cash from equity-related margin selling. Gold had been consolidating above $1,900 per ounce since its $2,075 high on 7 August. The consolidation now looks more like a correction as gold fell to a near-term low of $1,848 on 28 September. For the month, the gold price declined $81.98 (4.2%), ending at $1,885.82 per ounce. The bottom of the current gold bull market trend is around $1,800. We expect this correction to remain above this level.
Gold miners retreated with gold, as the NYSE Arca Gold Miners Index (GDMNTR)3 fell 7.4% and the MVIS Global Junior Gold Miners Index (MVGDXJTR)4 declined 7.6%.
We attended the virtual versions of the Precious Metals Summit and Gold Forum Americas (a/k/a The Denver Gold Forum). The Precious Metals Summit features Junior companies,5 most of which are cashed up from recent equity raises. As a result there was an abundance of drilling results, project updates and plans for more drilling. In our view, with new money comes new discoveries. Several of our companies have recently announced discoveries that we believe will help advance their projects toward production. For example, De Grey Mining looks to have a multi-million ounce discovery in the Pilbara region of Western Australia. Corvus Gold has made additional discoveries at its Southern Nevada project that may turn it into a district-scale play. Galway Metals’ drilling has turned some isolated gold occurrences into a trend that may host over a million ounces in New Brunswick, Canada.
The Gold Forum Americas conference reiterated and enhanced the industry trends that we have been talking about for several years. Large gold producers tripped over each other to inform investors of their cash-generating ability and commitment to return money to shareholders through increasing dividends and/or share buybacks. Balance sheets are pristine, as those who aren’t already in a net-cash position should get there by early 2021. While there isn’t much growth amongst the large companies, many emphasized sustainable production bases for ten years. Newmont (6.8% of net assets) even went beyond, indicating it can sustain current annual production levels of around 6 million ounces into the 2040s. In the past we were lucky to get five years of guidance. Most companies continue to use conservative pricing in the $1,200 to $1,300 per ounce range to calculate reserves and project economics. Companies also expressed a commitment to increasing Environmental, Social and Governance (ESG) initiatives. All of this bodes well for gold equity investors and demonstrates the sustainable financial and operating strength of the industry.
In August, gold reached its all-time high of $2,075 per ounce. At the same time the GDMNTR topped out at 1,271, far below its all-time high of 1,855 in September 2011 when gold reached its former high of $1,921. Since the current bull market began in December 2015, gold advanced 98% to its August 2020 high, while GDMNTR gained 266% over the same period. If the GDMNTR had returned to its old 2011 high of 1,855 in August of this year, it would have advanced 435% since the current bull market began. Here we explore the reasons that gold miners have not reclaimed their all-time highs with gold.
This chart below plots gold versus gold miners (as measured by GDMNTR). Notice that gold and gold miners trade along four discreet trends that have shifted to the right over time. Within each trend, the extent to which gold miners’ price movements can be explained by gold price movements (as measured here by the coefficient of determination, or “R-squared”6) is very high—near 1.0, or nearly 100% of the time in some cases. Alternatively, trend shifts to the right indicate that a given gold price movement corresponds to a lower gold miner price movement than in a preceding trend. In other words, gold miners have been de-rated relative to gold. Also, flatter trend lines indicates lower gold miners’ price beta7 to gold (beta being the performance leverage gold miners naturally carry to gold).
2001 - 2020 Weekly Close
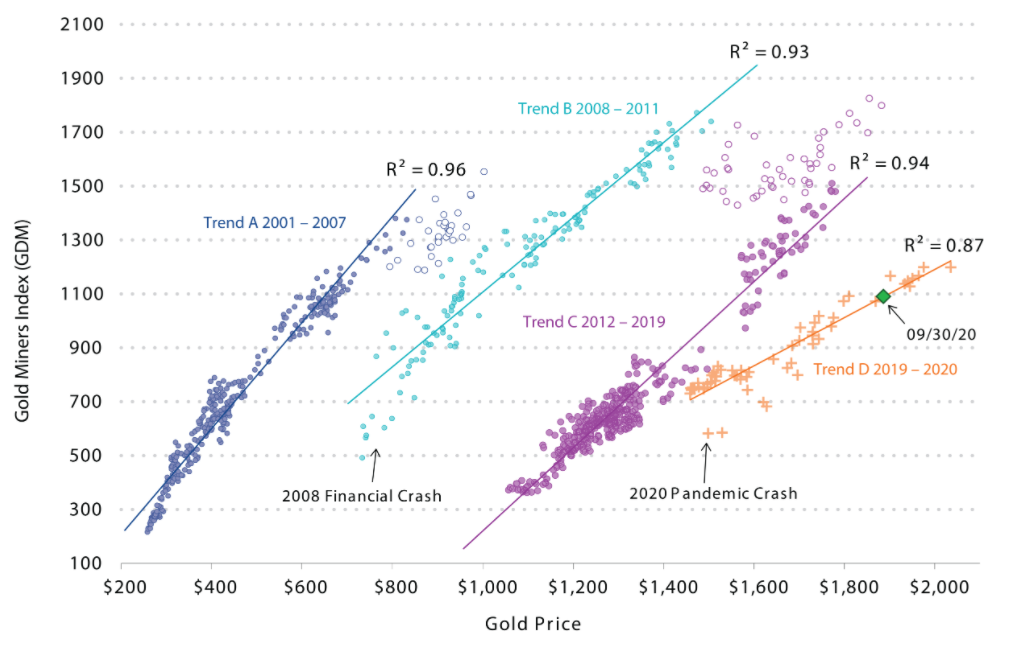
Source: Bloomberg, VanEck Research
The chart shows that gold miners have suffered three de-ratings8 since 2007, with their beta to gold declining as well. The first two de-ratings occurred in late 2007/early 2008 and late 2011/early 2012 (trends A-B-C). These were caused by poor operating and financial performance on many fronts. Cost inflation eroded the operating leverage that investors expected. Rising costs also caused capital projects to fall short of expected returns. Companies made a habit of missing their production and cost guidance. When rates fell after the financial crisis, the Seniors loaded up on debt and many companies overpaid for acquisitions that didn’t perform as promised. As a result, top managements of all the large gold producers lost their jobs. New managements have learned the hard lessons of the past and the industry has completely turned itself around by instilling the right incentive structure from the board to the mines. This is shown by recent financial and operating results and the strategies we have highlighted from the Gold Forum Americas.
Unfortunately, despite all of the improvements, the sector still suffered another de-rating in 2019 (trends C-D). We believe there are two reasons for this:
So far in 2020 gold has advanced 24%, while the GDMNTR is up 34%. If Trend D remains in place through the current cycle, the GDMNTR may reach its historic 2011 high if/when gold reaches $2,755 per ounce. Generally speaking, from current levels, this would translate to a 46% increase for gold and a 70% increase for gold miners.
We believe, the key to achieving a positive re-rating, better performance and higher valuations is attracting generalists back to the sector. Scotia Capital Markets estimates that the average dividend yield of the large gold producers will rise to the average of the S&P 500 sometime in 2021 at 1.5%. Scotia also reckons that if gold prices become sustainable around the $2,000 per ounce level, cash flows should enable yields in the 3% to 4% range. Managements are focused on the task and doing everything in their power to make the gold industry appeal to a broader investor base with their ability to generate returns and mitigate risks.
GDMNTR and MVGDXJTR are dominated by Senior and Mid-Tier gold companies respectively, many of which we hold in our active gold funds. While the large companies are doing a great job, the fact remains that the best way to create value is to make a discovery and turn a barren piece of real estate into a gold mine. This is the type of value creation we find in the Juniors and some of the Mid-Tiers in our active portfolio. This is also how we expect to deliver the leverage to gold seen in past cycles.
*All company, sector, and sub-industry weightings as of 30 September 2020, unless otherwise noted. Source: VanEck, FactSet.
1U.S. Dollar Index (DXY) indicates the general international value of the U.S. dollar by averaging the exchange rates between the U.S. dollar and six major world currencies.
2S&P 500® is a capitalization-weighted index of 500 U.S. stocks from a broad range of industries.
3NYSE Arca Gold Miners Index (GDMNTR) is a modified market capitalization-weighted index comprised of publicly traded companies involved primarily in the mining for gold.
4MVIS Global Junior Gold Miners Index (MVGDXJTR) is a rules-based, modified market capitalization-weighted, float-adjusted index comprised of a global universe of publicly traded small- and medium-capitalization companies that generate at least 50% of their revenues from gold and/or silver mining, hold real property that has the potential to produce at least 50% of the company’s revenue from gold or silver mining when developed, or primarily invest in gold or silver.
5“Juniors” are gold mining companies that typically produce less than 0.3 million ounces of gold per year while Seniors” and “Mid-Tiers” are gold mining companies that produce, approximately,1.5-6.0 and 0.3-1.5 million ounces of gold per year, respectively.
6R-squared is a statistical measure generally interpreted as the extent to which the variance of one factor can explain the variance of a second factor (for example, the percentage of a fund or security's movements that can be explained by movements in a benchmark index).
7Beta is a measure of sensitivity to market movements.
8A change in rating often occurs when the market’s view of a company or industry changes significantly enough—either positively or negatively—to where a company’s or industry’s valuation is impacted as a result.
This is a marketing communication. Please refer to the prospectus of the UCITS and to the KID before making any final investment decisions.
This information originates from VanEck (Europe) GmbH, which has been appointed as distributor of VanEck products in Europe by the Management Company VanEck Asset Management B.V., incorporated under Dutch law and registered with the Dutch Authority for the Financial Markets (AFM). VanEck (Europe) GmbH with registered address at Kreuznacher Str. 30, 60486 Frankfurt, Germany, is a financial services provider regulated by the Federal Financial Supervisory Authority in Germany (BaFin).
The information is intended only to provide general and preliminary information to investors and shall not be construed as investment, legal or tax advice VanEck (Europe) GmbH, VanEck Switzerland AG, VanEck Securities UK Limited and their associated and affiliated companies (together “VanEck”) assume no liability with regards to any investment, divestment or retention decision taken by the investor on the basis of this information. The views and opinions expressed are those of the author(s) but not necessarily those of VanEck. Opinions are current as of the publication date and are subject to change with market conditions. Certain statements contained herein may constitute projections, forecasts and other forward-looking statements, which do not reflect actual results. Information provided by third party sources is believed to be reliable and have not been independently verified for accuracy or completeness and cannot be guaranteed. Brokerage or transaction fees may apply.
All performance information is based on historical data and does not predict future returns. Investing is subject to risk, including the possible loss of principal.
No part of this material may be reproduced in any form, or referred to in any other publication, without express written permission of VanEck.
© VanEck (Europe) GmbH / VanEck Asset Management B.V.
