Crypto Newsletter June 2023: On-chain Analysis
26 June 2023
Network Utilization Measures
The price may be down, but how is the network utilization doing? Last month we looked at active addresses and total addresses in Ethereum and Bitcoin. The number of addresses only reveals the tip of the iceberg when it comes to network utilization measures. Firstly, we can differentiate between utility and utilization measures. While a utility measure shows how much utility a network has, utilization measures show how much a network is really used for a specific utility.
It is actually surprisingly difficult to find a utilization measure that can be used cross-chain, mostly due to the protocol-level differences between blockchains. The most simple and intuitive one is total on-chain volume normalized by market capitalization. We normalize by market capitalization to understand whether there is relatively more volume on one blockchain versus the other. We could take this one step further and use our concept of last week to look on the average normalized on-chain volume per active unique address to understand how many unique users are actually using the chain for value transfer. As we know, value transfer through native (such as ETH on Ethereum) or non-native tokens (such as DAI, an ERC20 decentralized stablecoin) is one of the key utilities of blockchain. The final metric can described as the total on-chain volume divided by the market capitalization divided by the number of unique active addresses.
Luckily for us, all these metrics are readily available from on-chain data providers or even by yourself in case you’re running your own node. For unique active addresses we are using active addresses with a balance higher than 1$ (i.e. excluding insignificant accounts, zero balances). Since this number may be meaningless without comparison we calculate the ratio between Bitcoin and Ethereum. One disadvantage of this metric (could be seen as advantage as well) is that it doesn’t show adoption. It is merely a metric of how much value is transferred per unit of market capitalization per active address.
What does the graph show? Apparently almost no trend, there seems to be some periodicity in the metric. That is not what we are interested in; let’s take a closer look at the ratio and try to understand what is going on. A ratio of 1 would suggest that the value transferred per unit of market capitalization per active user is the same on Ethereum as it is on Bitcoin. A value higher than 1 would suggest that Bitcoin fulfills the value transfer utilization better than Ethereum and vice versa for a value lower than 1. In other words, Bitcoin seems to be consistently undervalued (value above 1) when it comes to value transfer utilization. There is a slight negative slope trend (which is in favor of Ethereum). It remains to be seen whether Ethereum will at some point consistently beat Bitcoin it terms of this metric. One thing that could complete this picture is to also include on-chain volume from layer-2’s on Ethereum (and Bitcoin). I will leave this as an exercise to the reader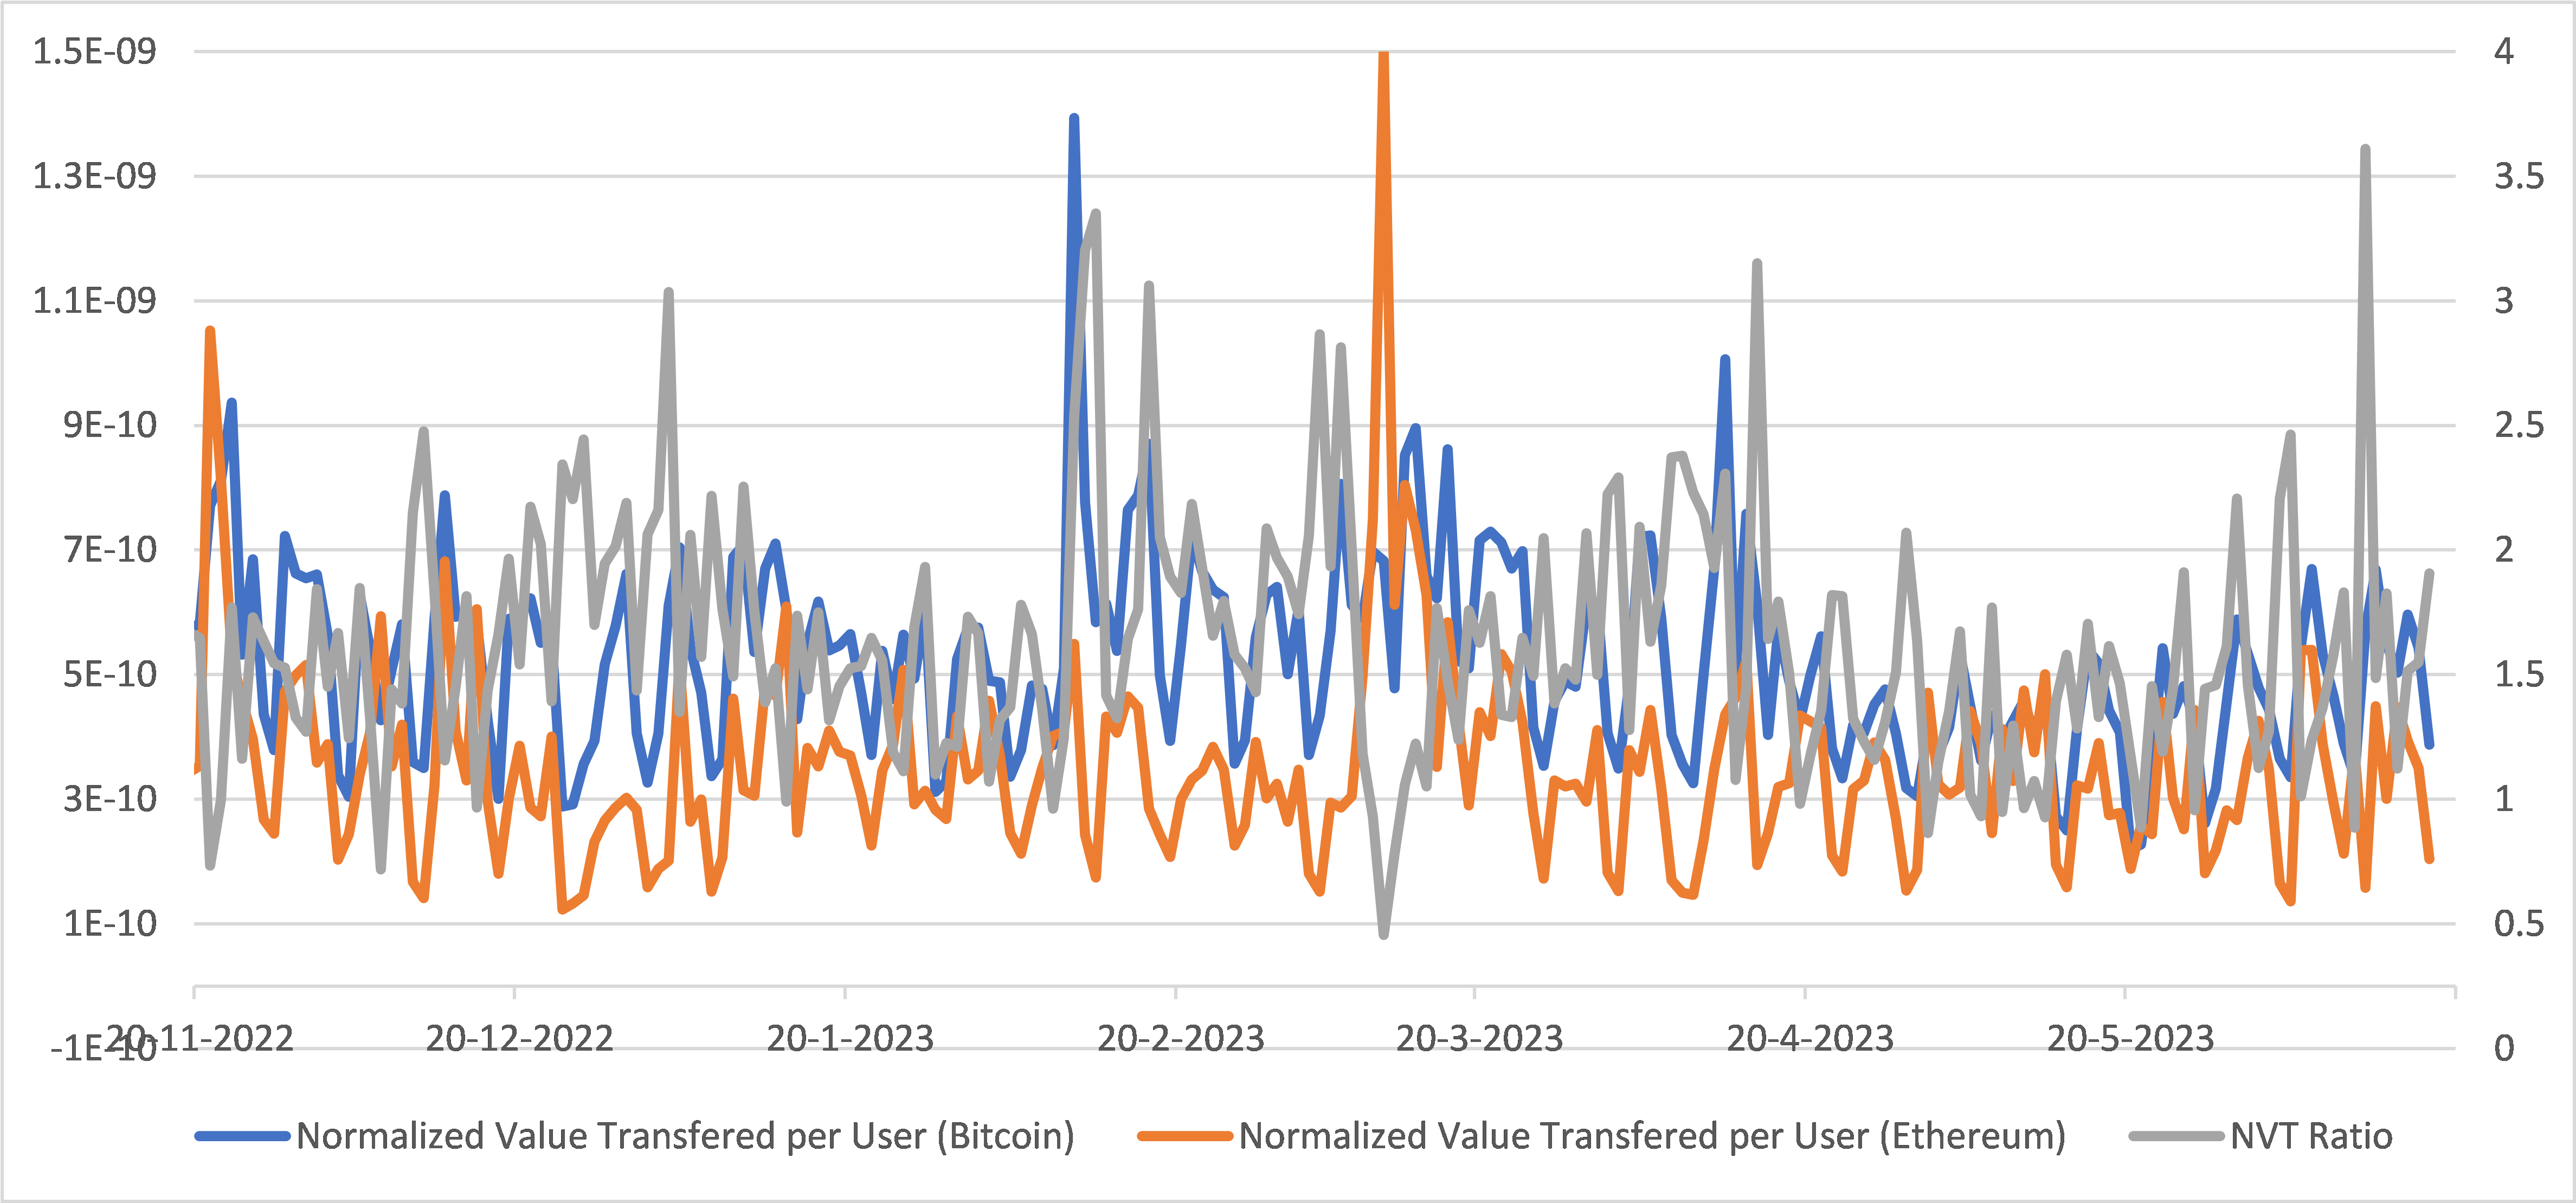
Source: Messari, data as of 19-6-2022 to 19-06-2023. Past performance is no indicator of future results.
Post Shanghai Analysis
It has now been a couple months since full implementation of the Shapella (Shanghai and Capella) upgrade. Through on-chain analysis everyone is capable to review Ethereum’s transformation in quantitative terms and see if it matched our expectations, if not, we try to understand why it did not develop the way we think it would. To quickly recap, the Shapella upgrade allowed Ethereum stakers (i.e. validators) of the proof-of-stake network to withdraw their full or partial stake, it also allowed them to withdraw previously earnt rewards. Pre-update, the market expected initially significant withdrawals followed by even more significant deposits hence Shapella having a net-positive effect on the staking ratio of Ethereum.
Unsurprisingly, the day after the Shanghai/Capella upgrade 14,249 validators exiting, which remains the largest daily count. After this peak, exit events quickly tapered off, having levelled off to between 300 and 700 per day. Overall, this update seemed to have a positive effect on the network so far.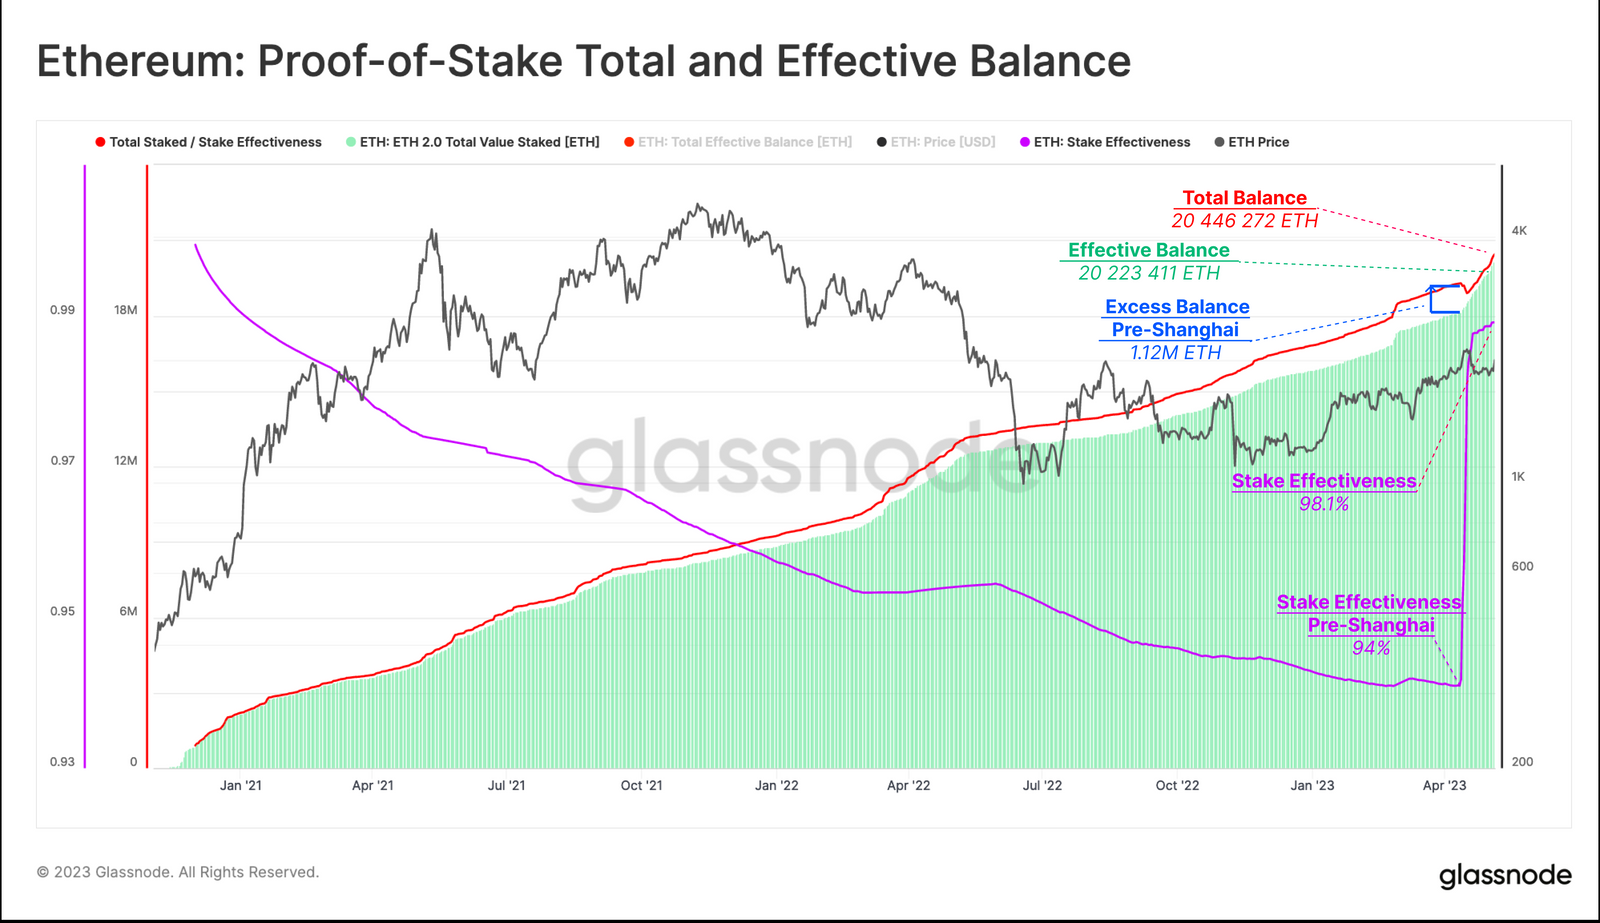
Source: Glassnode, data as of 08-06-2023. Past performance is no indicator of future results.
Important Information
We publish this newsletter to inform and educate about recent market developments and technological updates, not to give any recommendation for certain products or projects. The selection of articles should therefore not be understood as financial advice or recommendation for any specific product and/or digital asset. We may occasionally include analysis of past market, network performance expectations and/or on-chain performance. Historical performance is not indicative for future returns.
ETN Disclaimer
Important information
For informational and advertising purposes only.
This information originates from VanEck (Europe) GmbH, Kreuznacher Straße 30, 60486 Frankfurt am Main. It is intended only to provide general and preliminary information to investors and shall not be construed as investment, legal or tax advice. VanEck (Europe) GmbH and its associated and affiliated companies (together “VanEck”) assume no liability with regards to any investment, divestment or retention decision taken by the investor on the basis of this information. Views and opinions expressed are current as of the date of this information and are subject to change with market conditions. Certain statements contained herein may constitute projections, forecasts and other forward looking statements, which do not reflect actual results. VanEck makes no representation or warranty, express or implied regarding the advisability of investing in securities or digital assets generally or in the product mentioned in this information (the “Product”) or the ability of the underlying Index to track the performance of the relevant digital assets market.
The underlying Index is the exclusive property of MarketVector Indexes GmbH, which has contracted with CryptoCompare Data Limited to maintain and calculate the Index. CryptoCompare Data Limited uses its best efforts to ensure that the Index is calculated correctly. Irrespective of its obligations towards the MarketVector Indexes GmbH, CryptoCompare Data Limited has no obligation to point out errors in the Index to third parties.
Investing is subject to risk, including the possible loss of principal up to the entire invested amount and the extreme volatility that ETNs experience. You must read the prospectus and KID before investing, in order to fully understand the potential risks and rewards associated with the decision to invest in the Product. The approved Prospectus is available at www.vaneck.com. Please note that the approval of the prospectus should not be understood as an endorsement of the Products offered or admitted to trading on a regulated market.
Performance quoted represents past performance, which is no guarantee of future results and which may be lower or higher than current performance.
Current performance may be lower or higher than average annual returns shown. Performance shows 12 month performance to the most recent Quarter end for each of the last 5yrs where available. E.g. '1st year' shows the most recent of these 12-month periods and '2nd year' shows the previous 12 month period and so on. Performance data is displayed in Base Currency terms, with net income reinvested, net of fees. Brokerage or transaction fees will apply. Investment return and the principal value of an investment will fluctuate. Notes may be worth more or less than their original cost when redeemed.
Index returns are not ETN returns and do not reflect any management fees or brokerage expenses. An index’s performance is not illustrative of the ETN’s performance. Investors cannot invest directly in the Index. Indices are not securities in which investments can be made.
No part of this material may be reproduced in any form, or referred to in any other publication, without express written permission of VanEck.
© VanEck (Europe) GmbH
Important Disclosure
This is a marketing communication. Please refer to the prospectus of the UCITS and to the KID before making any final investment decisions.
This information originates from VanEck (Europe) GmbH, which has been appointed as distributor of VanEck products in Europe by the Management Company VanEck Asset Management B.V., incorporated under Dutch law and registered with the Dutch Authority for the Financial Markets (AFM). VanEck (Europe) GmbH with registered address at Kreuznacher Str. 30, 60486 Frankfurt, Germany, is a financial services provider regulated by the Federal Financial Supervisory Authority in Germany (BaFin).
The information is intended only to provide general and preliminary information to investors and shall not be construed as investment, legal or tax advice VanEck (Europe) GmbH, VanEck Switzerland AG, VanEck Securities UK Limited and their associated and affiliated companies (together “VanEck”) assume no liability with regards to any investment, divestment or retention decision taken by the investor on the basis of this information. The views and opinions expressed are those of the author(s) but not necessarily those of VanEck. Opinions are current as of the publication date and are subject to change with market conditions. Certain statements contained herein may constitute projections, forecasts and other forward-looking statements, which do not reflect actual results. Information provided by third party sources is believed to be reliable and have not been independently verified for accuracy or completeness and cannot be guaranteed. Brokerage or transaction fees may apply.
All performance information is based on historical data and does not predict future returns. Investing is subject to risk, including the possible loss of principal.
No part of this material may be reproduced in any form, or referred to in any other publication, without express written permission of VanEck.
© VanEck (Europe) GmbH / VanEck Asset Management B.V.