Welcome to VanEck
Select Investor Type
12 August 2020
The gold bull market passed two important sign-posts in July. The strength of the market is impressive as it blew through $1,800 and the all-time high of $1,921. These prices had been major technical resistance points set a decade ago.
The second significant signpost in July was the new U.S. dollar weakness. U.S. dollar weakness is a hallmark of most gold bull markets, but in this cycle gold had so far been rising in a flat dollar environment. The chart below shows the U.S. dollar index (DXY)1 has been in a bull market since 2011. However, the dollar declined through July, then fell precipitously at the end of the month, appearing to have broken its long-term trend. We may be seeing the beginnings of a bear market for the dollar. This enabled gold to test the $2,000 per ounce milestone as it reached an intraday high of $1,983 on July 31. Gold closed out July at $1,975.86 per ounce for a $194.90 (10.9%) monthly gain.
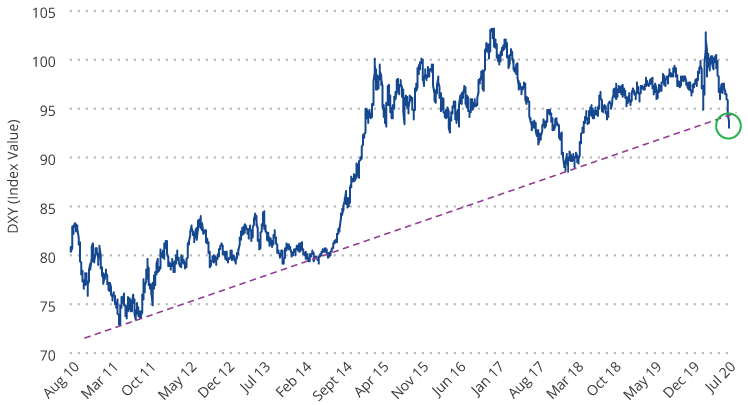
Source: VanEck, Bloomberg. Data as of 31 July 2020. Past performance is not a guarantee of future results.
Gold stocks moved higher as the vast majority of companies reporting second quarter results met or exceeded expectations. COVID-related costs were also reported, showing the industry has done an excellent job of dealing with operational issues in our view. For example, 1.7 million ounce producer Agnico-Eagle (approximately net assets of 4.7% as of end-July) was among those hardest hit by pandemic lock downs. Its costs for temporary mine suspensions totaled $22 million, whereas the cash provided from operations totaled $162 million. Going forward, per the company’s second quarter 2020 financial results, Agnico-Eagle expects COVID protocols to cost $6 per ounce, which raises their cash costs by less than 1%. For the month, the NYSE Gold Miners Index (GDMNTR)2 gained 14.4%, while the MVIS Global Junior Gold Miners Index (MVGDXJTR)3 advanced 19.8%.
Junior developers are a class of company that you won’t find much of in passive index funds. These are companies with properties that are in various stages of development, but not yet producing gold. Our active gold equity strategy invests across the spectrum of companies and currently carries 22 junior developers that total approximately 26% of the strategy’s net assets as of end-July. These companies had been underperforming since the gold price broke out in June 2019. This is a sharp contrast from past bull markets, when the juniors began outperforming the larger companies much earlier. Through the second quarter and into July, the junior developers have finally kicked into gear. Seven of our juniors have now gained over 100% year to date. We don’t expect to give back these gains because the stocks had been extremely undervalued and many of our companies have announced encouraging drill results and new discoveries that create lasting value. In addition, investors have returned to the junior sector, enabling companies to raise $1.5 billion this year, and the second quarter was their strongest for equity raises since 2012, according to RBC Capital Markets.
Gold has tested the $2,000 per ounce level sooner than we had anticipated and we believe there is more than the pandemic to overcome at this point.
The pandemic created a deflationary shock to the economy and the massive accumulation of debt since the GFC creates a drag on productivity that could guarantee a low growth economy for decades to come. Negative real rates, persistent risks to economic well-being, and the weak dollar are drivers that we believe could enable gold to trend to $3,400 per ounce in the coming years. This might be a conservative forecast considering the 180% rise gold experienced from the depths of the GFC (see our gold price projection here). Several scenarios could see gold prices moving higher from there:
Some might balk at such bold forecasts, however, we believe the various drivers of gold are rarely aligned as they are today. We also consider gold’s relative size in the financial markets. There have been 200,000 tonnes of gold mined in the history of the world and virtually all of it is potentially available to the market. A gold price of $2,000 per ounce yields a market value of $12.9 trillion. Compare this with global stock, bond and currency markets, each of which totals roughly $100 trillion or more. A relatively small shift in funds from these markets may fuel the gold price for a long time.
In addition, the market value of the global gold industry as of end-July is approximately $530 billion. The market value of Alphabet Inc. as of the same time, alone, is $1.0 trillion. Gold mining is a relatively tiny sector that, in addition to carrying earnings leverage to the gold price, carries a scarcity factor when market demand is high.
1U.S. Dollar Index (DXY) indicates the general international value of the U.S. dollar by averaging the exchange rates between the U.S. dollar and six major world currencies.
2NYSE Arca Gold Miners Index (GDMNTR) is a modified market capitalization-weighted index comprised of publicly traded companies involved primarily in the mining for gold.
3MVIS Global Junior Gold Miners Index (MVGDXJTR) is a rules-based, modified market capitalization-weighted, float-adjusted index comprised of a global universe of publicly traded small- and medium-capitalization companies that generate at least 50% of their revenues from gold and/or silver mining, hold real property that has the potential to produce at least 50% of the company’s revenue from gold or silver mining when developed, or primarily invest in gold or silver.
NYSE Arca Gold Miners Index is a service mark of ICE Data Indices, LLC or its affiliates (“ICE Data”) and has been licensed for use by VanEck UCITS ETF plc. (the “Fund”) in connection with VanEck Gold Miners UCITS ETF (the “Sub-Fund”). Neither the Fund nor the Sub-Fund is sponsored, endorsed, sold or promoted by ICE Data. ICE Data makes no representations or warranties regarding the Fund or the Sub-Fund or the ability of the NYSE Arca Gold Miners Index to track general stock market performance.
ICE DATA MAKES NO EXPRESS OR IMPLIED WARRANTIES, AND HEREBY EXPRESSLY DISCLAIMS ALL WARRANTIES OF MERCHANTABILITY OR FITNESS FOR A PARTICULAR PURPOSE WITH RESPECT TO THE NYSE ARCA GOLD MINERS INDEX OR ANY DATA INCLUDED THEREIN. IN NO EVENT SHALL ICE DATA HAVE ANY LIABILITY FOR ANY SPECIAL, PUNITIVE, INDIRECT, OR CONSEQUENTIAL DAMAGES (INCLUDING LOST PROFITS), EVEN IF NOTIFIED OF THE POSSIBILITY OF SUCH DAMAGES. ICE Data Indices, LLC and its affiliates (“ICE Data”) indices and related information, the name "ICE Data", and related trademarks, are intellectual property licensed from ICE Data, and may not be copied, used, or distributed without ICE Data's prior written approval. The Fund or Sub-Fund have not been passed on as to its legality or suitability, and is not regulated, issued, endorsed, sold, guaranteed, or promoted by ICE Data.
MVIS Global Junior Gold Miners are the exclusive property of MVIS (a wholly owned subsidiary of Van Eck Associates Corporation), which has contracted with Solactive AG to maintain and calculate the Index. Solactive AG uses its best efforts to ensure that the Index is calculated correctly. Irrespective of its obligations towards MV Index Solutions GmbH, Solactive AG has no obligation to point out errors in the Index to third parties. The VanEck Junior Gold Miners UCITS ETF are not sponsored, endorsed, sold or promoted by MV Index Solutions GmbH and MV Index Solutions GmbH makes no representation regarding the advisability of investing in the Fund.
This is a marketing communication. Please refer to the prospectus of the UCITS and to the KID before making any final investment decisions.
This information originates from VanEck (Europe) GmbH, which has been appointed as distributor of VanEck products in Europe by the Management Company VanEck Asset Management B.V., incorporated under Dutch law and registered with the Dutch Authority for the Financial Markets (AFM). VanEck (Europe) GmbH with registered address at Kreuznacher Str. 30, 60486 Frankfurt, Germany, is a financial services provider regulated by the Federal Financial Supervisory Authority in Germany (BaFin).
The information is intended only to provide general and preliminary information to investors and shall not be construed as investment, legal or tax advice VanEck (Europe) GmbH, VanEck Switzerland AG, VanEck Securities UK Limited and their associated and affiliated companies (together “VanEck”) assume no liability with regards to any investment, divestment or retention decision taken by the investor on the basis of this information. The views and opinions expressed are those of the author(s) but not necessarily those of VanEck. Opinions are current as of the publication date and are subject to change with market conditions. Certain statements contained herein may constitute projections, forecasts and other forward-looking statements, which do not reflect actual results. Information provided by third party sources is believed to be reliable and have not been independently verified for accuracy or completeness and cannot be guaranteed. Brokerage or transaction fees may apply.
All performance information is based on historical data and does not predict future returns. Investing is subject to risk, including the possible loss of principal.
No part of this material may be reproduced in any form, or referred to in any other publication, without express written permission of VanEck.
© VanEck (Europe) GmbH / VanEck Asset Management B.V.
