Does 60/40 Still Work in China?
17 December 2020
Read Time 2 MIN
The classic 60/40 portfolio has been challenged due to the extremely low yields in developed markets currently, with prospects for a meaningful increase appearing unlikely any time soon. This has driven many investors to increase their risk exposure to maintain an adequate yield, by increasing allocations to non-core asset classes such as high yield credit, emerging markets debt and equity income. While these can provide an attractive yield pickup, they do not come without additional risks. In addition, an investor’s exposure to equity markets increases with these asset classes due to their higher correlation to stocks, increasing the risk of drawdowns and higher volatility.
Outside of the U.S., however, there are still opportunities to use a broad fixed income allocation as both a yield enhancer as well as a diversifier and risk-reducer within a diversified portfolio. China’s onshore bond markets, in particular, may be attractive to the growing number of investors seeking exposure to that country’s impressive economic growth and ongoing transformation into a consumer led economy. Adding bonds to an equity exposure historically has helped to increase risk adjusted returns by lowering volatility and drawdowns. A simplified analysis using two asset classes, large cap equities (represented by the CSI 300 Index) and investment grade aggregate fixed income (represented by the ChinaBond China High Quality Bond Index) helps to illustrate this. Although an efficient frontier analysis would suggest a much higher allocation to bonds to optimize the risk/return tradeoff, we think a 60/40 allocation serves as a useful benchmark. Since we believe the asset allocation decision within China is distinct from the currency analysis, we show the risk and return statistics in both CNY and USD terms.
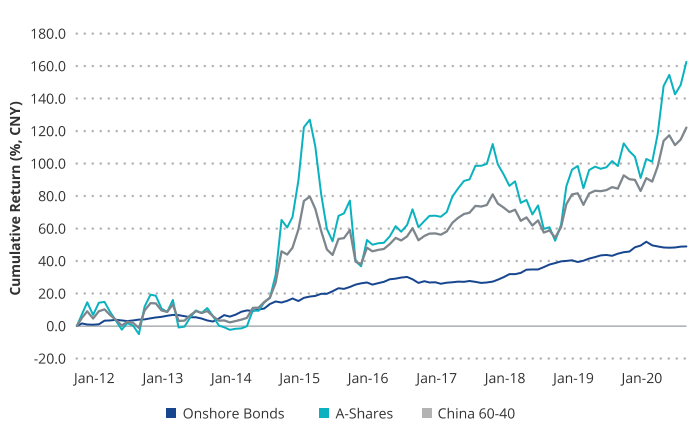
Growth of a Balanced China Portfolio
| February 2012 through November 2020 | |||||||||
| Return | Std Dev | Sharpe Ratio | Max Drawdown | Yield | |||||
| USD | CNY | USD | CNY | USD | CNY | USD | CNY | ||
| Onshore Bonds | 3.94 | 4.44 | 4.52 | 2.78 | 0.72 | 0.69 | -7.14 | -3.78 | 3.55% |
| A-Shares | 10.14 | 10.67 | 24.81 | 23.47 | 0.48 | 0.47 | -42.98 | -39.78 | 1.80% |
| China 60-40 | 8.34 | 8.86 | 15.52 | 14.01 | 0.55 | 0.53 | -27.20 | -23.11 | 2.50% |
Source: Morningstar and Bloomberg, as of 11/30/2020.
The blended portfolio provides not only a higher yield, but also a significantly improved risk adjusted return due to the negative correlation between the two asset classes. Volatility and maximum drawdown of the 60/40 blend is nearly 40% lower than an all-equity exposure, while capturing 0.70% of additional annual yield. A blended portfolio may also benefit from the many tailwinds that we expect onshore bonds to benefit from going forward, including positive real yields, several potential sources of support for CNY and increasing inflows from international investors. We believe a less aggressive tone from Washington D.C. may also benefit a China oriented portfolio.
Related Insights

Related Insights
08 October 2026
11 September 2026
08 October 2026
EMBX fell 2.65% in September but beat Treasuries by a full point and is up 1.41% YTD. Conditions continue to favor EM over DM, and markets are starting to price it.
11 September 2026
EM bonds, gold, and Chinese government bonds are rising while the assets built to absorb risk are falling. The market is rethinking what counts as safe.
28 August 2026
A debt sustainability framework for a Venezuelan bond restructuring, and what it implies for recovery values.
10 August 2026
Fiscal dominance, sanctions, and war footings are combining to make DM risks clearer to markets, with Japan and Europe as the key focal points.
16 July 2026
When global risk fades, EM fundamentals take center stage; and right now, inflation discipline, high real rates, and Chinese bond resilience make a compelling case for the asset class.