CLOs: A Better Way to Access Leveraged Loans
09 October 2026
Read Time 7 MIN
Key Takeaways:
- AI disruption and rate hikes are pressuring loan borrowers, but CLO structures absorb the stress.
- Investment-grade CLO tranches have never defaulted, not even in 2008, COVID, or the 2023-2025 cycle.
- CLO managers cut software exposure quickly in 2026, showing active management working in real time.
Growing concern about artificial intelligence's impact on software-intensive and other borrowers considered at risk of AI disruption has introduced a new source of volatility in the leveraged loan market. Interest rate volatility continues, and with the latest hike, financing costs will likely increase, which will impact lower-quality loan borrowers. Investment-grade collateralized loan obligations (CLOs) have absorbed two years of credit stress: a rate-driven default cycle and now an AI-driven sector rotation.
How Have Leveraged Loan Default Rates Trended Since the 2023-2025 Stress Cycle?
Default rates have normalized following the rate-driven stress cycle of 2023-2025. As of July 2026, the leveraged loan default rate stands at 1.33% (including distressed exchanges, it would be 2.32%), both below historical averages. At their peak during the 2023-2025 cycle, loan defaults, including distressed exchanges, were approximately 4.5%, with loan fund investors absorbing those losses directly. Investment-grade CLO tranche investors saw none of that and actually saw spreads tighten until the Liberation Day volatility of April 2025.
Loan Default Rates Declined in 2025
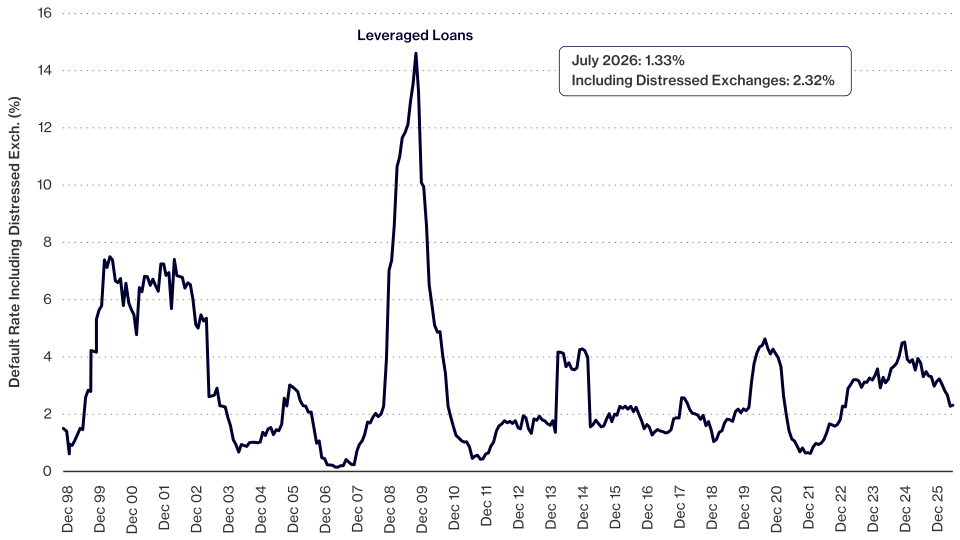
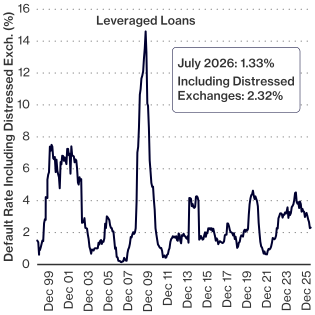
Source: J.P. Morgan. Leveraged Loan refers to the J.P. Morgan Leveraged Loan index default rate. Distressed exchange refers to companies that offer existing credit new securities in place for their current debt.
Coverage Ratio Compression: What This Means for CLO Investors
Coverage ratios have compressed. EBITDA (earnings before interest, taxes, depreciation, and amortization)/interest expense declined from roughly 5.5x in 2022 to approximately 4.1x as of the second quarter of 2026, as interest expense rose faster than operating income for many floating-rate borrowers during the tightening cycle. With less cushion between operating cash flow and debt service, issuer selection matters more than it did four years ago. For an investor in leveraged loans directly, a borrower that cannot service its debt is a direct loss. For a CLO investor, that same pressure hits a structure with its own layers of protection between the investor and the borrower before principal is at risk.
Coverage Ratios: Compressed from Peak
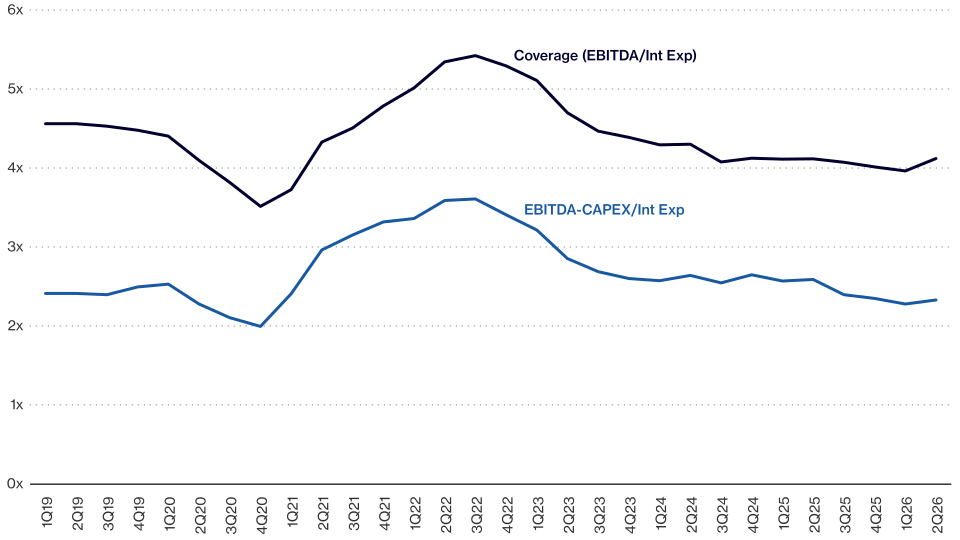
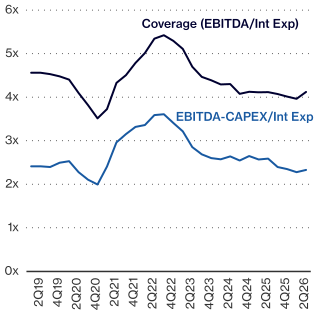
Source: J.P. Morgan. Coverage ratios represent J.P. Morgan aggregate data for leveraged loan issuers. EBITDA = earnings before interest, taxes, depreciation, and amortization; CAPEX = capital expenditures; Int Exp = interest expense.
How Are AI Disruption and Rising Interest Rates Affecting CLO Portfolios?
The more immediate headwind is sector-specific; AI disruption and rising interest rates are both pressuring borrowers across the loan market. AI is disrupting borrowers across industries viewed as having their business models at risk, not just pure-play software companies. The leveraged loan market and CLOs each carry roughly 10-15% exposure to the services and software subsector, leaving both exposed to the same underlying risk. The difference is how that risk lands on investors. With coverage ratios compressed, less cushion at the borrower level, and higher interest rates, portfolio composition and active management are more consequential today than they were in 2022.
How Do CLO Structural Protections Insulate Investment-Grade Investors?
CLO structures have multiple layers of protection built in. The past four years of credit stress showed what that actually means in practice.
US CLO defaults by original rating1 (1994 - 2025)
| Issued pre-GFC “CLO 1.0” | Issued post-GFC “CLO 2.0/3.0”2 | |||||
| Tranche Rating | # Ratings | # Defaults | % Defaulted | # Ratings | # Defaults | % Defaulted |
| AAA | 1,541 | 0 | 0.0 | 5,965 | 0 | 0.0 |
| AA | 616 | 1 | 0.2 | 4,455 | 0 | 0.0 |
| A | 790 | 5 | 0.6 | 3,762 | 0 | 0.0 |
| BBB | 783 | 9 | 1.1 | 3,923 | 0 | 0.0 |
| BB | 565 | 22 | 3.9 | 2,762 | 16 | 0.6 |
Source:1S&P Global: Default, Transition, and Recovery: 2025 Annual Global Leveraged Loan CLO Default And Rating Transition Study and J.P. Morgan. 2CLO 2.0/3.0 are CLOs issued 2010 and after. GCF refers to the Global Financial Crisis. A CLO tranche rating is the credit rating assigned to a specific layer (also known as a tranche) within a Collateralized Loan Obligation.
Defaults in investment-grade CLO tranches have been virtually nonexistent since the asset class was established. AAA-rated tranches have never experienced a default; not through 2008, when leveraged loan defaults reached approximately 15%, not through COVID, and not through the 2023-2025 rate-driven cycle. For BBB tranches, it is estimated that 9-13% of a CLO's loan portfolio would need to default for five to seven consecutive years before the first dollar of principal is lost. That is three to four times the historical annual average, sustained for multiple years. Historically, this has not occurred.
| CLO Structural Protection | What It Does |
| Active Management | CLO managers analyze issuers and apply sector expertise to construct portfolios. Fees are generally linked to performance. |
| Credit Support | Subordinated tranches absorb losses first. |
| Covenants and Collateral Requirements | CLO portfolios are subject to quality and diversity tests. Interest cash flows are diverted to pay off senior tranches if tests such as interest coverage or overcollateralization are not met. |
| Excess Spread | Excess income versus interest paid on debt tranches protects if coverage tests are not met and can be used to buy additional assets or pay down notes. |
Source: VanEck.
Historical defaults in investment-grade tranches have been extremely rare and were primarily experienced in CLOs issued before the financial crisis. Since then, subordination levels and portfolio guidelines have become more conservative. The 2023-2025 credit cycle provided a real-world stress test, one that investment-grade CLO tranches passed. A direct investment in a leveraged loan fund exposes capital to default losses one-for-one. CLOs absorbed the same default activity without impacting the principal of the debt tranches due to structural protections, especially within investment-grade CLOs. According to S&P in their annual leveraged loan and CLO default study, there were no defaults from initially rated investment-grade CLOs in 2023-2025. In 2023, there were eight tranches that defaulted; in 2024, there were five tranches that defaulted; and in 2025, there were six tranches that defaulted. All these tranches were rated BB or lower.
How CLO Managers Are Actively Responding to Risk
Although default risk is not the primary concern for investment-grade CLOs, investors are exposed to spread risk and downgrade risk. The most discussed risk today is AI disruption. The data shows managers are responding and doing so quickly.
According to J.P. Morgan's August 2026 CLO holdings analysis, which covers approximately 83% of the CLO universe, CLO managers cut their software overweight from 113 basis points above the index in April to essentially flat by July. Within software, they rotated out of the most stressed names and into the performing portion of the market. The broader credit positioning tells the story that CLOs are running more conservative books, with meaningful cuts to their lowest-rated and most distressed holdings. This is active management doing what it is supposed to do.
CLO Aggregate exposure to Software loans relative to the Index
| Services and Software | CLO Aggregate (%) | J.P. Morgan Leveraged Loan Index (%) | CLO Over/Under vs JPM LL Index |
| Jul-26 | 13.27 | 13.21 | 6bp |
| Apr-26 | 14.60 | 13.47 | 113bp |
| YE25 | 13.98 | 14.35 | -37bp |
| Q/Q Change | -1.33 | -0.26 | -108bp |
| YTD change | -0.71 | -1.13 | 42bp |
Source: J.P. Morgan; S&P/IHS Markit; INTEX.
Data as of July 2026. CLO Aggregate based on J.P. Morgan CLO holdings data. bp = basis points; YE25 = year-end 2025; Q/Q = quarter-over-quarter; YTD = year-to-date.
How Have Investment-Grade CLOs Performed During Market Downturns?
Historically, CLOs have performed relatively well in market downturns. The data from five stress episodes since the 2010s (the 2013 taper tantrum, the 2015-2016 oil collapse, Q4 2018, COVID, and the 2022 inflation sell-off) supports this. Across those periods, investment-grade CLOs averaged a peak drawdown of -2.74% vs. -5.49% for leveraged loans.
The thesis from 2022 was that CLOs offered a structurally superior way to access leveraged loans. Two years of rate stress, a default cycle, an AI-driven sector rotation, and new interest rate hikes have each tested that thesis. Investment-grade CLO tranches absorbed all of it. The structural case holds, and active managers are adjusting portfolios in real time to keep it that way.
From September 2022 through August 2026, investment-grade CLOs and mezzanine CLOs have demonstrated better risk-adjusted returns (Sharpe Ratio) than leveraged loans, while offering the same structural protections. Mezzanine CLOs also outperformed on total return: 10.03% vs. 8.13% for loans.
Risk
Time Period: 9/1/2022 to 8/31/2026 , Currency: US Dollar
| Return | Std Dev | Sharpe Ratio | |
| JP Morgan CLO IG Index | 7.06 | 1.53 | 1.53 |
| JPM CLO Bal Mezz Index | 10.03 | 3.66 | 1.41 |
| Mstar LSTA US LL 100 (BBG) | 8.13 | 3.20 | 1.04 |
Source: Morningstar Direct. Sharpe Ratio measures risk-adjusted return (return in excess of the risk-free rate divided by standard deviation). Past performance is no guarantee of future results. Index performance is not representative of fund performance. It is not possible to invest directly in an index.
VanEck's CLO ETF and Fund Offerings
With the Fed back to raising rates, the floating rate structure remains a benefit and now comes with the structural protection the asset class has historically offered. VanEck partnered with MetLife Investment Management on two actively managed CLO ETFs. The VanEck CLO ETF (CLOI) provides access to investment-grade floating-rate CLOs, and the VanEck AA-BB CLO ETF (CLOB), launched in September 2024, provides actively managed access to mezzanine CLO tranches for investors seeking higher income within the CLO structure. Both funds benefit from the decades of experience of MetLife Investment Management as a CLO manager, CLO tranche investor, and leveraged finance specialist. In 2026, VanEck launched its first interval fund, the VanEck CLO Opportunities Fund, which invests primarily in equity and debt tranches of CLOs, rated BBB or below.
Disclosures
This is not an offer to buy or sell, or a recommendation to buy or sell any of the securities mentioned herein. The information presented does not involve the rendering of personalized investment, financial, legal, or tax advice. Certain statements contained herein may constitute projections, forecasts and other forward looking statements, which do not reflect actual results, are valid as of the date of this communication and subject to change without notice. Information provided by third party sources are believed to be reliable and have not been independently verified for accuracy or completeness and cannot be guaranteed. The information herein represents the opinion of the author(s), but not necessarily those of VanEck.
The J.P. Morgan Leveraged Loan Index is designed to track the performance of the U.S. dollar-denominated institutional leveraged loan market.
The J.P. Morgan CLO IG Index is designed to track the performance of U.S. dollar-denominated, investment-grade (rated AAA to BBB) CLO debt tranches.
The J.P. Morgan CLO Balanced Mezzanine Index is designed to track the performance of U.S. dollar-denominated mezzanine CLO debt tranches rated AA to BB.
The Morningstar LSTA US Leveraged Loan 100 Index is designed to measure the performance of the 100 largest facilities in the U.S. leveraged loan market.
Index returns are not Fund returns and do not reflect any management fees or brokerage expenses. Certain indices may take into account withholding taxes. Investors can not invest directly in the Index. Returns for actual Fund investors may differ from what is shown because of differences in timing, the amount invested and fees and expenses. Index returns assume that dividends have been reinvested.
An investment in the VanEck AA-BB CLO ETF (CLOB) and VanEck CLO ETF (CLOI) may be subject to risks which include, but are not limited to, risks related to Collateralized Loan Obligations (CLO), debt securities, CLO manager, foreign currency, foreign securities, investment focus, newly-issued securities, extended settlement, affiliated fund investment, management and capital preservation, derivatives, currency management strategies, cash transactions, market, operational, authorized participant concentration, no guarantee of active trading market, trading issues, fund shares trading, premium/discount, liquidity of fund shares and non-diversified risks, all of which may adversely affect the Funds. Investments in debt securities may expose the Funds to other risks, such as risks related to liquidity, interest rate, floating rate obligations, credit, call, extension, high yield securities, income, valuation, privately-issued securities, covenant lite loans, and default of the underlying asset risks, all of which may impact the Funds’ performance. Derivatives may involve certain costs and risks such as liquidity, interest rate, and the risk that a position could not be closed when most advantageous.
An investment in the VanEck CLO Opportunities Fund-I (“CLOIX”) may be subject to risks which includes, among others, CLO, CLO equity tranche, debt securities, high yield securities, income, valuation, privately issued securities, covenant lite loans, SOFR, investment sourcing, defaulted securities, syndicated loan, correlation, liquidity (quarterly repurchases and underlying investments), leveraging, CLO manager, investment focus, newly issued securities, extended settlement, private credit, underlying fund, business development company, foreign currency, derivatives, repurchase policy, distribution and RIC status, new fund, market, active management, non-diversified, potential conflicts of interest, and minimal capitalization risks, all of which may adversely affect the Fund. Debt securities may be subject to additional risks, such as liquidity, interest rate, floating rate obligations, credit, call, and extension risks.
Investing involves substantial risk and high volatility, including possible loss of principal. An investor should consider the investment objective, risks, charges and expenses of the Funds carefully before investing. To obtain a prospectus and summary prospectus, which contain this and other information, call 800.826.2333 or visit vaneck.com. Please read the prospectus and summary prospectus carefully before investing.
© Van Eck Securities Corporation, Distributor, a wholly owned subsidiary of Van Eck Associate Corporation.
Related Insights

Related Insights
28 August 2026
24 September 2026
Green bonds finance renewable energy, clean transport, and climate infrastructure. Learn how they work, who issues them, and how to invest.
28 August 2026
AI is driving a surge in energy demand. Green bonds are one way the industry is responding. Here is how the data center green bond market works and how the industry is growing.
11 August 2026
Many investors need more than traditional bonds can deliver. VanEck provides access to a range of higher-yielding asset classes built for today's income environment.
22 July 2026
CLOs posted positive Q2 returns as spread tightening lifted all tranches. But with AI risk and geopolitical uncertainty rising, dispersion rewards disciplined credit selection.
17 July 2026
How do CLOs perform in a downturn? We analyzed five major market episodes to compare CLO drawdowns and recoveries against high yield, corporate bonds, and leveraged loans.