The Strait of Hormuz and What Comes Next: Oil Market Outlook
16 September 2026
Read Time 8 MIN
Key Takeaways
- A third of global crude flows through the Strait of Hormuz — even the largest reserve release in history barely dented the gap when it closed.
- Asia's demand didn't vanish, it paused: Refiners are ramping back up and about to compete for barrels in a system already running flat out.
- Disrupted chokepoints rarely fully heal, as the Red Sea has shown — Hormuz may follow suit, permanently raising the cost of the world's cheapest crude.
- With SPR releases ending, deferred Asian demand returning, and no slack left in global refining, the setup favors durable upside for oil-levered equities.
Why Oil-Levered Equities?
We have written several times about our constructive stance on oil-levered equities — exploration and production, oilfield services, and refining. Our overweight positioning began in the fall of 2025, when consensus was pricing in a massive supply glut arriving in 2026. We disagreed. Not only did we believe fears of oversupply were misplaced, but we held a longer-term view that the marginal cost of crude was poised to rise — driven principally by the maturing of U.S. shale, where productivity gains are flattening and the era of dramatic cost deflation is behind us.
Crude Oil Historical Prices
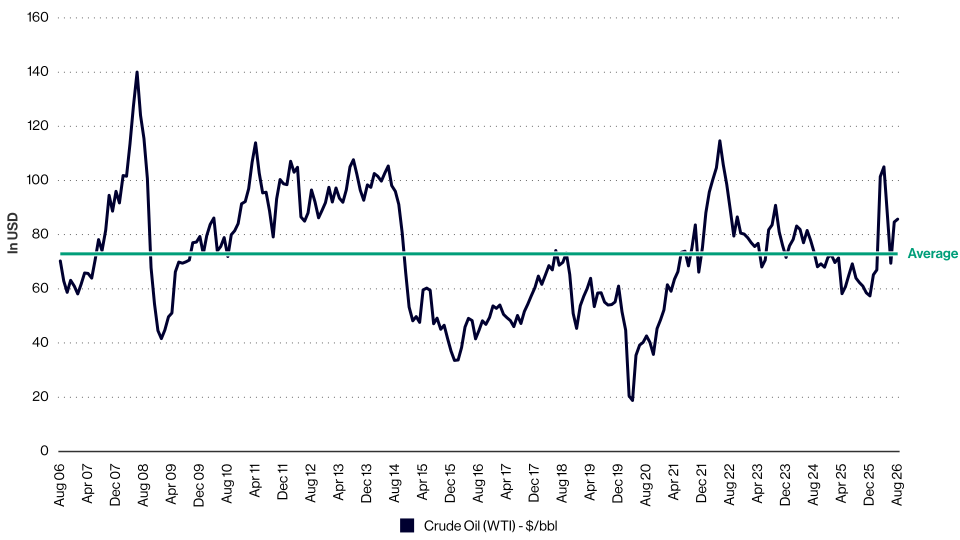
Source: Bloomberg. Data as of 8/31/2026.
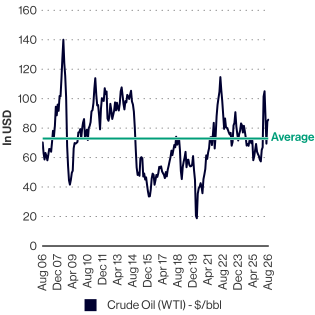
And in fact, with long-term average crude prices of approximately $73.50, adding equity exposure with crude in the mid $60s seemed reasonable.
What Was the Strait of Hormuz Worth
Before the conflict, oil flows through the Strait averaged approximately 20.9 million barrels per day — roughly 34% of all global crude trade transiting a navigable channel just four miles wide. Only Saudi Arabia and the UAE have pipeline infrastructure capable of routing crude around it, with a combined available capacity of 3.5 to 5.5 million barrels per day. Every other Gulf producer — Iraq, Kuwait, Qatar, Bahrain, and Iran — has zero alternative export infrastructure. Roughly 14 million barrels per day were structurally locked to this single passage.
The Strait of Hormuz Closure: What Happened to Oil Flows?
On February 28, 2026, following coordinated U.S. and Israeli strikes on Iran, the Islamic Revolutionary Guard Corps (IRGC) declared the Strait closed to Western-allied shipping. Tanker traffic collapsed almost immediately. At the trough — spanning April through mid-June — average crude flows through the Strait fell to approximately 2.3 million barrels per day, an 89% decline from pre-war levels. On the single worst day in early March, just one commercial vessel transited a waterway that historically saw 138 ships per day.
Government Response to the Oil Supply Shock
Governments responded within two weeks. The International Energy Agency’s (IEA) 32 member nations announced a globally coordinated release of 400 million barrels — the largest in the agency's 50-year history, more than double the release following Russia's invasion of Ukraine. The U.S. committed 172 million barrels from its Strategic Petroleum Reserve (SPR), which at the time held 415 million barrels. That release translated to roughly 3.3 million barrels per day over 120 days — covering less than 20% of the supply gap at the trough, which explains why Brent crude surged 17% or more even after the announcement.
Is the U.S. Strategic Petroleum Reserve Still an Effective Tool?
As of early September, the U.S. SPR stood at 286.6 million barrels — the lowest level since November 1982. When the full authorized release is completed, inventories are projected to fall to approximately 243 million barrels. The functional minimum required to maintain cavern integrity is estimated at around 70 million barrels, but a July analysis by Rapidan Energy estimates that approximately 103 million barrels of current inventory are inaccessible due to aging infrastructure. In practical terms, the SPR's role as a meaningful price-management tool is largely exhausted.
Asia Oil Demand Collapse or Demand Deferral?
China, Japan, South Korea, and India collectively cut crude imports by an unprecedented 7.2 million barrels per day between February and April — roughly three-quarters of total Gulf export losses. China alone accounted for 74% of the global import decline, drawing on a strategic reserve estimated at 1.2 billion barrels accumulated cheaply via sanctioned Iranian crude over prior years. Société Générale credited China's import reduction as the single largest offset to the price shock — larger than all coordinated SPR releases combined.
Many analysts concluded this represented permanent demand destruction. We disagree.
What actually happened is straightforward: Asian refineries curtailed throughput sharply as crude feedstock dried up. Chinese refinery runs fell from 15.2 million barrels per day in February to a trough of 12.47 million barrels per day in June — the lowest level since March 2020, at the onset of COVID. State-owned refiner utilization fell below 60%. Japan's crude imports collapsed from roughly 2.5 million barrels per day to 680,000 barrels per day by April. South Korea fell by 1 million barrels per day. Singapore's refinery utilization crashed below 50%. India, better positioned through its existing Russian crude channels, still saw runs fall nearly 13%.
The demand that appeared to disappear was deferred. It is now returning — and Asian refiners are bidding for crude out of necessity, not choice.
The Bab al-Mandab Precedent
Many commentators assumed the Strait of Hormuz crisis would be short-lived — that the world's most war-gamed energy chokepoint would yield a swift diplomatic resolution. We were skeptical of this from the outset, and the analogy that informed our skepticism was the Bab al-Mandab Strait in the Red Sea.
Bab al-Mandab — the narrow passage between Yemen and the Horn of Africa connecting the Red Sea to the Gulf of Aden — was subject to Houthi attacks beginning in late 2023. Despite being militarily outmatched and equipped with relatively cheap, unsophisticated weapons, the Houthis succeeded in reducing Red Sea shipping to below 70% of pre-attack levels — and it never recovered. The disruption proved persistent, costly, and resistant to military solutions.
If that experience is instructive — and we believe it is — the Strait of Hormuz, even with partial reopening, may not fully normalize in the near term. Additional egress pipelines that bypass the Strait will eventually be built, but they will take years to permit, finance, and construct. And when they arrive, they will carry crude at higher cost than seaborne transport — meaning the lowest-cost, shortest-cycle barrels in the world will permanently carry a higher marginal cost than they did before February 2026. That is a structural shift in the global supply curve, not a temporary disruption.
What the Oil Market Setup Looks Like From Here
The acute phase of the energy shock is receding, but the structural implications are only now becoming clear. Consider what is simultaneously true:
The ~3.3 million barrels per day of daily SPR releases deployed globally during the crisis are ending. Both strategic reserves and commercial inventories now need to be rebuilt — at prices that, while elevated versus pre-war levels, are lower than the panic peaks. That restocking demand is real and durable.
Asian refinery utilization, which collapsed to multi-decade lows during the conflict, is recovering. Kpler projects Chinese crude throughput rising from 12.6 million barrels per day in July to 13.5 million by October. As runs normalize, the crude demand that appeared to vanish will reappear on the front end of the refinery.
Refinery utilization in the United States is already running at 98% of capacity — essentially maxed out. There is no slack in the Western refining system. As Asian capacity returns to service, it will bid against an already-strained global system for crude feedstock.
Against this demand recovery, the supply backdrop remains structurally constrained. The global oil industry requires replacement of 5 to 6 million barrels per day of natural decline annually — a treadmill that never stops — and U.S. shale growth, the great swing supplier of the past decade, continues to flatten as the best acreage is drilled and productivity gains decelerate. Bright spots for production growth include Brazil, the UAE, Guyana, and potentially even Canada. We do not see meaningful barrels from Venezuela in the medium term, and overall, supply growth outside the U.S. remains too limited to offset the decline curve.
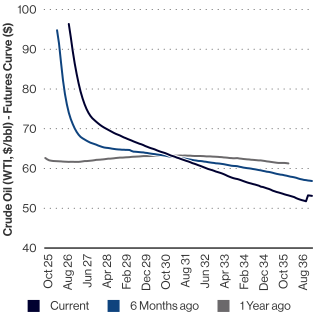
We began building this position when the market was pricing in abundance. The crisis in the Strait accelerated what was already coming. The easy short-term release valve — strategic petroleum reserves — is spent. The deferred Asian demand is returning. The structural supply ceiling is not going away. While the back end of the curve has crept up, it is still only in the high $60s and represents good value for equity investors.
Crude Futures Curve Comparison
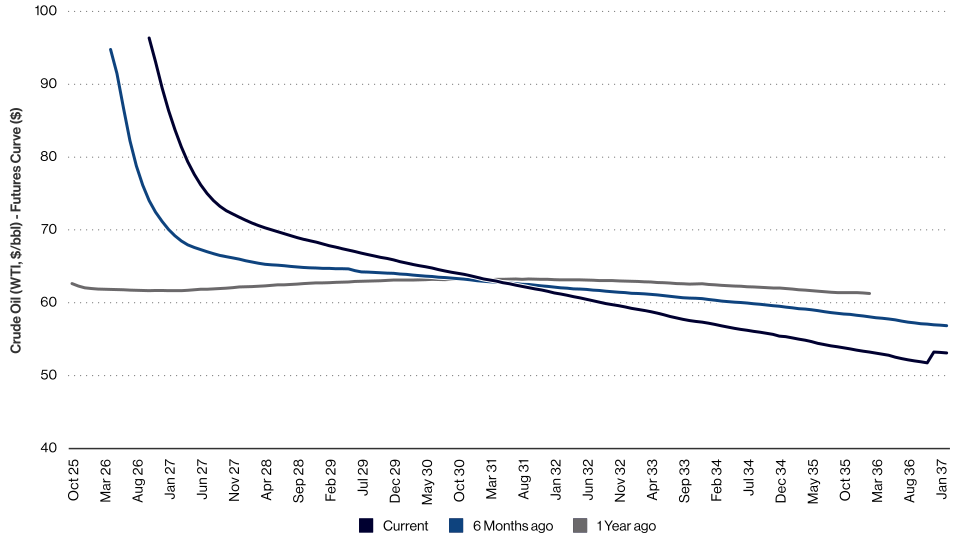
Source: Bloomberg. Data as of 9/9/2025.
We remain constructive.
IMPORTANT DISCLOSURES
This is not an offer to buy or sell, or a recommendation to buy or sell any of the securities, financial instruments or digital assets mentioned herein. The information presented does not involve the rendering of personalized investment, financial, legal, tax advice, or any call to action. Certain statements contained herein may constitute projections, forecasts and other forward-looking statements, which do not reflect actual results, are for illustrative purposes only, are valid as of the date of this communication, and are subject to change without notice. Actual future performance of any assets or industries mentioned are unknown. Information provided by third party sources are believed to be reliable and have not been independently verified for accuracy or completeness and cannot be guaranteed. VanEck does not guarantee the accuracy of third-party data. The information herein represents the opinion of the author(s), but not necessarily those of VanEck or its other employees.
The principal risks of investing in VanEck ETFs and mutual funds include, but are not limited to, sector, market, economic, political, foreign currency, world event, index tracking, active management, social media analytics, derivatives, blockchain, commodities and non-diversification risks, as well as fluctuations in net asset value and the risks associated with investing in less developed capital markets. VanEck ETFs may also be subject to authorized participant concentration, no guarantee of active trading market, trading issues, passive management, fund shares trading, premium/discount risk and liquidity of fund shares risks. VanEck ETFs or mutual funds may loan their securities, which may subject them to additional credit and counterparty risk. ETFs or mutual funds that invest in high-yield securities are subject to subject to risks associated with investing in high-yield securities; which include a greater risk of loss of income and principal than funds holding higher-rated securities; concentration risk; credit risk; hedging risk; interest rate risk; and short sale risk. ETFs or mutual funds that invest in companies with small capitalizations are subject to elevated risks, which include, among others, greater volatility, lower trading volume and less liquidity than larger companies. Please see the prospectus of each Fund for more complete information regarding each Fund’s specific risks.
Investing involves substantial risk and high volatility, including possible loss of principal. An investor should consider the investment objective, risks, charges and expenses of a Fund carefully before investing. To obtain a prospectus and summary prospectus, which contain this and other information, call 800.826.2333 or visit vaneck.com. Please read the prospectus and summary prospectus carefully before investing.
© Van Eck Securities Corporation, Distributor.
Related Insights

Related Insights
07 August 2026
Global rearmament is a metals race in disguise. Defense budgets are surging, hardware drives the spend, and China controls the supply — yet resource equities remain unpriced. We see an opportunity.
23 July 2026
After three strong years, many nuclear and uranium stocks have given back a chunk of their gains. We look at what drove the pullback, what’s gone right, and the opportunity ahead.
22 July 2026
Permian gas was literally worth less than nothing, for years. New pipeline infrastructure is changing that. Find out why this structural shift has us more convicted than ever on Permian E&P companies.
14 July 2026
Q2 2026 geopolitical shocks sent commodities surging and tumbling. Active security selection proved critical as oil retreated, gold sold off, and steel surged to multi-year highs.
06 July 2026
Nuclear energy is gaining momentum as a clean, reliable solution powered by innovation across mining, technology, and utilities.