Welcome to VanEck
Select Investor Type
12 November 2026
This article covers market developments through the end of October 2026. All performances are stated in USD. Returns may increase or decrease as a result of currency fluctuations. The figures above cover a single month: past performance is not a reliable indicator of future results, and the value of investments can fall as well as rise, so investors may not get back the amount originally invested.
Gold fell $282.79 an ounce, or 6.80%, in October and closed the month at $3,874.62. The gold mining stocks, as represented by the MarketVector Global Gold Miners Index (MVGDXTR), fell 11.88% over the same period. Investing is subject to risk, including the possible loss of principal. Even so, gold averaged $4,107 an ounce in October and has averaged about $4,500 so far in 2026; a healthy level for producers, whose reserves and project economics are built on prices well below it. What has changed this year is the ride. Annualized realized volatility in gold is around 29% in 2026, nearly double the average of about 15% over the prior five years (2021–2025).
Sources: World Gold Council, MarketVector, as of October 2026.
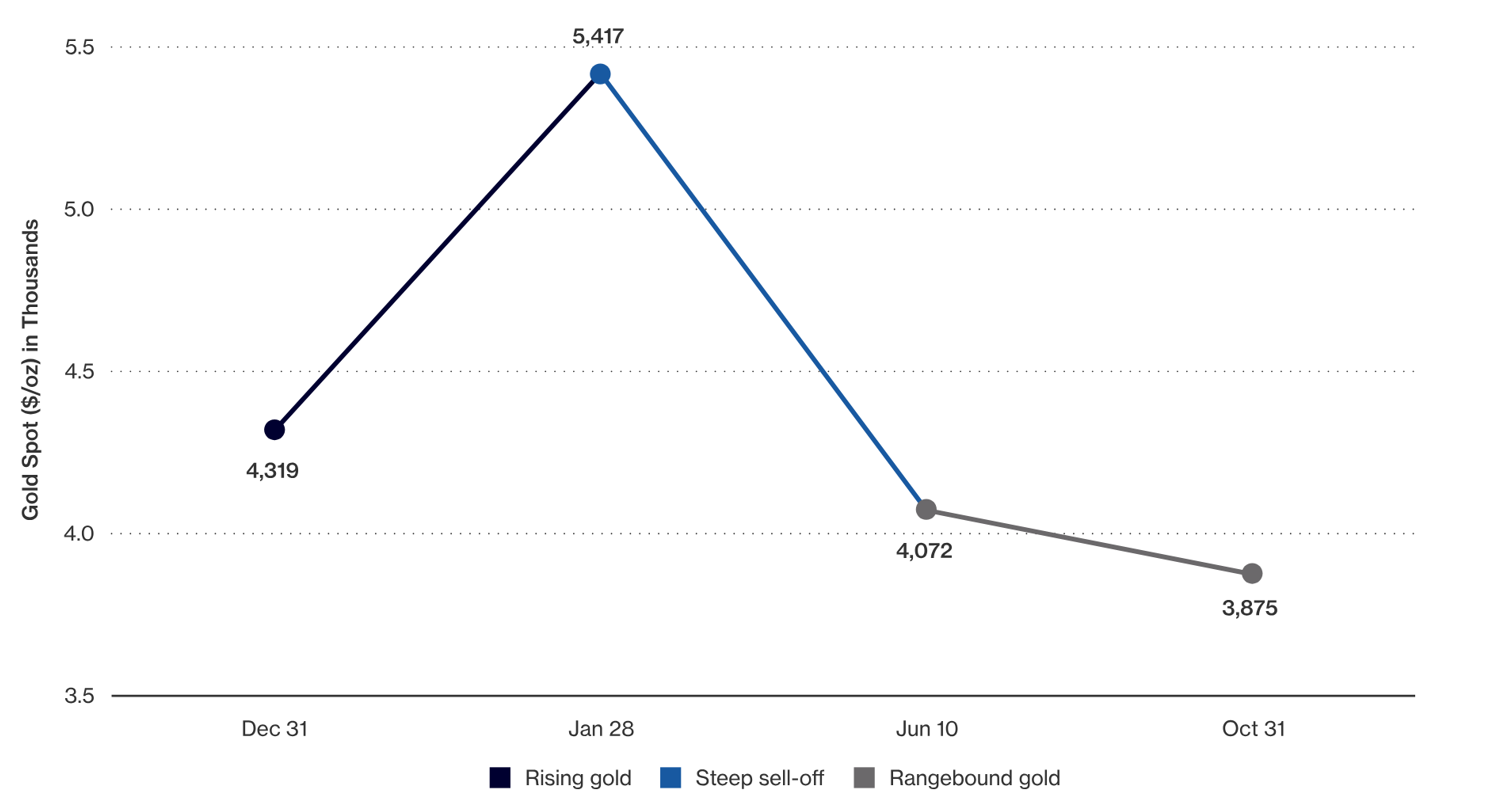
Gold mining stocks showed greater sensitivity to gold’s moves in both directions this year, then held up during the recent sideways period. That makes 2026 a useful test of how the sector behaves across different gold price environments. Gold has had three phases this year: a sharp rally into late January, a sell-off that deepened after the war in Iran began, and a sideways market around $4,000 an ounce since the summer. The question gold equity investors ask us most is how sensitive mining stocks really are to changes in the gold price. This year’s answer has some nuance, and we think it points back to the strength of the businesses behind the stocks.
Source: VanEck and Bloomberg. Data as of 10/31/2026. GDX: VanEck Gold Miners ETF; GDXJ: VanEck Junior Gold Miners ETF. Returns for periods less than one year are not annualized.
Calendar-Year Returns (%) — GDX and GDXJ, 2021–2025
| 2021 | 2022 | 2023 | 2024 | 2025 | |
| VanEck Gold Miners UCITS ETF (GDX) | -9.72% | -8.92% | 10.08% | 10.08% | 155.67% |
| VanEck Junior Gold Miners UCITS ETF (GDXJ) | -21.47% | -14.65% | 7.90% | 14.91% | 174.20% |
Source: VanEck. Data as of November 2026. Past performance is not indicative of future results.
Past performance is no guarantee of future results. Investment return and principal value will fluctuate; shares may be worth more or less than original cost when redeemed. Current performance may be lower or higher. Investing is subject to risk, including the possible loss of principal.
In the chart above, the rally ends at the January 28 gold peak. We split the sell-off at March 26, where its steepest leg ended.
Here, beta measures how sensitive mining stock returns were to daily changes in the gold price over each period.
Investors often ask how closely gold stocks follow gold, and the answer is very closely. Over 2026 the correlation of both GDX and GDXJ with gold was 0.84, and in each of the last three periods it was between 0.82 and 0.90. A correlation of 0.84 means gold explains roughly 70% of the day-to-day moves in the miners, with the rest coming from equity markets and company-specific news. The January rally is the exception, at about 0.55, but that period covered fewer than 20 trading days, which is a short window that makes the estimate less reliable.
Earlier this year we outlined three gold scenarios for miners: rising gold, range-bound gold and a gold pullback. We did not include a steep sell-off among our original scenarios, despite gold’s spectacular rise earlier in the year. What happened is worth reviewing.
| Rising Gold | Steep Sell-off | Rangebound Gold | Gold Pullback | |
| Gold Price Environment | Gold continues higher from record levels | Gold falls sharply, far beyond a normal pullback | Gold consolidates near recent levels | Gold declines, but remains above levels implied by current valuation assumptions |
| Gold Equities Performance | Strong outperformance vs. gold via operating leverage | Miners fall more than gold as broad risk-off selling compounds the move | Outperformance still possible through valuation re-rating | Resilient performance, supported by cash flow |
| Valuations & Margins | Re-rating accelerates; record margins persist | Valuations compress with the broad market; margins narrow but remain wide | Valuations adjust upward as spot prices are validated | Margins compress modestly but remain historically high |
| Investor Implication | Leveraged upside to a rising gold price | Share prices can overshoot fundamentals on the downside | Gold equities work even without higher gold prices | Downside cushioned by conservative assumptions |
| What Actually Happened | Dec 31 – Jan 28: gold +25.4%, GDX +30.8%, GDXJ +32.2%. Miners outperformed, but captured only about 1.2–1.3x of gold’s move. | Jan 28 – Jun 10: gold −24.8%, GDX −34.2%, GDXJ −37.1%. Too much for miners to absorb; they fell about 1.4–1.5x as much as gold. | Jun 10 – Oct 31: gold −4.9%, GDX +4.4%, GDXJ +0.5%. Miners outperformed through re-rating. | Year to date, Dec 31 – Oct 31: gold −10.3%, GDX −10.1%, GDXJ −16.5%. Seniors held up with gold; juniors lagged. |
Source: VanEck and Bloomberg. Data as of 10/31/2026. For illustrative purposes only. Not a projection of future results. Returns for periods less than one year are not annualized. Past performance is no guarantee of future results.
Note: Return ratios compare mining stock returns with gold returns over each period. For example, a ratio of 1.2x means mining stocks rose or fell 1.2 times as much as gold. Beta measures sensitivity to daily gold returns, while correlation measures how closely daily returns move together. These measures describe different aspects of the relationship and may vary by period.
The asymmetry is worth noting. When gold surged in January, miners captured only about 1.2x to 1.3x of the move.
This is not uncommon in the earlier stages of a rally: investors doubt the higher price will last and do not fully price it into the stocks. When gold reversed, miners fell about 1.4x to 1.5x as much. In addition, the first leg of the sell-off, which included the start of the war in Iran, was a broad-based sell-off across global equity markets, and we believe that added to the selling pressure on gold stocks on top of the move in gold itself. A market that is slow to give credit on the way up and quick to take it away on the way down can leave the stocks below what the fundamentals support. The range-bound period, when miners rose while gold drifted lower, looks like some of that gap closing.
Miners’ share prices have followed gold on the way down, but we believe their businesses have not weakened. What is behind that resilience?
The market’s reaction to capital plans offers another example of what we see as a valuation disconnect. However, when a gold producer announces a large project or updates project capex estimates, the shares often fall. Project capital estimates can rise as studies are updated, scopes change or costs increase. Investors also remember the previous gold bull cycle, when capital discipline slipped. But today producers are more restrained, and they can generally fund projects from operating cash flow without issuing debt or equity or putting on disproportionate gold price hedges. In addition, they set reserves, resources and project economics at gold prices well below spot. For projects evaluated at lower gold prices, a moderate pullback from $4,000 may still leave expected returns above the required hurdle.
While we understand the skepticism, in our view the market’s reaction to capital plans may not fully account for the underlying fundamentals, though concerns around capital discipline and execution risk remain valid considerations. We believe these fundamentals could support share prices over time, even as short-term moves remain closely tied to gold. The risks worth watching are cost inflation, operational performance and project execution.
Of course, we would all like to see gold move higher and margins expand further. But after a year like this one, what gold stocks may need most is for gold to go quiet at these levels for a while. A calmer metal would give the companies room to show what they have built, with strong margins, net cash balances, and disclosed growth plans, without a market distracted by swings of 20% or more in the price of gold. We believe that when investors can focus more on the underlying business and less on the next move in the metal, stock prices may more closely reflect assessed business fundamentals. A gap between stock prices and assessed business value currently appears to exist; however, that gap may not close in the anticipated direction, and business fundamentals may change. This represents one possible analytical outcome, not a guarantee of future performance.
To receive more Gold Investing insights, sign up to our newsletter.
Sources for data/information unless otherwise indicated: Bloomberg and company research, October 2026.
IMPORTANT INFORMATION
This is a marketing communication.
For investors in Switzerland: VanEck Switzerland AG, with registered office in Genferstrasse 21, 8002 Zurich, Switzerland, has been appointed as distributor of VanEck’s products in Switzerland by the Management Company VanEck Asset Management B.V. (“ManCo”). The representative in Switzerland is Zeidler Regulatory Services (Switzerland) AG, Stadthausstrasse 14, CH-8400 Winterthur, Switzerland. Swiss paying agent: Helvetische Bank AG, Seefeldstrasse 215, CH-8008 Zürich.
For investors in the UK: This is a marketing communication targeted at Professional Clients and Eligible Counterparties. Retail investors should seek assistance from a financial intermediary for all investment guidance and advice. VanEck Securities UK Limited (FRN: 1002854) is an Appointed Representative of Strata Global Limited (FRN: 563834), which is authorised and regulated by the Financial Conduct Authority (FCA) in the UK, to distribute VanEck’s products to FCA regulated firms such as financial intermediaries and Wealth Managers. The Funds are recognised in the UK under the Overseas Funds Regime but are not UK-authorised Funds. UK investors should note that complaints in relation to the Funds cannot be referred to the Financial Ombudsman Service, and any related claims for losses will not be covered by the Financial Services Compensation Scheme.
This information originates from VanEck (Europe) GmbH, which is authorized as an EEA investment firm under the Markets in Financial Instruments Directive (“MiFID”). VanEck (Europe) GmbH has its registered address at Kreuznacher Str. 30, 60486 Frankfurt, Germany, and has been appointed as distributor of VanEck products in Europe by the ManCo, which is incorporated under Dutch law and registered with the Dutch Authority for the Financial Markets (AFM).
This material is only intended for general and preliminary information and does not constitute an investment, legal or tax advice. No representation or warranty is made as to the accuracy or completeness of the information and no liability is accepted to the fullest extent permitted by law. The views and opinions expressed are those of the author(s) but not necessarily those of VanEck. Opinions are current as of the publication date and are subject to change with market conditions. Information provided by third party sources is believed to be reliable and has not been independently verified for accuracy or completeness and cannot be guaranteed.
Please refer to the Prospectus — in English language — and the Key Information Document (“KID”) — in local language — before making any final investment decisions and for full information on risks. These documents can be obtained free of charge at www.vaneck.com, from the ManCo or from the appointed facility agent.
VanEck Gold Miners UCITS ETF (“ETF”) is a sub-fund of VanEck UCITS ETFs plc, a UCITS umbrella investment company, registered with the Central Bank of Ireland, passively managed and tracking an equity index.
The value of the ETF may fluctuate significantly as a result of the investment strategy. The ETF´s holdings are disclosed on each dealing day on www.vaneck.com under the ETF´s Holdings section and as per PCF under the Documents section and published via one or more market data suppliers. The indicative net asset value (iNAV) of the ETF is available on Bloomberg. For details on the regulated markets where the ETF is listed, please refer to the Trading Information section on the ETF page at www.vaneck.com. Investors must buy and sell units of the UCITS on the secondary market via an intermediary (e.g. a broker) and cannot usually be sold directly back to the UCITS. Brokerage fees may incur. The buying price may exceed, or the selling price may be lower than the current net asset value. Investing in the ETF should be interpreted as acquiring shares of the ETF and not the underlying assets. Tax treatment depends on the personal circumstances of each investor and may vary over time. The ManCo may terminate the marketing of the ETF in one or more jurisdictions. The summary of the investor rights is available in English at: summary-of-investor-rights.pdf.
Please refer to the Prospectus — in English language — and the Key Information Document (“KID”) — in local language — before making any final investment decisions and for full information on risks. These documents can be obtained free of charge at www.vaneck.com, from the ManCo or from the appointed facility agent.
VanEck Junior Gold Miners UCITS ETF (“ETF”) is a sub-fund of VanEck UCITS ETFs plc, a UCITS umbrella investment company, registered with the Central Bank of Ireland, passively managed and tracking an equity index.
The value of the ETF may fluctuate significantly as a result of the investment strategy. The ETF´s holdings are disclosed on each dealing day on www.vaneck.com under the ETF´s Holdings section and as per PCF under the Documents section and published via one or more market data suppliers. The indicative net asset value (iNAV) of the ETF is available on Bloomberg. For details on the regulated markets where the ETF is listed, please refer to the Trading Information section on the ETF page at www.vaneck.com. Investors must buy and sell units of the UCITS on the secondary market via an intermediary (e.g. a broker) and cannot usually be sold directly back to the UCITS. Brokerage fees may incur. The buying price may exceed, or the selling price may be lower than the current net asset value. Investing in the ETF should be interpreted as acquiring shares of the ETF and not the underlying assets. Tax treatment depends on the personal circumstances of each investor and may vary over time. The ManCo may terminate the marketing of the ETF in one or more jurisdictions. The summary of the investor rights is available in English at: summary-of-investor-rights.pdf.
The MarketVector™ Global Gold Miners Index is the exclusive property of MarketVector Indexes GmbH (a wholly owned subsidiary of Van Eck Associates Corporation), which has contracted with Solactive AG to maintain and calculate the Index. Solactive AG uses its best efforts to ensure that the Index is calculated correctly. Irrespective of its obligations towards MarketVector Indexes GmbH (“MarketVector”), Solactive AG has no obligation to point out errors in the Index to third parties. VanEck’s ETF is not sponsored, endorsed, sold or promoted by MarketVector and MarketVector makes no representation regarding the advisability of investing in the ETF. Effective September 19, 2025 the NYSE Arca Gold Miners Index has been replaced with the MarketVector™ Global Gold Miners Index. It is not possible to invest directly in an index.
MVIS® Global Junior Gold Miners Index is the exclusive property of MarketVector Indexes GmbH (a wholly owned subsidiary of Van Eck Associates Corporation), which has contracted with Solactive AG to maintain and calculate the Index. Solactive AG uses its best efforts to ensure that the Index is calculated correctly. Irrespective of its obligations towards MarketVector Indexes GmbH (“MarketVector”), Solactive AG has no obligation to point out errors in the Index to third parties. VanEck’s ETF is not sponsored, endorsed, sold or promoted by MarketVector and MarketVector makes no representation regarding the advisability of investing in the ETF. It is not possible to invest directly in an index.
Source: VanEck. Performance quoted represents past performance. Current performance may be lower or higher than average annual returns shown. Performance data for the Irish domiciled ETFs is displayed on a Net Asset Value basis, in Base Currency terms, with net income reinvested, net of fees. Returns may increase or decrease as a result of currency fluctuations. Performance should be assessed over a medium- to long-term.
Investing is subject to risk, including the possible loss of principal. The value of investments may go down as well as up and investors may not get back the amount originally invested. For any unfamiliar technical terms, please refer to ETF Glossary | VanEck.
No part of this material may be reproduced in any form, or referred to in any other publication, without express written permission of VanEck.
© VanEck (Europe) GmbH ©VanEck Switzerland AG © VanEck Securities UK Limited
This is a marketing communication. Please refer to the prospectus of the UCITS and to the KID before making any final investment decisions.
This information originates from VanEck (Europe) GmbH, which has been appointed as distributor of VanEck products in Europe by the Management Company VanEck Asset Management B.V., incorporated under Dutch law and registered with the Dutch Authority for the Financial Markets (AFM). VanEck (Europe) GmbH with registered address at Kreuznacher Str. 30, 60486 Frankfurt, Germany, is a financial services provider regulated by the Federal Financial Supervisory Authority in Germany (BaFin).
The information is intended only to provide general and preliminary information to investors and shall not be construed as investment, legal or tax advice VanEck (Europe) GmbH, VanEck Switzerland AG, VanEck Securities UK Limited and their associated and affiliated companies (together “VanEck”) assume no liability with regards to any investment, divestment or retention decision taken by the investor on the basis of this information. The views and opinions expressed are those of the author(s) but not necessarily those of VanEck. Opinions are current as of the publication date and are subject to change with market conditions. Certain statements contained herein may constitute projections, forecasts and other forward-looking statements, which do not reflect actual results. Information provided by third party sources is believed to be reliable and have not been independently verified for accuracy or completeness and cannot be guaranteed. Brokerage or transaction fees may apply.
All performance information is based on historical data and does not predict future returns. Investing is subject to risk, including the possible loss of principal.
No part of this material may be reproduced in any form, or referred to in any other publication, without express written permission of VanEck.
© VanEck (Europe) GmbH / VanEck Asset Management B.V.