Why Chinese Yuan Stands Out Among EMFX
05 November 2020
Read Time 3 MIN
We wrote last month about the attractive yield pickup that onshore Chinese bonds currently offer versus U.S. and developed markets fixed income, which is particularly striking given several technical and fundamental tailwinds impacting the asset class. Like many non-U.S. dollar investments, particularly in emerging markets, investors need to consider not only the yield level but also the potential for currency appreciation or depreciation. Local currency emerging markets bonds have historically provided several tactical opportunities to take advantage of bouts of U.S. dollar weakness over the past five years, but overall currency movements have detracted from total return. We believe that the Chinese yuan (CNY), however, should not be grouped into the broad category of emerging markets currencies (EMFX) and has several characteristics that set it apart, potentially making exposure attractive to global bond investors—even those wary of EMFX volatility. These characteristics may also help China’s onshore bonds improve the risk-return profile of broad emerging markets local currency debt allocations.
CNY Has Behaved Differently Vs. Broader EMFX
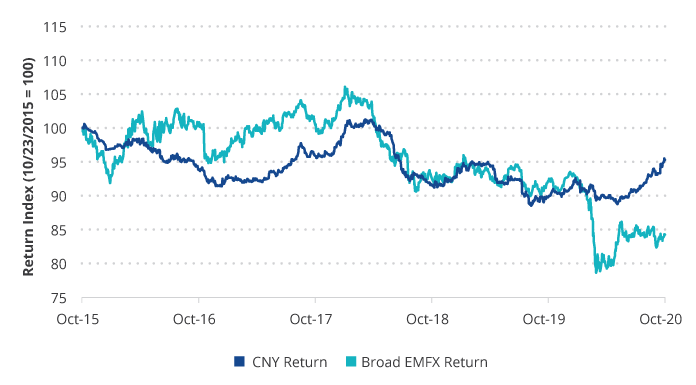
Source: J.P. Morgan and VanEck as of 10/26/2020. Broad EMFX is represented by the foreign currency return of the J.P. Morgan GBI-EM Global Diversified Index.
Looking at the chart above, CNY has been less volatile and displayed greater resiliency than the basket of currencies that represent broad emerging markets exposure. In fact the correlation between the CNY and this basket has been historically low, at only 20%.1 CNY’s value is determined through a managed rate pegged to a basket of currencies, and is only allowed to move within a narrow band on a daily basis. This has reduced the currency’s volatility, but longer term the currency’s value should generally reflect fundamentals. Even with the recent removal of the “countercyclical adjustment,” there are many factors that we believe provide long term support.
Strong and resilient economic growth, particularly this year, has been a key driver of CNY strength relative to the U.S. dollar and in contrast to the weakness experienced by other more vulnerable emerging markets. More broadly, China’s massive economy and role in driving global growth set it apart from other emerging markets. Although no currency can match the U.S. dollar in terms of its role in the global economy, the CNY is growing in importance. It now makes up approximately 2% of foreign exchange reserve assets and that is expected to grow to up to 10% by 2030, according to Morgan Stanley. That will make it the third largest reserve currency, behind the U.S. dollar and euro. As China’s economy continues its transformation into a more consumer led economy that is less dependent on lower value exports, policymakers have also continued the gradual opening of onshore markets to foreign investment. As China’s weight in global bond and equity indices continues to increase, foreign investor flows may provide further support to the CNY. Note in the chart above that, despite the improving fundamental and technical stories, the currency is still 5% weaker versus the U.S. dollar than it was just two-and-a-half years ago.
In the context of a portfolio or index of emerging markets local currency bonds, China’s onshore bonds’ growing weight may act as a stabilizer in future periods of U.S. dollar strength. With less than half the volatility and a low correlation with the broader EMFX universe, CNY exposure can provide valuable diversification benefits and relative stability within a portfolio while also still providing an attractive yield pickup.
1 Source: Bloomberg. Data as of 10/31/20.
Related Insights
Related Insights

11 February 2026
05 December 2025
28 April 2026
The Emerging Markets Debt team just returned from Spring 2026 IMF meetings in Washington, meeting with finance, banking, and political authorities from around the world.
18 December 2025
Get your portfolio ready for 2026 with detailed insights from VanEck’s investment team about the factors driving risk and returns in their respective asset classes.
05 December 2025
EM local-currency bonds offer high real yields, strong 2025 returns, and resilience to shocks, driven by credible policy and solid fundamentals.
04 December 2025
EM high yield has extended its 2025 momentum, delivering strong carry and compelling yields. With higher credit quality and lower defaults, the segment offers a more attractive risk profile than US high yield.
28 October 2025
The EM Debt team just returned from the Fall IMF Annual Meeting, here are their takeaways.