Dollar Weakness Helps Gold To All-Time Highs
06 August 2020
Read Time 6 MIN
Gold Passes Two Important Sign-Posts
The gold bull market passed two important sign-posts in July. The strength of the market is impressive as it blew through $1,800 and the all-time high of $1,921. These prices had been major technical resistance points set a decade ago.
The second significant signpost in July was the new U.S. dollar weakness. U.S. dollar weakness is a hallmark of most gold bull markets, but in this cycle gold had so far been rising in a flat dollar environment. The chart below shows the U.S. dollar index (DXY)1 has been in a bull market since 2011. However, the dollar declined through July, then fell precipitously at the end of the month, appearing to have broken its long-term trend. We may be seeing the beginnings of a bear market for the dollar. This enabled gold to test the $2,000 per ounce milestone as it reached an intraday high of $1,983 on July 31. Gold closed out July at $1,975.86 per ounce for a $194.90 (10.9%) monthly gain.
U.S. Dollar Index Breaking Its Near 10-Year Support Trend (2011 to 2020)?
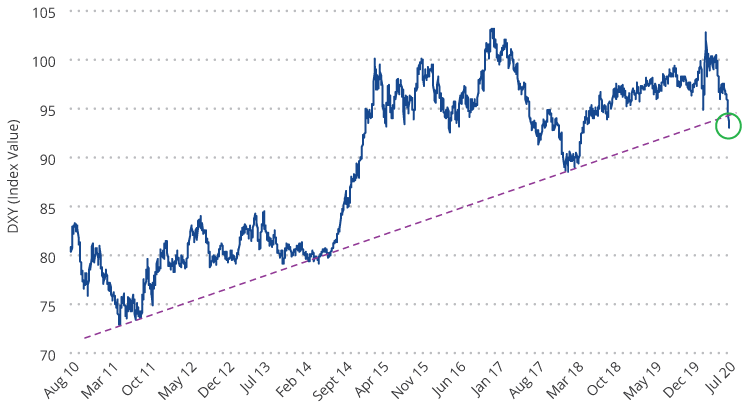
Source: VanEck, Bloomberg. Data as of July 31, 2020. Past performance is not a guarantee of future results.
Gold Miners Remain Well Positioned (Especially Junior Developers)
Gold stocks moved higher as the vast majority of companies reporting second quarter results met or exceeded expectations. COVID-related costs were also reported, showing the industry has done an excellent job of dealing with operational issues in our view. For example, 1.7 million ounce producer Agnico-Eagle (approximately 4.7% of net assets as of end-July) was among those hardest hit by pandemic lock downs. Its costs for temporary mine suspensions totaled $22 million, whereas the cash provided from operations totaled $162 million. Going forward, per the company’s second quarter 2020 financial results, Agnico-Eagle expects COVID protocols to cost $6 per ounce, which raises their cash costs by less than 1%. For the month, the NYSE Gold Miners Index (GDMNTR)2 gained 14.4%, while the MVIS Global Junior Gold Miners Index (MVGDXJTR)3 advanced 19.8%.
Junior developers are a class of company that you won’t find much of in passive index funds like GDX or GDXJ. These are companies with properties that are in various stages of development, but not yet producing gold. Our active gold equity strategy invests across the spectrum of companies and currently carries 22 junior developers that total approximately 26% of the strategy’s net assets as of end-July. These companies had been underperforming since the gold price broke out in June 2019. This is a sharp contrast from past bull markets, when the juniors began outperforming the larger companies much earlier. Through the second quarter and into July, the junior developers have finally kicked into gear. Seven of our juniors have now gained over 100% year to date. We don’t expect to give back these gains because the stocks had been extremely undervalued and many of our companies have announced encouraging drill results and new discoveries that create lasting value. In addition, investors have returned to the junior sector, enabling companies to raise $1.5 billion this year, and the second quarter was their strongest for equity raises since 2012, according to RBC Capital Markets.
$2,000 Gold Is About More Than Just The Pandemic
Gold has tested the $2,000 per ounce level sooner than we had anticipated and we believe there is more than the pandemic to overcome at this point.
- Slower Recovery – During July, two Federal Reserve (Fed) presidents, a Fed governor, and its Chairman all warned of a long, slow road to economic recovery. Initial jobless claims have stagnated for eight weeks at around 1.4 to 1.5 million. Contrast this with the Global Financial Crisis (GFC), where initial jobless claims declined steadily to 587,000 in the same time frame, seventeen weeks after the recession peak. JPMorgan said it was preparing for an unemployment rate that remains in double digits well into next year and a slower recovery in gross domestic product (GDP) than the bank’s economists assumed three months ago.
- Deficits, Debt & Defaults – The U.S. budget deficit totaled $863 billion in June, as much as the entire gap in 2019. With the new stimulus bill now being considered in Congress, the annual deficit could exceed $4.7 trillion. This is on top of record peace-time deficits before the pandemic.
Corporate debt is also at record levels and many households are feeling financial stress. Ultra low interest rates over the past two decades have encouraged the accumulation of unproductive government and private debt. It fuels the rise of giant firms, while “zombie” companies (companies with earnings less than their debt service costs) have proliferated. This is at the expense of start-ups, innovation and creative destruction. The result is low levels of productivity, causing recoveries to become weaker and weaker. The Wall Street Journal reports the largest U.S. banks have set aside $28 billion to cover losses as consumers and businesses start to default on their loans.
What Could Drive Gold Prices Even Higher?
The pandemic created a deflationary shock to the economy and the massive accumulation of debt since the GFC creates a drag on productivity that could guarantee a low growth economy for decades to come. Negative real rates, persistent risks to economic well-being, and the weak dollar are drivers that we believe could enable gold to trend to $3,400 per ounce in the coming years. This might be a conservative forecast considering the 180% rise gold experienced from the depths of the GFC (see our gold price projection here). Several scenarios could see gold prices moving higher from there:
- Systemic collapse as debt issuance overwhelms the financial markets.
- An inflationary cycle brought on by either: a) trillions of U.S. dollars, euros, yen and yuan being pumped into the global financial system, b) governments enabling inflation to ease the debt burden, c) implementation of modern monetary theory or other forms of money printing to fund government spending without issuing debt.
- U.S. Dollar Crisis – America is dealing with deficits, divisive politics, social unrest and deteriorating international relations on a scale rarely seen in history. While other countries may have similar problems, they do not oversee the world’s reserve currency. The U.S. is held to a higher standard and a crisis of confidence could weigh heavily on the dollar.
Some might balk at such bold forecasts, however, we believe the various drivers of gold are rarely aligned as they are today. We also consider gold’s relative size in the financial markets. There have been 200,000 tonnes of gold mined in the history of the world and virtually all of it is potentially available to the market. A gold price of $2,000 per ounce yields a market value of $12.9 trillion. Compare this with global stock, bond and currency markets, each of which totals roughly $100 trillion or more. A relatively small shift in funds from these markets may fuel the gold price for a long time.
In addition, the market value of the global gold industry as of end-July is approximately $530 billion. The market value of Alphabet Inc. as of the same time, alone, is $1.0 trillion. Gold mining is a relatively tiny sector that, in addition to carrying earnings leverage to the gold price, carries a scarcity factor when market demand is high.
Related Insights
Related Insights
29 April 2026
05 June 2026
Gold mining stocks posted gains in May even as the gold price dipped, yet generalist investors remain largely absent from the sector despite record margins and strong balance sheets.
18 May 2026
From America’s founding to GDX’s 20th anniversary, gold has remained a constant store of value, and VanEck has helped investors access it for nearly 60 years.
11 May 2026
Global gold demand rose 2% YoY in Q1 2026 driven by central bank buying and bar and coin purchases. Newmont and Agnico Eagle posted record earnings despite low valuations.
08 April 2026
Gold pulled back amid rising rates and a stronger dollar, but history shows volatility is typical in crises. Strong margins leave miners well positioned if gold stabilizes or moves higher.
10 March 2026
Gold miners are generating record margins and free cash flow as prices remain elevated. With disciplined capital allocation and costs below $2,000 per ounce, the sector appears well positioned for 2026.