Fallen Angels Reclaim the YTD Lead as 2026 New Entrants Deliver
14 July 2026
Read Time 10 MIN
Key Takeaways:
- Fallen angels outperformed broad high yield by 1.23% in Q2 2026 (3.69% vs. 2.46%), recovering the YTD lead to +0.44%.
- Paramount and FS KRR contribute to strong Q2 performance.
- Fallen angel yields of 6.72%* remain above 1-, 5-, and 10-year historical averages.
* Index yield to worst.
Fallen angels outperformed the broad high yield market by 1.23% in Q2 2026 (3.69% vs. 2.46%), putting the YTD return ahead by 0.44% (2.33% vs. 1.89%). April and June did the work. April was a strong month for the entire credit market, with both indices posting their best gains since June 2025 as a Middle East resolution was priced in and spreads recovered sharply from March. Fallen angels still outpaced, returning 2.48% vs. 1.70%. June added +0.45% (0.69% vs 0.25%) as the continued de-escalation around the Strait of Hormuz, better-than-expected macro data, declining oil prices and a more hawkish-than-anticipated Fed all combined to push credit tighter. With spreads within 11bps of the year’s tightest level and new fallen angels already adding value, the forward setup continues to rest on carry and price appreciation.
2026 Year-to-Date Total Return
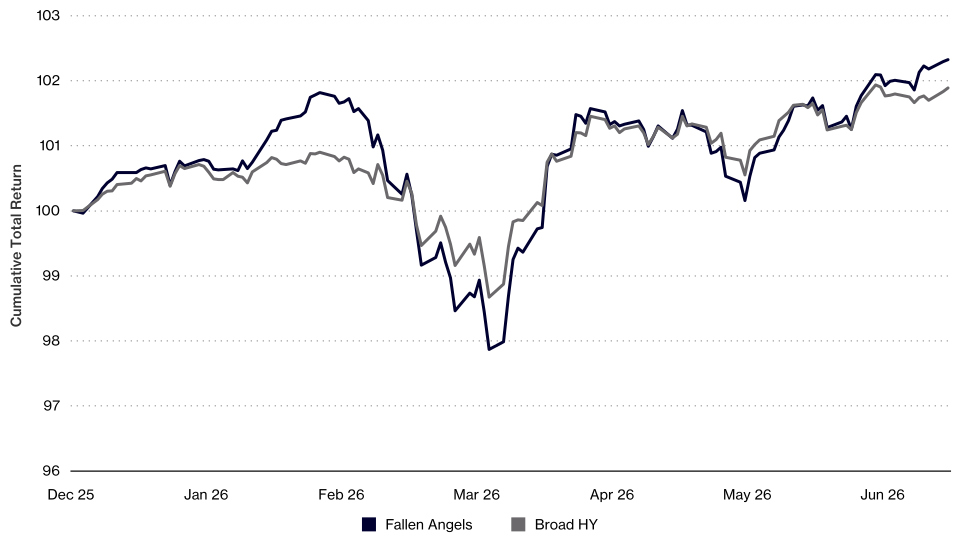
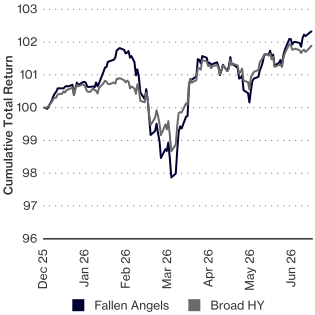
Source: ICE Data Services, VanEck. Fallen Angels: ICE US Fallen Angel High Yield 10% Constrained Index.; Broad HY: ICE BofA US High Yield Index. Past performance is no guarantee of future results. Index performance is not representative of strategy performance. It is not possible to invest directly in an index.
The price gap between fallen angels at $91.68 and broad high yield at $97.11 remains above $5, a level that has historically been associated with approximately 1% outperformance over subsequent 12-month periods and 2-3% over subsequent three-year periods. Spreads tightened back to 237bps by quarter-end but the risk-free rate still accounts for roughly 65% of total yield, meaning Treasury moves dominate near-term total returns. Paramount’s bonds, which entered below $80 in March, have begun their recovery and remain the single largest contributor to outperformance. FS KKR followed closely behind.
Notable Contributors to Outperformance
| Q2 2026 | Contribution to Outperformance (%) | 3 Month Price Return (%) |
| Total | 1.23 | 2.15 |
| Paramount | 0.51 | 3.75 |
| FS KRR | 0.18 | 2.09 |
Source: ICE Data Services, VanEck. As of June 30, 2026. Past performance is no guarantee of future results.
More supply may be coming. J.P. Morgan forecast $88bn of index-eligible fallen angels in 2026/2027 against only $28bn of rising stars, and Goldman Sachs puts 2026 fallen angels at $60bn. New fallen angels have historically been a key driver of fallen angel outperformance in the years following an active downgrade cycle. Downside risks are macro deterioration that could lead to wider spreads and continued rate volatility in either direction. Lower rates would reduce yield demand, but drive price appreciation, while sharply higher rates pressure total returns given the longer duration profile of fallen angels (4.55 years vs. 3.01 years for broad high yield).
Fallen Angels Overall Statistics:
After widening in March, credit spreads tightened sharply in Q2 driven by the de-escalation of the geopolitical tensions in the Middle East. Fallen angel spreads compressed 68bps in Q2 (from 305bps to 237bps) while broad high yield tightened 53bps (from 328bps to 275bps). The tightening in fallen angels was most pronounced in April, a reversal of March, as fallen angels tightened 54bps vs. 45bps for broad high yield, with both indices closing the quarter tighter than they began the year.
The yield decline mirrored spreads, with fallen angels ending Q2 at 6.72%, down from the 7.18% March peak, with broad high yield at 7.15%. Despite the move lower, the fallen angel yield at 6.72% remains above the 1-year, 5-year, and 10-year averages and sits at approximately the 50th percentile since December 2003. The spread component, at 237bps, is in the 6th percentile, while the risk-free component now accounts for roughly 65% of total yield. When rates dominate yield composition, as they have over the past few years, Treasury yield movements are an important driver of total returns.
Fallen angels’ par-weighted price increased $1.93 in Q2 (from $89.75 to $91.68) vs. $0.93 for broad high yield (from $96.18 to $97.11), and price return accounted for 2.15% of fallen angels’ 3.69% quarterly return vs. 0.76% for broad high yield. Duration ticked down marginally for both indices during Q2 (fallen angels from 4.62 to 4.55 years, broad high yield from 3.13 to 3.01 years) but the 1.54-year duration differential was not a meaningful driver of relative performance despite the 10-year Treasury yield rising approximately 14bps in the quarter.
| Fallen Angels | Broad HY | |||||
| 12/31/2025 | 3/31/2026 | 6/30/2026 | 12/31/2025 | 3/31/2026 | 6/30/2026 | |
| Yield to Worst | 6.36 | 7.18 | 6.72 | 6.63 | 7.44 | 7.15 |
| Par Weighted Price | 93.95 | 89.75 | 91.68 | 98.06 | 96.18 | 97.11 |
| Effective Duration | 4.60 | 4.62 | 4.55 | 2.87 | 3.13 | 3.01 |
| Full Market Value ($mn) | 56,444 | 66,210 | 66,811 | 1,474,918 | 1,440,567 | 1,486,068 |
| OAS | 245 | 305 | 237 | 281 | 328 | 275 |
| No. of Issues | 113 | 132 | 130 | 1,922 | 1,893 | 1,899 |
Source: ICE Data Services, VanEck. Fallen Angels: ICE US Fallen Angel High Yield 10% Constrained Index. Broad HY: ICE BofA US High Yield Index. OAS refers to “option-adjusted spread.” Please see definition for this and other terms referenced herein in the disclosures and definitions portion of this blog. Past performance is no guarantee of future results. Index performance is not representative of strategy performance. It is not possible to invest in an index.
Fallen Angels: No fallen angels in Q2 2026.
Revisit Q1 2026 Fallen Angels
| Month-end Addition | Name | Rating | Sector | Industry | % Mkt Value | Price |
| January | SES S.A. | BB1 | Telecommunications | Telecom - Satellite | 1.12 | 79.74 |
| March | FS KKR Capital Corp | BB1 | Financial Services | Investments & Misc Financial Services | 5.23 | 95.56 |
| March | Paramount Global | BB1 | Media | Media Content | 10.03 | 78.19 |
Source: ICE Data Services, VanEck. As of June 30, 2026.
Rising Stars: No rising stars in Q2 2026.
Revisit Q1 2026 Rising Stars
| Month-end Exit | Name | Rating | Sector | Industry | % Mkt Value | Price |
| January | Frontier Florida LLC | BB1 | Telecommunications | Telecom - Wireline Integrated & Services | 0.56 | 103.50 |
Source: ICE Data Services, VanEck. Fallen Angels: ICE US Fallen Angel High Yield 10% Constrained Index. Past performance is no guarantee of future results. Not a recommendation to buy or sell any of the names/securities mentioned herein. Index performance is not representative of strategy performance. It is not possible to invest in an index.
Fallen Angels Performance by Sector: With no fallen angels or rising stars in Q2, sector composition was largely unchanged. Leisure and Retail each saw modest exposure reductions as individual bonds reached the 12-month maturity threshold and were removed from the index.
After widening 60bps in Q1, fallen angel spreads tightened 68bps in Q2 across virtually every sector. Real Estate led the recovery (spreads tightened 174bps in Q2), followed by Healthcare (131bps) and Financial Services (113bps). Consumer Goods was the only sector to post a negative total return in Q2 (-1.13%), with spreads widening 55bps and its price declining to $79.82, the weakest price in the index. Healthcare (7.12%), Retail (5.58%), and Leisure (5.29%) were the top-performing sectors in Q2.
In terms of relative performance vs. broad high yield, Retail was the top contributor in Q2. The sector carried an approximately 11.6% weight in the fallen angel index vs. 5.6% in broad high yield, and its 5.58% total return compounded the advantage. Media was the second-largest contributor as Paramount’s bonds rallied from their March entry price of $78.19 toward $81.19 by June-end — a 3.7% move that, at an approximate 10% index weight, was meaningful. Real Estate, Basic Industry, and Autos also contributed positively given overweight positions relative to broad high yield. The combined weight of these five overweight sectors was approximately 57% in the fallen angel index vs. 31% in broad high yield at June month-end, amplifying the performance differential when these sectors outperform. The absence of Services exposure, a sector with roughly 6.3% weight in broad high yield and a positive return in Q2, was the primary detractor to relative performance in Q2. On a YTD basis, Media (+4.53%), Basic Industry (+4.15%), Real Estate (+4.50%), and Technology (+4.06%) have been the top contributors to outperformance.
| Wgt (%) | OAS | Price | Total Return | ||||||||
| 2025 | 2026 | 2025 | 2026 | 2025 | 2026 | ||||||
| 12/31 | 3/31 | 6/30 | 12/31 | 3/31 | 6/30 | 12/31 | 3/31 | 6/30 | QTD | YTD | |
| Automotive | 10.94 | 10.79 | 10.82 | 199 | 273 | 192 | 97.72 | 95.38 | 96.91 | 2.84 | 1.72 |
| Banking | 2.01 | 1.76 | 1.73 | 143 | 173 | 118 | 109.70 | 107.16 | 107.42 | 2.10 | 1.58 |
| Basic Industry | 19.10 | 16.35 | 16.54 | 210 | 219 | 169 | 96.90 | 96.41 | 97.91 | 3.08 | 4.15 |
| Capital Goods | 2.37 | 1.96 | 2.03 | 197 | 278 | 213 | 96.95 | 90.98 | 94.14 | 5.15 | 0.39 |
| Consumer Goods | 6.81 | 5.66 | 5.54 | 279 | 343 | 398 | 86.52 | 82.08 | 79.82 | (1.13) | (4.70) |
| Energy | 7.84 | 6.94 | 6.98 | 239 | 228 | 190 | 95.99 | 96.16 | 96.96 | 2.34 | 4.06 |
| Financial Services | 2.08 | 6.91 | 7.12 | 347 | 377 | 264 | 93.18 | 92.95 | 95.61 | 4.18 | (2.69) |
| Healthcare | 2.50 | 2.07 | 2.15 | 195 | 322 | 191 | 96.29 | 88.89 | 93.96 | 7.12 | 0.43 |
| Insurance | 0.73 | 0.64 | 0.62 | 245 | 306 | 308 | 99.06 | 95.93 | 95.11 | 0.63 | (1.03) |
| Leisure | 2.94 | 2.53 | 1.95 | 390 | 502 | 447 | 90.67 | 87.85 | 88.60 | 5.29 | 3.46 |
| Media | 0.45 | 10.41 | 10.37 | 411 | 353 | 301 | 82.30 | 78.28 | 81.19 | 5.17 | 4.53 |
| Real Estate | 9.21 | 7.28 | 7.61 | 300 | 392 | 218 | 94.01 | 91.91 | 95.47 | 5.10 | 4.50 |
| Retail Services | 14.82 | 11.89 | 11.55 | 217 | 276 | 191 | 91.07 | 87.00 | 90.16 | 5.58 | 2.64 |
| Technology & Electronics | 3.29 | 2.86 | 2.93 | 301 | 331 | 292 | 80.72 | 78.64 | 81.51 | 5.18 | 4.06 |
| Telecommunications | 11.43 | 9.05 | 9.01 | 299 | 372 | 319 | 92.94 | 86.70 | 87.10 | 2.44 | 0.79 |
| Transportation | 0.59 | 0.51 | 0.51 | 169 | 213 | 149 | 106.50 | 102.47 | 105.55 | 4.55 | 2.17 |
| Utility | 2.91 | 2.42 | 2.53 | 208 | 272 | 206 | 100.76 | 96.23 | 99.36 | 4.88 | 1.88 |
| Grand Total | 100 | 100 | 100 | 245 | 305 | 237 | 93.95 | 89.75 | 91.68 | 3.69 | 2.33 |
Source: ICE Data Services, VanEck. Returns are based on partial period data. Fallen Angels: ICE US Fallen Angel High Yield 10% Constrained Index. Not intended as a recommendation to invest or divest in any of the sectors mentioned herein. Index performance is not representative of strategy performance. It is not possible to invest in an index.
Fallen Angels Performance by Rating: BB-rated bonds continue to dominate the fallen angel index at 83.3% of market value at June end, down slightly from 88.5% at the start of Q2 as the rating composition shifted on the margin. Single-B exposure increased to 13.1% (from 7.4% at Q1 end), with Whirlpool among the larger names downgraded to single-B during the quarter. CCCs declined to 3.0% (from 4.5%) as Transocean International was upgraded from CCC to single-B. Single-B bonds were the strongest performer in Q2 at 10.68%, while CCC-rated bonds, now just three issuers, posted 4.38% in Q2 and lead all rating buckets YTD at 9.06%. Fallen angels’ approximately 83% BB weighting has been a tailwind in 2026, as BB-rated bonds have outperformed lower-rated credit across the high yield market. The B/BB spread differential widened to near the upper end of its historical range during Q2, reflecting broader quality rotation within the asset class.
| Wgt (%) | OAS | Price | Total Return | ||||||||
| 2025 | 2026 | 2025 | 2026 | 2025 | 2026 | ||||||
| 12/31 | 3/31 | 6/30 | 12/31 | 3/31 | 6/30 | 12/31 | 3/31 | 6/30 | QTD | YTD | |
| BB | 85.57 | 88.48 | 83.27 | 201 | 268 | 199 | 96.56 | 91.68 | 94.33 | 3.15 | 1.86 |
| B | 7.21 | 6.38 | 13.12 | 358 | 483 | 329 | 90.48 | 85.67 | 87.49 | 10.68 | 6.07 |
| CCC | 6.30 | 4.47 | 3.04 | 471 | 447 | 410 | 82.76 | 82.32 | 79.66 | 4.38 | 9.06 |
| CC | 0.93 | 0.67 | 0.57 | 1,920 | 2,523 | 2,801 | 41.00 | 31.57 | 28.50 | (2.29) | (19.88) |
| Total | 100 | 100 | 100 | 245 | 305 | 237 | 93.95 | 89.75 | 91.68 | 3.69 | 2.33 |
Source: ICE Data Services, VanEck. Fallen Angels: Fallen Angel High Yield 10% Constrained Index. Not intended as a recommendation to invest or divest in any of the sectors mentioned herein. Index performance is not representative of strategy performance. It is not possible to invest in an index. BB index: ICE BofA BB US High Yield Index; Single-B index: ICE BofA Single-B US High Yield Index; CCC & Lower rated index ICE BofA CCC & Lower US High Yield Index.
ICE BofA US High Yield Index (H0A0, “Broad HY Index”), formerly known as BofA Merrill Lynch US High Yield Index prior to 10/23/2017, is comprised of below-investment grade corporate bonds (based on an average of various rating agencies) denominated in U.S. dollars.
ICE US Fallen Angel High Yield 10% Constrained Index (H0CF, “Fallen Angel Index”) is a subset of the ICE BofA US High Yield Index and includes securities that were rated investment grade at time of issuance.
ICE BofA US High Yield (BB): ICE BofA US High Yield (BB) Index is comprised of below-investment grade corporate bonds with BB ratings (based on an average of various rating agencies) denominated in U.S. dollars. The country of risk of qualifying issuers must be an FX-G10 member, a Western European nation, or a territory of the U.S. or a Western European nation.
ICE BofA US High Yield (Single-B): ICE BofA US High Yield (Single-B) Index is comprised of below-investment grade corporate bonds with single-B ratings (based on an average of various rating agencies) denominated in U.S. dollars. The country of risk of qualifying issuers must be an FX-G10 member, a Western European nation, or a territory of the U.S. or a Western European nation.
ICE BofA US High Yield (CCC & Lower): ICE BofA US High Yield (CCC & Lower) Index is comprised of below-investment grade corporate bonds with ratings of CCC or below (based on an average of various rating agencies) denominated in U.S. dollars. The country of risk of qualifying issuers must be an FX-G10 member, a Western European nation, or a territory of the U.S. or a Western European nation.
Related Insights


Related Insights

11 August 2026
Many investors need more than traditional bonds can deliver. VanEck provides access to a range of higher-yielding asset classes built for today's income environment.
02 July 2026
The discount of XMPT's underlying muni CEFs has been a historically reliable entry signal. Wide discounts have historically preceded strong returns. Tight readings may suggest waiting for the next shock.
16 June 2026
Publicly traded BDCs offer 12.6% yields and stable credit quality, a very different story than the private credit headlines suggest.
13 April 2026
Q1 2026 threw a lot at investors: geopolitical tension, rate volatility, and macro uncertainty. Here’s why municipal bonds held up, and why the setup heading into Q2 may be even more compelling.