Can Wells Fargo, Boeing and Biogen Add Value?
08 October 2020
Read Time 7 MIN
I’ve written frequently about market valuation in recent months, and for good reason. It’s no secret that a small number of stocks have accounted for a disproportionate amount of the market’s return. More and more U.S. stock investors are facing a difficult decision: do you stay on benchmark and seek little or no alpha, or do you underweight mega-cap, big tech stocks in favor of other potential opportunities in the market?
The risk of allocating to off-benchmark exposure has rewarded far fewer than it has punished over time, particularly in large cap U.S. stocks where the market is arguably most efficient. S&P Dow Jones Indices recently released their SPIVA® (S&P Indices Versus Active) results for Q2 2020 and found that for the trailing five years, far more actively managed U.S. large cap funds underperformed the S&P 500 Index than outperformed. Through June 30, 2020, 78% of funds underperformed for the five-year trailing period, 71% underperformed for the three-year trailing period, and 63% of funds underperformed for the one-year trailing period. That last stat is notable because well over half of active large cap funds failed to outperform the S&P 500 Index in a period that included significant market volatility, an environment where active management supposedly has the upper hand.
For the one-, three-, and five-year period cited in the SPIVA report, the Morningstar® Wide Moat Focus IndexSM (the “Index”) outperformed the S&P 500 Index, though there has been underperformance in the last three months driven by stock selection in several sectors, most notably industrials and tech.
Average Annualized Return (%)
As of June 30, 2020
| 1 Year | 3 Year | 5 Year | |
| Morningstar Wide Moat Focus Index | 10.49 | 11.78 | 13.47 |
| S&P 500 Index | 7.51 | 10.73 | 10.72 |
As of September 30, 2020
| 3 Month | 1 Year | 3 Year | 5 Year | |
| Morningstar Wide Moat Focus Index | 4.64 | 10.73 | 12.67 | 16.60 |
| S&P 500 Index | 8.93 | 15.15 | 12.28 | 14.14 |
Source: Morningstar. Returns for periods over one year have been annualized. Past performance is no guarantee of future results. An investor cannot invest directly in an index.
Impact of Moats and Valuations
Despite near-term headwinds, Morningstar’s valuation-driven investment philosophy has delivered outperformance versus the broad market since its inception in February 2007. Morningstar strategist, Andrew Lane, recently published a paper examining the impact of the Index’s three primary methodology features: economic moats, equal weighting and valuations. Over its history, each of these three features has incrementally improved the Index’s annualized outperformance.
First, and not uncommon in the market, the Index applies an equal-weighted approach, which allows each Index constituent to contribute to its total return as opposed to those indexes that favor larger, more liquid companies. Next, and more difficult to replicate, is Morningstar’s proprietary economic moat ratings and fair value assessments. Companies that receive Morningstar’s wide economic moat rating are members of an exclusive club that possess competitive advantages that Morningstar believes will allow them to maintain returns on invested capital in excess of their weighted average cost of capital for 20 or more years into the future.
However, Morningstar doesn’t necessarily view economic moat ratings as predictive of performance. Because wide moat companies are widely sought by investors, they tend to trade at higher multiples and are often difficult to find “on sale,” as Lane puts it. This is where Morningstar’s valuation framework comes in: the Index targets those wide moat companies trading at attractive valuations. This combination of equal weighting, wide economic moat ratings and attractive valuations is what has driven excess returns throughout the Index’s history.
Long-Term Outperformance vs Broad U.S. Market Driven by Moats, Valuations and Equal Weighting
Annualized Total Return 2/14/2007 – 9/30/2020
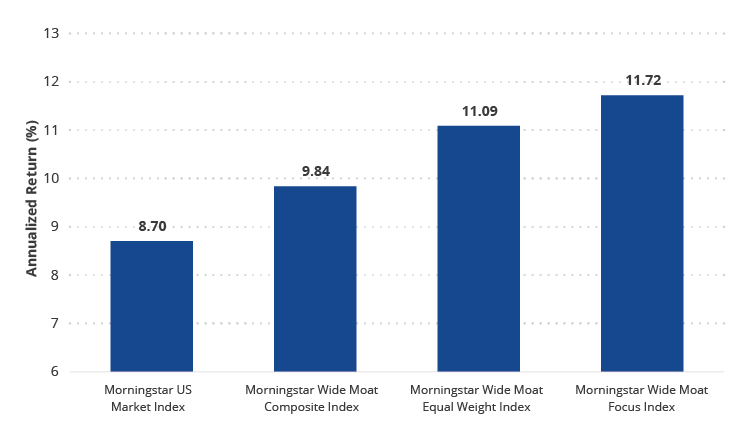
Source: Morningstar. Morningstar Wide Moat Focus Index inception date is 2/14/2007. Morningstar US Market Index represents 97% of US stock market capitalization. Morningstar Wide Moat Composite Index is a market-capitalization weighted index of all US wide moat companies. Morningstar Wide Moat Equal Weight Index is an equal-weighted index of all US wide moat companies. An investor cannot invest directly in an index.
Top Valuation Opportunities
With valuations top of mind, it’s worth highlighting a few of the most undervalued stocks in the Index. If Morningstar’s conviction is rewarded by way of the market realizing its current mispricing and stock prices rising toward fair value, the Index will benefit.
Wells Fargo & Co. (WFC): 48% Discount to Fair Value
Wells Fargo is a great example of a long-time index constituent that hasn’t been removed or seen its position scaled back in years. It was added in June 2016 and has remained since. This points to the persistent relative attractiveness of its market price relative to its Morningstar-assigned fair value. It is also one of the more commonly cited companies in questions we receive here at VanEck from investors and prospective investors. The bank has been subject to years of negative headlines, but according to Morningstar, it remains one of the top deposit gatherers in the U.S. The bank has easily out-earned its cost of equity for decades and continues to do so today, and Morningstar considers its wide moat rating to be stable.
Wells Fargo earns its wide moat rating based on cost advantages and switching costs. Morningstar cites the bank’s size and leading market share in many business units in which it competes. It has the largest retail branch network in the U.S., aiding its deposit gathering success. Its cost advantages stem from a low-cost deposit base, excellent operating efficiency and conservative underwriting. Notably, Wells Fargo fared better than many of its peers during the global financial crisis.
As of October 2, 2020, Wells Fargo was trading at a 48% discount to its $46 per share fair value estimate, assigned by Morningstar. This is despite a decrease in the bank’s fair value from $50 per share in mid July 2020, following earnings results and factoring a 50% chance of a Biden victory in November and implementation of his proposed tax plan. Morningstar believes the bank will face short- and mid-term headwinds by way of long-term low interest rates, fee income pressures, and potential increases in pandemic-driven credit losses. However, it also believes the bank will focus heavily on cutting expenses in 2021 and 2022, warranting its fair value assessment.
Boeing Co. (BA): 37% Discount to Fair Value
Boeing has also generated its fair share of headlines in recent months. It was a notable addition to the Index in March when it was trading at an all-time low of approximately 70% discount to its Morningstar fair value estimate. The aerospace and defense firm saw its Index weight increased in June because it remained attractively priced at the time.
As of October 2, 2020, Boeing traded at a 37% discount to its $264 per share Morningstar fair value estimate. Its fair value reflects an assumption by Morningstar that Boeing will receive an updated airworthiness directive from the FAA for its 737 MAX model early in the fourth quarter of 2020. The harder variable to predict is the impact the global pandemic will have on commercial airlines. Morningstar believes severe near-term decline in revenue will be followed by a sharp rebound in air traffic after a COVID-19 vaccine is available and well-distributed by mid-2021.
Due to the grounding of the 737 MAX, a demand backlog exists. Morningstar believes an industry shift toward narrow body aircrafts (737 MAX is a narrow body aircraft) will increase in the near term as wide-body aircraft demand recovers more slowly because of their use in longer haul trips, which will require a reliable vaccine before returning to pre-pandemic levels.
Biogen Inc. (BIIB): 29% Discount to Fair Value
Biogen has been an Index constituent since December 2015, though its weighting has scaled down and back up at various times based on changing valuation dynamics. Its current discount isn’t its lowest historically, but it is currently quite undervalued according to Morningstar.
Biogen earns a wide moat rating from its specialty-market-focused portfolio and novel, neurology-focused pipeline. Its leadership in multiple sclerosis (MS) and neurodegenerative diseases paired with its oncology collaboration with Roche have driven returns on invested capital above its cost of capital, and Morningstar forecasts they will remain well above for at least another 10 years.
Biogen’s fair value estimate was decreased in June from $413 per share to $389 per share, reflecting Morningstar’s Tecfidera (MS treatment) forecast paired with increases to expected generic competition following industry litigation. Much of Biogen’s fair value estimate is predicated on pipeline approvals in various segments, some of which are currently expected to be delayed based on recent coronavirus-related treatment delays.
Related Insights

Related Insights

09 July 2026
As mega-cap tech pulled back in June, the Moat Index gained on semiconductor and cybersecurity strength and the SMID Moat Index rose on AI chips and a notable health care deal.
09 June 2026
Software and cybersecurity earnings showed that AI is broadening demand for enterprise tech, not eroding it, as Moat Indexes rebounded late in the month.
08 May 2026
Tech and semiconductor stocks led April’s rebound. Moat stocks participated in the rally though narrow leadership favoring mega-cap growth weighed on relative performance.
10 April 2026
U.S. equities fell in March as oil surged on geopolitical tensions. The Moat Index lagged on no energy exposure, while the SMID Moat Index held up with help from energy and materials.
30 March 2026
The Moat Index added NVIDIA, Broadcom and new names following its quarterly review, as tech dislocations created opportunity, while maintaining a value tilt and notable discount to fair value.