Moat Index Review: Value Is In, Facebook Is Out
23 September 2020
Read Time 4 MIN
The Morningstar® Wide Moat Focus IndexSM (the “Index”) completed its quarterly review on Friday, September 18, 2020. The first quarter and second quarter reviews saw more significant changes to the index, as its process of identifying attractively priced wide moat companies was more noteworthy during and following the market turbulence of earlier this year. Notable in this quarter’s review is the continuation of several of the key trends of the year. Here are our main takeaways from the latest rebalance.
Unfriended: Facebook Removed from Moat Index
The Index’s shift from big tech formally began in June and took one step further last week as Facebook (FB) was removed from the Index. Facebook’s stock price premium to Morningstar’s assessment of its fair value signaled an opportunity to lock in gains relative to other opportunities in the wide moat universe.
Facebook has notably been an index member off and on since its IPO in May 2012 and has a track record of supporting Index returns during those periods. With the volatility big tech has faced in recent weeks, time will tell if Facebook rejoins the Index in the future. For now, the only big tech names in the Index remain Amazon (AMZN) and Microsoft (MSFT), which together account for just over 2% weighting at present. This compares to a combined weighting of more than 22% in the S&P 500 Index for Facebook, Apple, Amazon, Netflix, Google and Microsoft. The steady increase in stock prices for many of these stocks recently is bringing them at or above fair value, according to Morningstar, and there simply remain too many other attractively valued opportunities in the U.S. wide moat universe.
Modest Sector Shifts
Despite the removal of Facebook, the tech sector saw a slight increase in weight following the September review. Health care, a long-time overweight, also saw a slight increase in its exposure, while those gains resulted in similar reductions to communications services, consumer discretionary and financials.
Five Sectors Account for Minor Repositioning of Moat Index
As of 9/21/2020
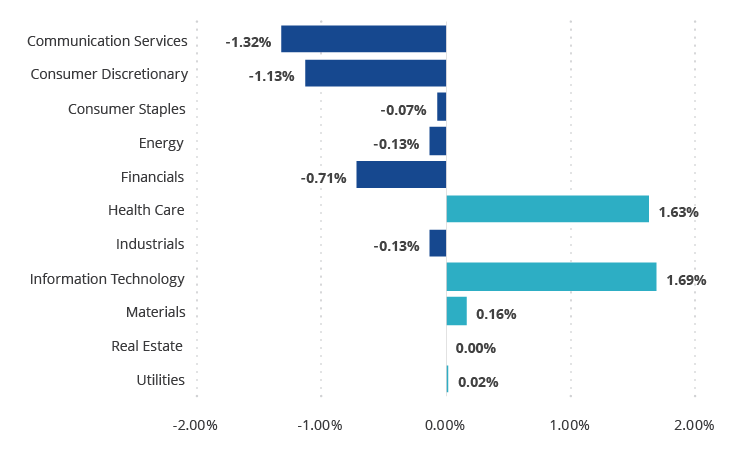
Source: Morningstar. Changes in sector weightings from 9/18/2020 to 9/21/2020 displayed above.
The decreases in consumer discretionary and communications services are logical to see as they are two of the top performing sectors in the U.S. market in 2020. Tech is far and away the top performing sector in the market this year, yet interestingly, the Index’s tech exposure increased modestly. This is due mainly to an increase in semiconductor exposure, which has underperformed the broader tech sector this year. Applied Materials (AMAT) saw its position increased during the review and new entrant Lam Research Corp. (LRCX) was added following a recent economic moat rating upgrade from narrow to wide moat earlier this year. Cost advantages and intangible assets drive LRCX’s wide economic moat, according to Morningstar. Its research and development cost advantages over smaller peers and intangible assets related to equipment design from service contracts and customer collaboration leave LRCX well-positioned relative to competition in the chip manufacturing industry. It is an industry leader in the dry etch process and a prominent player in the deposition segment. Both of these processes combined are critical to chip fabricating.
Nike (NKE) and Facebook (FB) drove the consumer discretionary and communication services sector weighting lower as they both became too rich to remain in the Index. Over and underweights relative to the S&P 500 Index that have been in place for much of the year remain.
Financials and Health Care Remain Top Overweights in Moat Index
As of 9/21/2020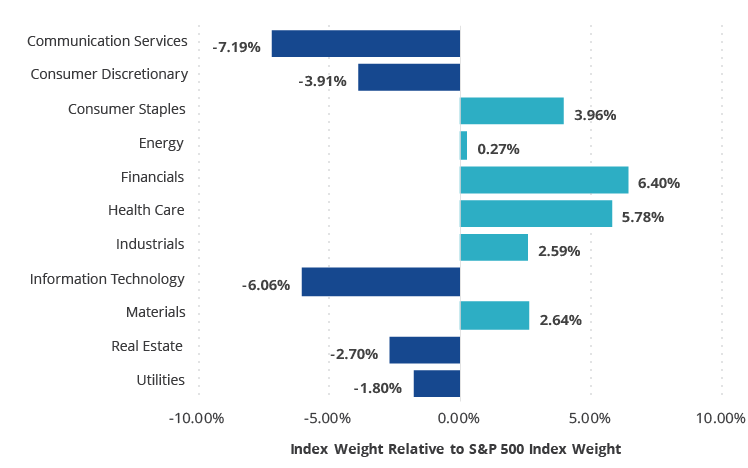
Source: Morningstar.
Moat Index Style: Value Over Growth
The Index’s style exposure to growth companies remains low relative to historical averages. At times in the past when growth exposure has decreased, much of that decrease was offset by “core” or “blend” exposure, which are companies that exhibit characteristics of both value and growth. Now the Index is skewed more heavily to value companies and has one of its highest exposures to value historically.
Value Exposure in Moat Index at All Time Highs
Morningstar Wide Moat Focus Index as of 9/21/2020
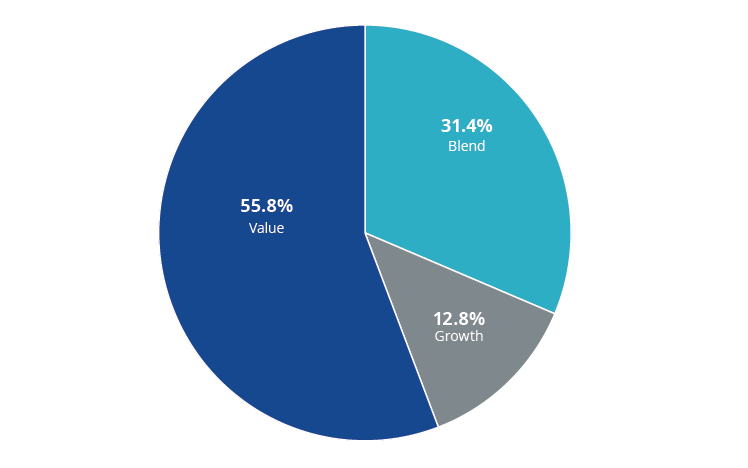
Source: Morningstar.
The last time the Index had anywhere near this level of exposure to value companies was in mid-2018, shortly before the so-called “tech wreck” that coincided with the breakdown of U.S./China trade negotiations in the fourth quarter and subsequent market selloff led by tech stocks. Prior to 2018, the Index has never had as much as 50% exposure to value companies.
You can view full Index review results here.
VanEck Vectors Morningstar Wide ETF (MOAT) seeks to replicate as closely as possible, before fees and expenses the price and yield performance of the Morningstar Wide Moat Focus Index.
For further reading:
- Focusing on Valuations in a Distorted Market
- 3 Ways to Be a Smart Investor During an Election Year
- Morgan Housel on Behavioral Finance and the Psychology of Money
Related Insights

Related Insights

09 July 2026
As mega-cap tech pulled back in June, the Moat Index gained on semiconductor and cybersecurity strength and the SMID Moat Index rose on AI chips and a notable health care deal.
09 June 2026
Software and cybersecurity earnings showed that AI is broadening demand for enterprise tech, not eroding it, as Moat Indexes rebounded late in the month.
08 May 2026
Tech and semiconductor stocks led April’s rebound. Moat stocks participated in the rally though narrow leadership favoring mega-cap growth weighed on relative performance.
10 April 2026
U.S. equities fell in March as oil surged on geopolitical tensions. The Moat Index lagged on no energy exposure, while the SMID Moat Index held up with help from energy and materials.
30 March 2026
The Moat Index added NVIDIA, Broadcom and new names following its quarterly review, as tech dislocations created opportunity, while maintaining a value tilt and notable discount to fair value.