Welcome to VanEck
Select Investor Type
16 August 2026
For a generation, “emerging market debt” (EMD) was shorthand for risk: unstable currencies, governments that borrowed more than they could repay, and central banks that answered to politicians rather than to inflation. That reputation is now out of date and in several respects describes the developed world more accurately than emerging markets.
Many of these emerging market countries spent decades learning fiscal discipline the hard way. They now have lower debt, smaller deficits, and central banks with more room to maneuver than developed-market peers. Meanwhile, the assets most investors treat as a portfolio’s safe core — developed-market government bonds — have quietly accumulated risks over the past decade. On various metrics that define credit risk — debt, deficits and central-bank independence — the gap between the two groups has narrowed.
EMD generally pays higher income yields than developed market bonds. Part of that yield premium compensates for genuine risks — currency volatility, weaker liquidity, and political and institutional uncertainty among them. But a meaningful part of it reflects something else: an outdated reputation and slow-moving investor habits more than current fundamentals, particularly against a backdrop of the developed world's loosening fiscal discipline. That legacy reputation, earned through the crises of the 1980s and 1990s, is due for a fresh look.
Most debate about the classic 60/40 investment portfolio focuses on the equity side. But the part that has quietly let investors down is the 40 — the bond allocation. Anchored to domestic aggregate indices and government bonds, that sleeve has delivered thin real returns and, in 2022, failed at its main job: cushioning a fall in equities.
Begin with what these bonds pay. Emerging market issuers offer a substantial yield pickup over developed-market debt — US dollar-denominated emerging market sovereigns recently yielded over 6%, and high-yield corporates over 7.5%, against roughly 4.3% for the Global Aggregate index and even 3.7% for the Euro Investment Grade Corporates index1. A gap that wide would normally warn of far greater risk. Here, arguably, it reflects an outdated reputation and investor habits more than today's fundamentals.
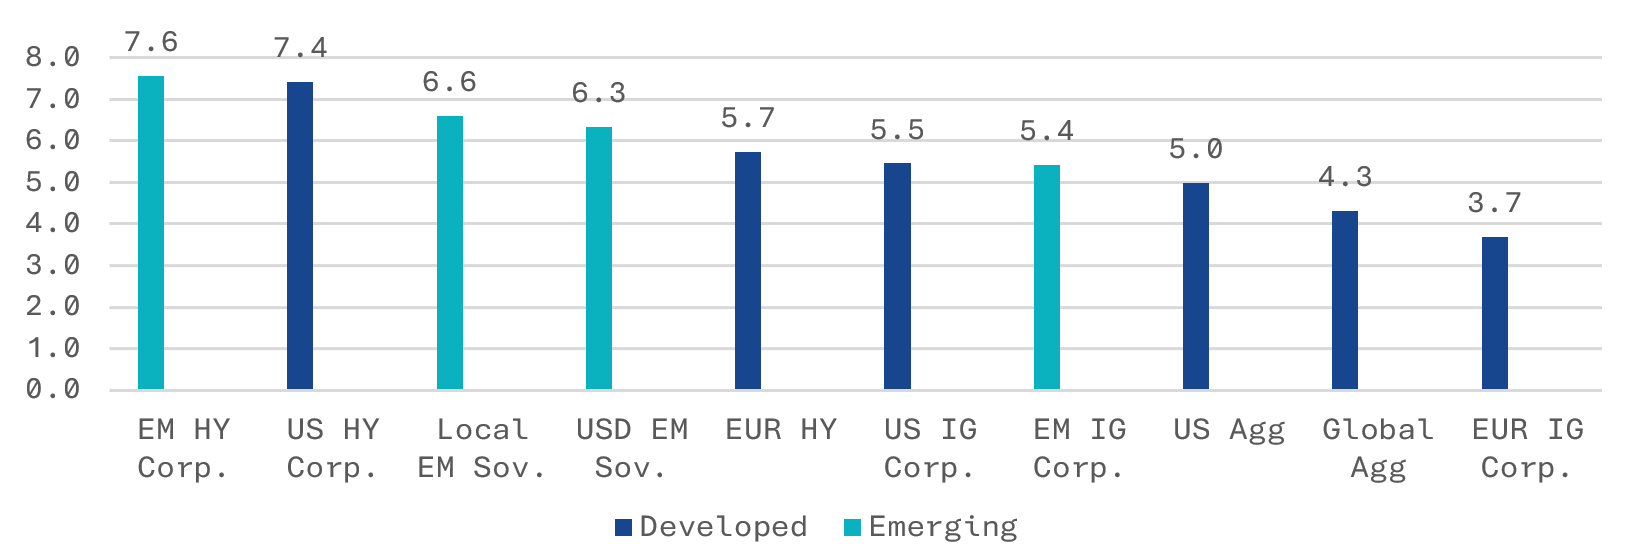
Source: ICE and J.P. Morgan (Local EM Sov.) index data as of 31 July 2026. Average yield by segment; yields are not returns and are subject to change. Corp. = corporates; Sov. = sovereigns; Agg = aggregate; IG = investment grade; HY = high yield.
Consider the conditions that once signaled an emerging market crisis: government debt too large to sustain, deficits that don’t close even in good times, and central banks constrained from raising rates because the government can no longer comfortably afford the interest bill. Each now describes major developed economies.
US federal debt sits at roughly 124% of gross domestic product (GDP) — above its post-World War II peak — and net interest now absorbs around 18% of federal revenue, having climbed sharply from a multi-decade low2. Europe is running sustained deficits outside recession as it rearms, and Germany, long the region’s fiscal anchor, has loosened its constitutional limit on borrowing to allow this3. As interest costs rise, the room a central bank has to keep rates high enough to control inflation narrows. That constraint — fiscal dominance — was once a hallmark of the emerging world. It has now become a developed-market condition.
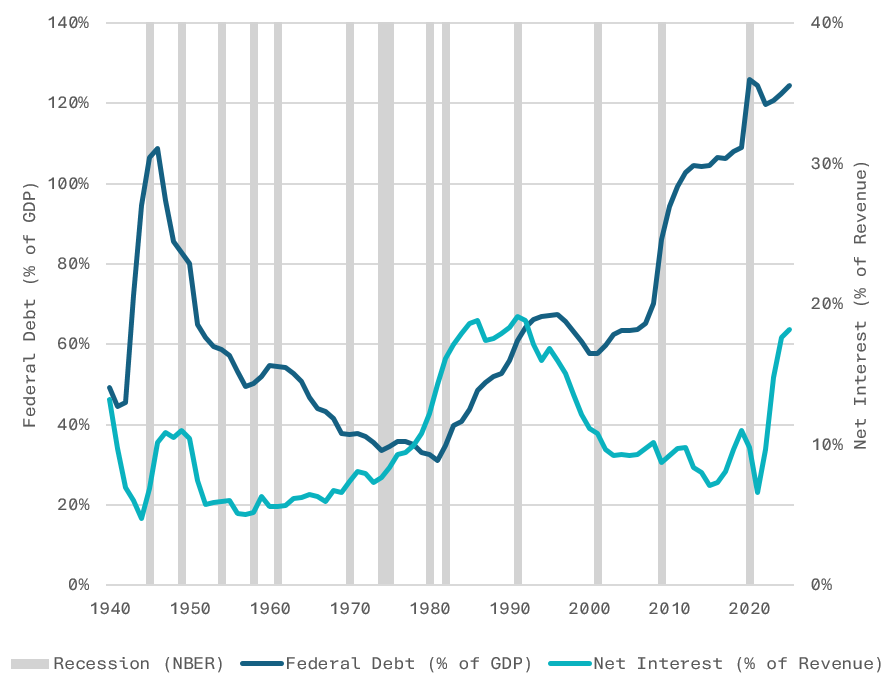
Source: FRED (GFDEGDQ188S, FYOINT).
Against that backdrop, two examples show what the other side of the trade looks like today.
The six Gulf Cooperation Council (GCC) states clearly illustrate that “emerging” no longer means “low quality.” The region’s US-dollar bond market carries an average credit rating of A2 — squarely single-A, and several notches above the BBB− rating of the mainstream US dollar emerging-market sovereign benchmark4 — while still paying a yield in the region of 5.5–6%5. Its credit quality is comparable to US and European investment-grade corporate bonds, but at a higher yield5.
Two features explain why this is not the yield trap it might appear. First, GCC credit works differently to the usual pattern: when energy prices rise, these governments’ finances get stronger, not weaker. Second, the region sits on sovereign wealth buffers estimated at roughly $5 trillion6 — enough to fund years of public-sector deficits even when oil trades below the level their budgets assume. And because the Gulf currencies are pegged to the US dollar, the bonds behave like a dollar interest rate plus a spread, without the currency swings that complicate much of EMD. This is the high-quality, hard-currency end of the opportunity.
If the Gulf makes the quality case, local-currency emerging market government debt makes the diversification case — the specific role the 60/40 investment portfolio’s traditional bond sleeve has stopped playing.
Local currency EMD’s appeal is twofold. First, income: local-currency EM sovereign bonds currently yield well above developed-market government debt, with the broad local-currency government index offering a yield-to-worst (the lowest possible yield outside default) of around 6.6% at a duration of roughly five years7. Second, and more valuable for a portfolio, these markets dance to their own tune. Emerging market central banks set policy rates on cycles independent of the US Federal Reserve and European Central Bank — several began tightening in 2021, a year or more before developed-market policymakers, and have eased on their own timing since8. Their currencies, often tied to commodity exports, behave independently of the dollar. The result is a persistently low-to-moderate correlation to US Treasuries — around 0.2 as of early 2026 — precisely the currency- and rate-cycle diversification an investor gives up when the entire bond sleeve is developed-market government debt9. But this currency exposure cuts both ways. Emerging market currencies can fall sharply in “risk-off” periods, which is the main reason for the asset class's volatility. Equally, it’s a second return driver and the reason these bonds diversify a developed-market bond sleeve rather than echo it.
Source: BIS, Central Bank Policy Rates (WS_CBPOL), to 30 June 2026. Each series is the respective central bank's headline policy rate.
The comfortable assumption behind the traditional bond allocation — that developed-market government debt is the low-risk anchor and emerging markets the speculative fringe — has been overtaken by events. It doesn’t follow that investors should simply abandon developed-market bonds. But the risk characteristics of that 'safe' sleeve have changed. Income, resilience and diversification can be sought from a range of fixed income categories. Emerging market debt is one that has been transformed by reform: issuers that once lurched from crisis to crisis have spent two decades rebuilding credibility.
For all of this, emerging market debt remains strikingly under-owned. Emerging markets are around 15% of global bond markets and more than 40% of global GDP, yet pension plans allocate only about 5% of assets to EM debt on average, and retail portfolios closer to 2%10. That leaves EM debt underrepresented relative to its size in global markets.
Two honest caveats. First, emerging markets are not a monolith — quality varies widely across the universe. Second, parts of that universe trade at tight yield spreads over US Treasuries today, so the case rests less on bonds being cheap than on their improving quality. Even so, the direction of travel is hard to miss — and the old script, in which emerging markets are simply the risky option, no longer reads true.
1 ICE Data Indices and J.P. Morgan index data as of 31 July 2026. Average yield by segment; yields are not returns and are subject to change.
2 Federal Reserve Bank of St. Louis (FRED), series GFDEGDQ188S (federal debt held by the public as a percent of GDP) and FYOINT (federal outlays for net interest), measured against federal current receipts.
3 European Commission, general government deficit data; Deutscher Bundestag, amendment to the Basic Law (Grundgesetz) debt brake, March 2025.
4 Average credit rating (BBB−) of the ICE BofA US Emerging Markets External Sovereign Index (DGOV), the mainstream US dollar hard-currency EM sovereign benchmark; ICE Data Indices, as of 31 July 2026.
5 ICE GCC Government Bond ex-144a Index, as of 31 July 2026.
6 Global SWF, sovereign wealth fund rankings (globalswf.com/ranking). GCC sovereign wealth funds total approximately $5 trillion, led by Saudi Arabia's PIF (~$1.21tn), Abu Dhabi's ADIA (~$1.19tn), Kuwait's KIA (~$1.00tn) and Qatar's QIA (~$0.58tn), with further UAE funds including ICD, Mubadala and others. Figures approximate, per Global SWF AUM estimates.
7 J.P. Morgan GBI-EM Global Core Index; VanEck EMLC fact sheet, as of 31 July 2026.
8 BIS, Central Bank Policy Rates (WS_CBPOL), to 30 June 2026. Each series is the respective central bank's headline policy rate.
9 Neuberger Berman, "Emerging Market Debt Stands on Its Own," 24 June 2026; correlation of local-currency emerging market sovereign debt (J.P. Morgan GBI-EM Global Diversified Index) to US Treasuries, based on Bloomberg and J.P. Morgan data as of 31 March 2026.
10 J.P. Morgan Asset Management, Q2 2026.
IMPORTANT INFORMATION
This is marketing communication.
This information originates from VanEck (Europe) GmbH, which is authorized as an EEA investment firm under the Markets in Financial Instruments Directive (“MiFiD”). VanEck (Europe) GmbH has its registered address at Kreuznacher Str. 30, 60486 Frankfurt, Germany, and has been appointed as distributor of VanEck products in Europe by the Management Company, VanEck Asset Management B.V.(“ManCo”), which is incorporated under Dutch law and registered with the Dutch Authority for the Financial Markets (AFM).
This material is only intended for general and preliminary information and does not constitute an investment, legal or tax advice. No representation or warranty is made as to the accuracy or completeness of the information and no liability is accepted to the fullest extent permitted by law.
The views and opinions expressed are those of the author(s) but not necessarily those of VanEck. Opinions are current as of the publication date and are subject to change with market conditions. Information provided by third party sources is believed to be reliable and has not been independently verified for accuracy or completeness and cannot be guaranteed.
Investing is subject to risk, including the possible loss of principal. For any unfamiliar technical terms, please refer to ETF Glossary | VanEck.
No part of this material may be reproduced in any form, or referred to in any other publication, without express written permission of VanEck.
© VanEck (Europe) GmbH
This is a marketing communication. Please refer to the prospectus of the UCITS and to the KID before making any final investment decisions.
This information originates from VanEck (Europe) GmbH, which has been appointed as distributor of VanEck products in Europe by the Management Company VanEck Asset Management B.V., incorporated under Dutch law and registered with the Dutch Authority for the Financial Markets (AFM). VanEck (Europe) GmbH with registered address at Kreuznacher Str. 30, 60486 Frankfurt, Germany, is a financial services provider regulated by the Federal Financial Supervisory Authority in Germany (BaFin).
The information is intended only to provide general and preliminary information to investors and shall not be construed as investment, legal or tax advice VanEck (Europe) GmbH, VanEck Switzerland AG, VanEck Securities UK Limited and their associated and affiliated companies (together “VanEck”) assume no liability with regards to any investment, divestment or retention decision taken by the investor on the basis of this information. The views and opinions expressed are those of the author(s) but not necessarily those of VanEck. Opinions are current as of the publication date and are subject to change with market conditions. Certain statements contained herein may constitute projections, forecasts and other forward-looking statements, which do not reflect actual results. Information provided by third party sources is believed to be reliable and have not been independently verified for accuracy or completeness and cannot be guaranteed. Brokerage or transaction fees may apply.
All performance information is based on historical data and does not predict future returns. Investing is subject to risk, including the possible loss of principal.
No part of this material may be reproduced in any form, or referred to in any other publication, without express written permission of VanEck.
© VanEck (Europe) GmbH / VanEck Asset Management B.V.

11 December 2025
11 December 2025