Will U.S. Growth Shocks Batter EM?
27 April 2023
Read Time 2 MIN
U.S. Slowdown
The flash estimate for the U.S. Q1 GDP growth was much weaker than expected, slowing to 1.1% quarter-on-quarter annualized vs. 1.9% expected. While the print had no discernible impact on market expectations about next month’s rate hike by the U.S. Federal Reserve (88% implied probability or so), it did raise questions about potential implications for emerging markets (EM), especially if U.S. growth weakness persists due to tightening credit conditions.
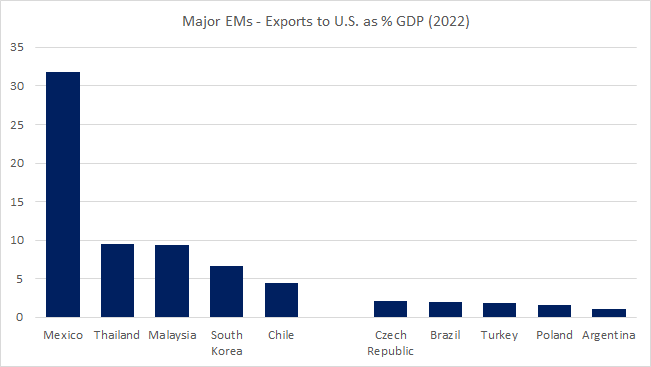
Mexico Nearshoring
There are various ways to gauge the impact of exogenous shocks on growth – one of them is to look at transmission via trade channels. The chart below shows the share of exports to the U.S. from major EMs as a percentage of their respective GDP. Mexico is a standout on this metric, and it remains to be seen whether the nearshoring story – which is a great longer-term investment theme – will help to shield the economy (and the Mexican peso) in the coming months.
EM Growth and China Rebound
Central European countries and Brazil look significantly less exposed via trade channels – the former are joined at the hip with Europe (which is why we keep an eye on tomorrow’s Q1 flash GDP print there) and the latter is a more closed economy than Mexico. Several Asian economies also have significant trade exposure to the U.S., but their stronger correlation with China’s rebound should help to mitigate the negative impact of potential growth headwinds from the U.S. Stay tuned!
Chart at a Glance: EM Exports to the U.S. – Top 10, Bottom 10
Source: VanEck Research; Bloomberg LP.
Related Insights
Related Insights
07 April 2025
06 March 2025
20 February 2025
10 February 2026
Debasement is back in focus. Here’s what’s driving it, what could reverse it and how we’re positioning portfolios for both scenarios.
07 April 2025
Trump’s tariffs spark trade war fears, fueling market volatility, inflation risk, and recession threats. With global retaliation likely, near-term growth is clearly at risk.
06 March 2025
Trump’s tariffs, AI’s next phase, and a potential U.S. gold revaluation could shake markets—investors who stay ahead of these transitions will be best positioned.
20 February 2025
China's AI breakthrough, persistent inflation, gold’s outperformance, and rising energy demand underscore a shifting investment landscape.
16 January 2025
In 2025, navigating turbulence means balancing tech innovation, inflation hedges, energy shifts, and risks from spending cuts and inflation.