Welcome to VanEck
Select Investor Type
29 July 2021
VanEck assumes no liability for the content of any linked third-party site, and/or content hosted on external sites.
Bitcoin’s scarcity value and underlying hard-money ethos cemented the appeal of cryptocurrencies, but the true technological innovation will always be the smart contract, which lets anyone with an internet connection program instructions into their money cheaply. Thus, in this analyst’s view, the tech is deflationary like every other piece of software (automation tool) ever written. No wonder crypto is so politically polarizing! For an illustration of this trend in action, let us ponder the chart below, which shows that the S&P 500 is 70% less labor intensive than it was in the 1980s. And yet the pace of “deterioration” (“improvement”?) has stalled out in the last decade. Surely that goes against the media narrative and our own lived experiences at the self-checkout lane. What is going on? Could it be that if crypto were captured in the S&P 500, then the trend line would have continued to fall?
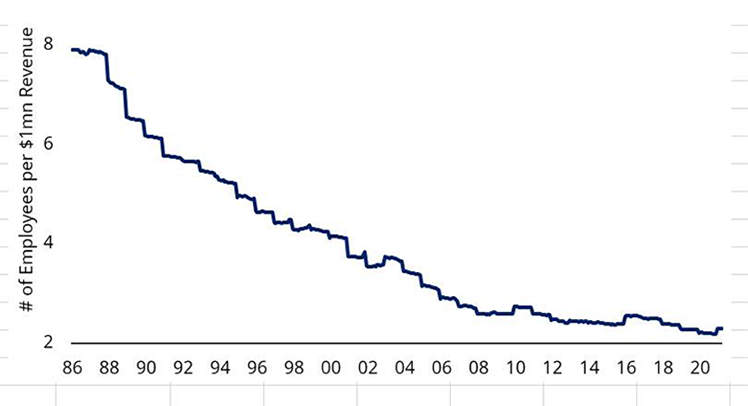
Source: Bofa Merrill.
Well, Bitcoin and Ethereum together have settled a cumulative value of over $8T, earning $46B in revenues for miners along the way.
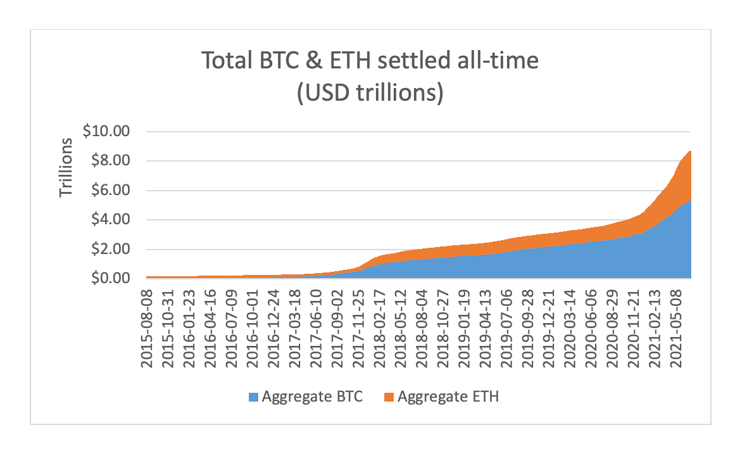
Source: CoinMetrics, VanEck.
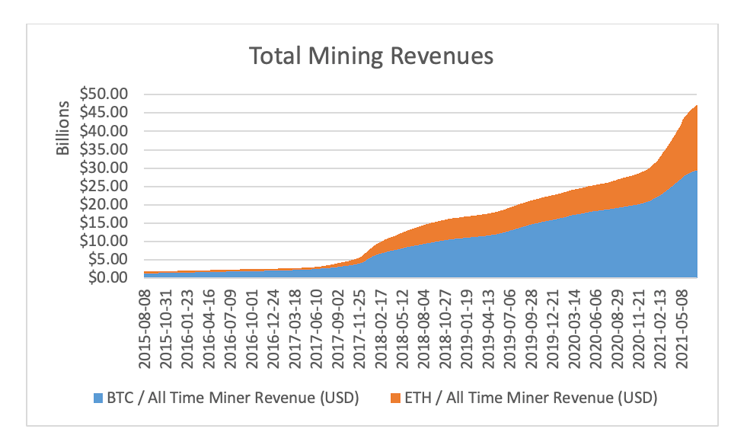
Source: CoinMetrics, VanEck.
Neither has any real “employees” to speak of.
Meanwhile the smallest market cap in the S&P 500 is $5.6B, but on 7 July 2021 there were 22 cryptocurrencies with a market cap greater than $5.6B, according to Bloomberg data.
If we removed the 12 smallest companies by market cap (U.S. is approximately 55% of global market cap) in the S&P 500 and replaced them with just BTC and ETH, the above chart would fall from 2.10 to 2.09 according to my calculations of Bloomberg’s data.
Here’s another way to think about it:
The largest Bitcoin miner in the MVIS Global Digital Assets Equity Index is Marathon Digital (MARA, mkt cap $2.8B).
The company has 3 full-time employees (Bloomberg data) vs. consensus of $250M 2021 revenues. That’s a 0.01 ratio of employees per $1M revenues.
Riot Blockchain (RIOT, mkt cap $3B), another miner in the index, reports 8 employees supporting 2021 estimated sales of $205M, for an employees-per-$1M-revenues ratio of 0.039.
Coinbase, the largest index constituent, is expected to produce $6.3B in sales from its 1,249 employees for a ratio of 0.2.
All told, the average revenue of companies in the index, which includes heavyweights like NVDA and TSM, is $4.84B and the average number of employees is 3,140, producing an average employees per $1M/revenue of 0.65. As a reminder, the S&P is at 2.1.
Looks to me like America is enjoying its extra leisure time.
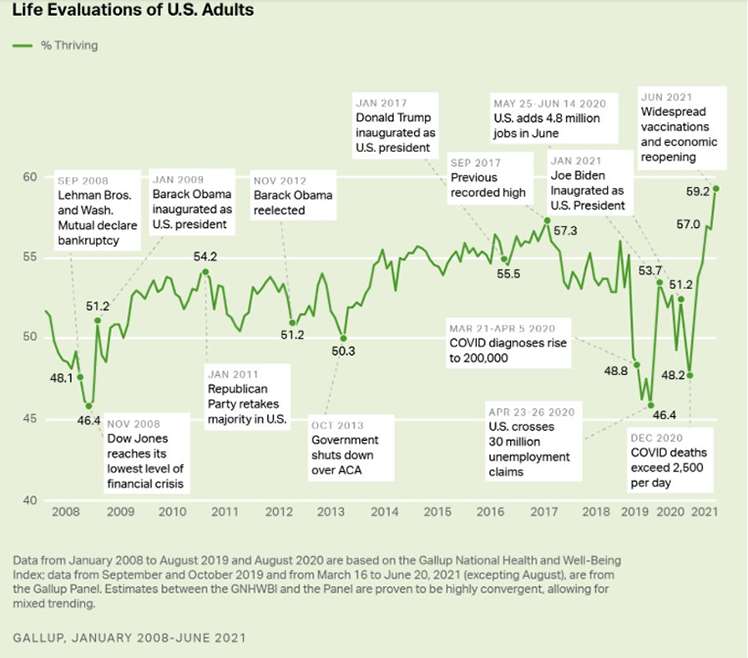
Source: Americans' Life Ratings Reach Record High (gallup.com).
Lower costs = consumer welfare = GDP.
Indeed the World Bank’s Global Remittance Quarterly reveals a steady decline in the cost to send $200 across borders, though the blended rate remains high at 6.38%. (Note the stalling of the blue line (“digital”) in figure 1. We’ll come back to that.)
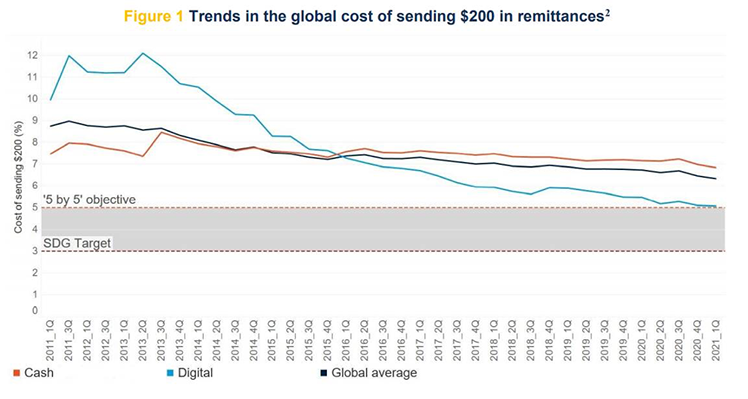
Source: World Bank remittance quarterly doc here.
Ever the optimists, the UN has set a target to reduce the transaction costs of migrant remittances to less than 3% by 2030, highlighting debit/credit cards as among the biggest enablers, with nary a word of blockchain technologies.
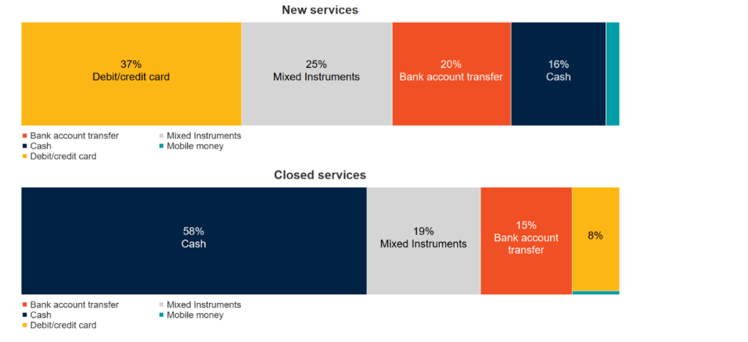
Source: World Bank.
In developed markets there is some room for further card penetration (currently 75%), but the last 25% might be tougher sledding on customer acquisition costs given that some meaningful proportion of those people probably just don’t want to be found.
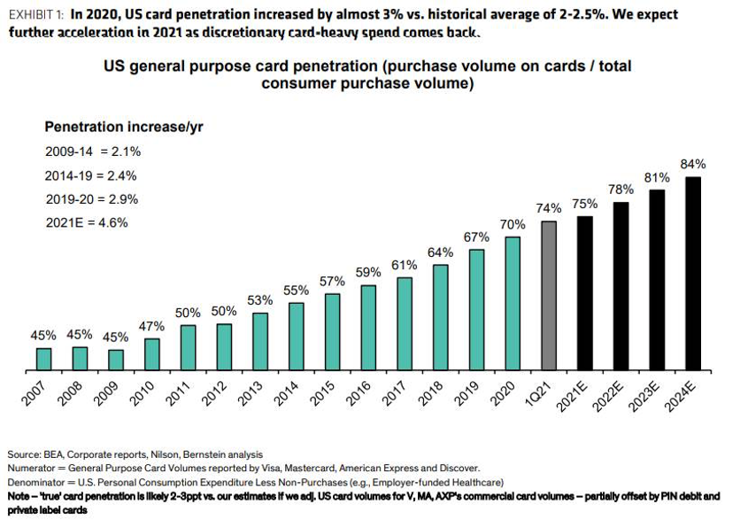
Source: Bernstein.
And indeed there are some warning signs that digital payment prices have stopped falling in the U.S. (Look back at “trends in the global costs of sending $200 in remittances” chart above).
Paypal just raised checkout prices by 27%.
Venmo just introduced new fees to close its monetization gap with Cash App.
American Express raised the fee on its Platinum Card from $550 to $695.
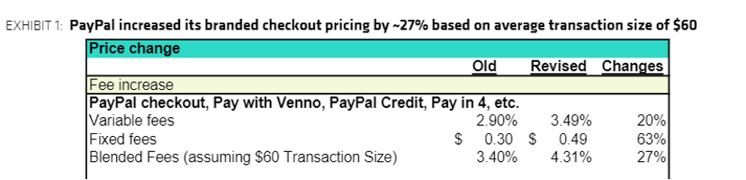
Source: Sanford C. Bernstein.
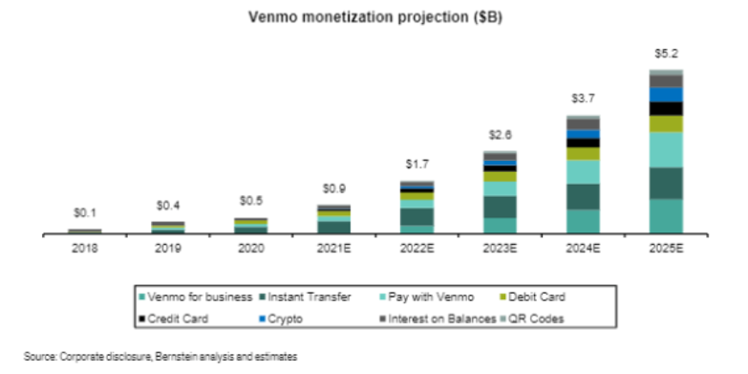
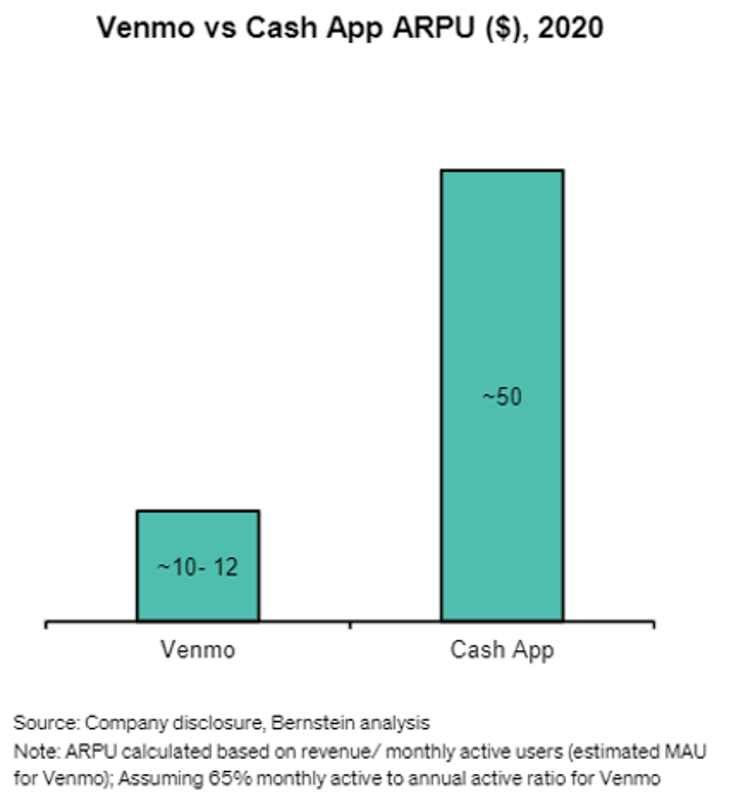
Source: Sanford C. Bernstein.
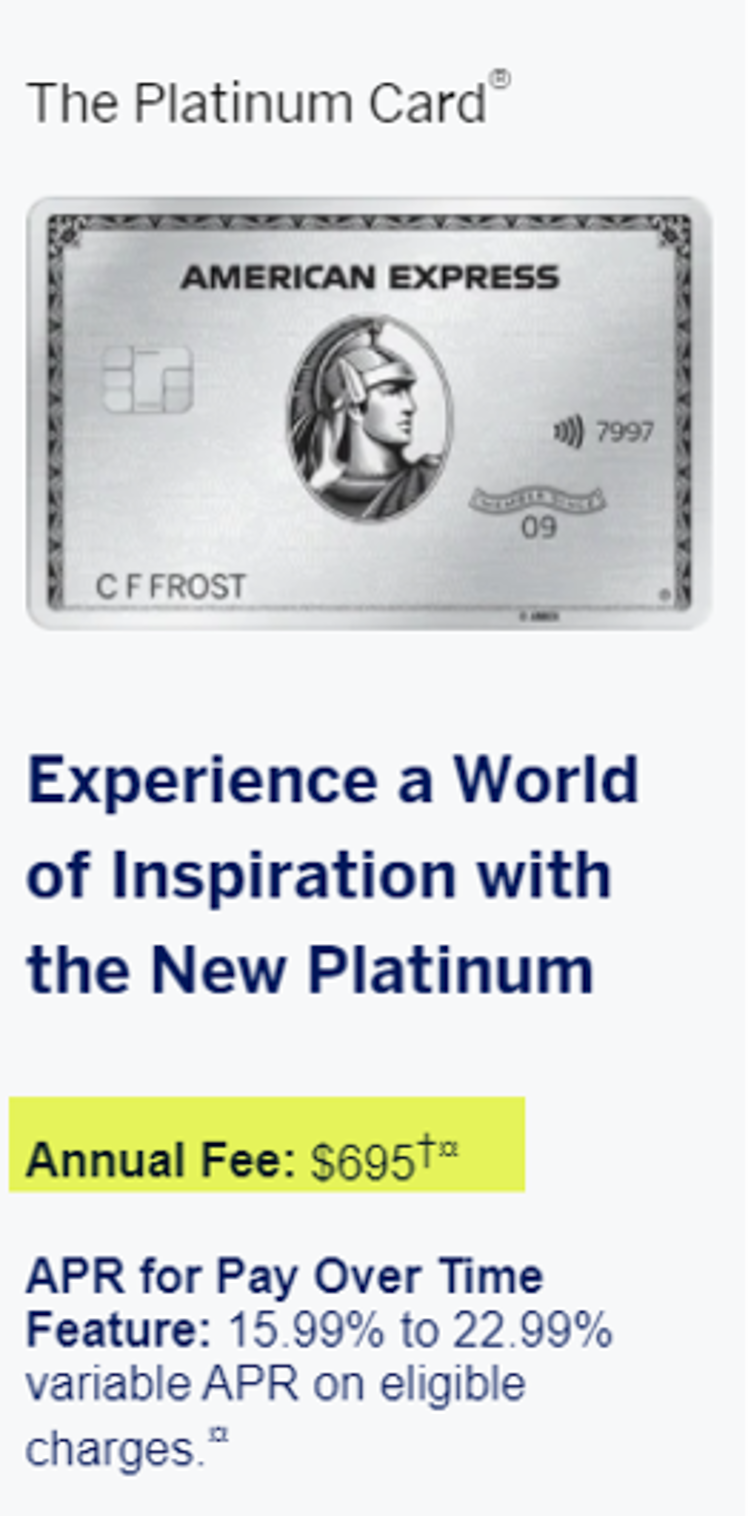
Source: American Express home page.
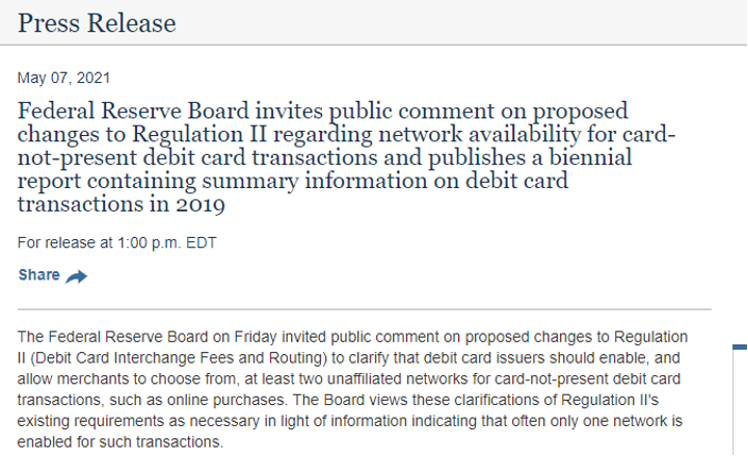
Add financial services to your list of inflation concerns? Well, let’s see if regulators and courts get involved.
See, even though banks’ transfer costs have plummeted thanks to tech investments and returns to scale (though again, stabilizing in the latest print)...
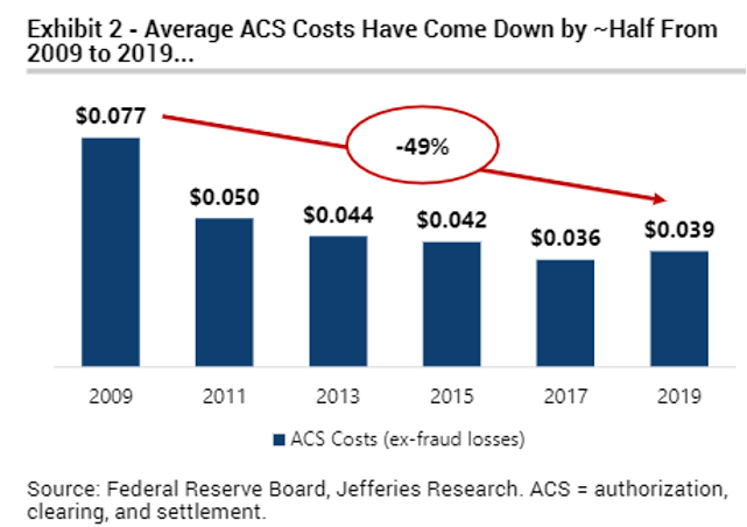
...the fees they charge merchants for the right to swipe have remained sticky, according to the Fed’s biennial survey updated April 2021.
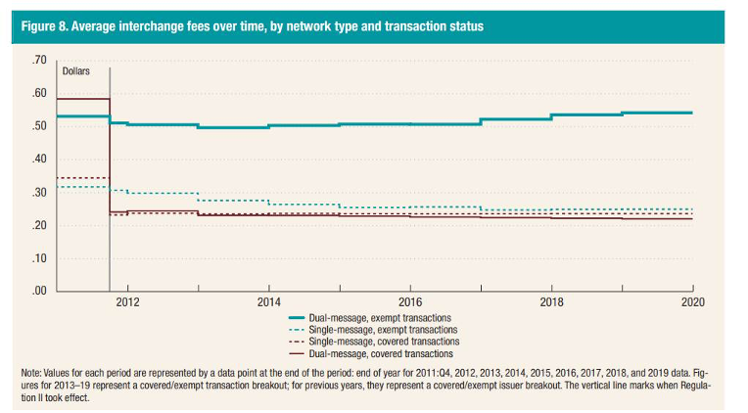
Source: Federal Reserve.
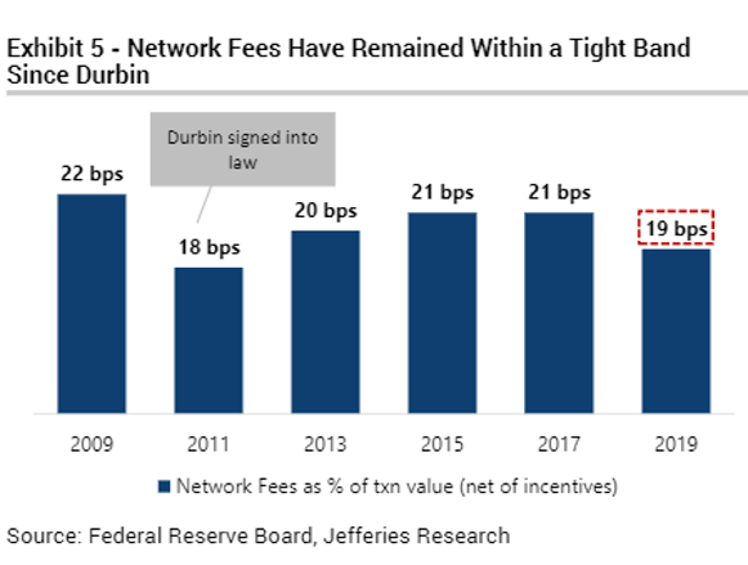
Source: Jefferies.
Thus, merchants and consumers are shouldering an increasing proportion of the rising fraud losses associated with e-commerce (my son just got scammed for $1,000 selling an item on eBay and zero recourse).
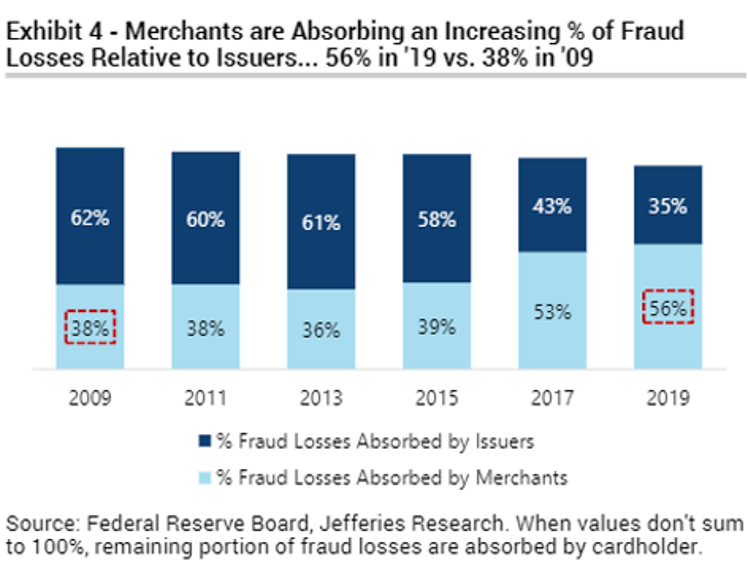
Source: Jefferies.
But now there is some hint of a backlash both in the courts and in the markets to these sticky fees.
In the courts:
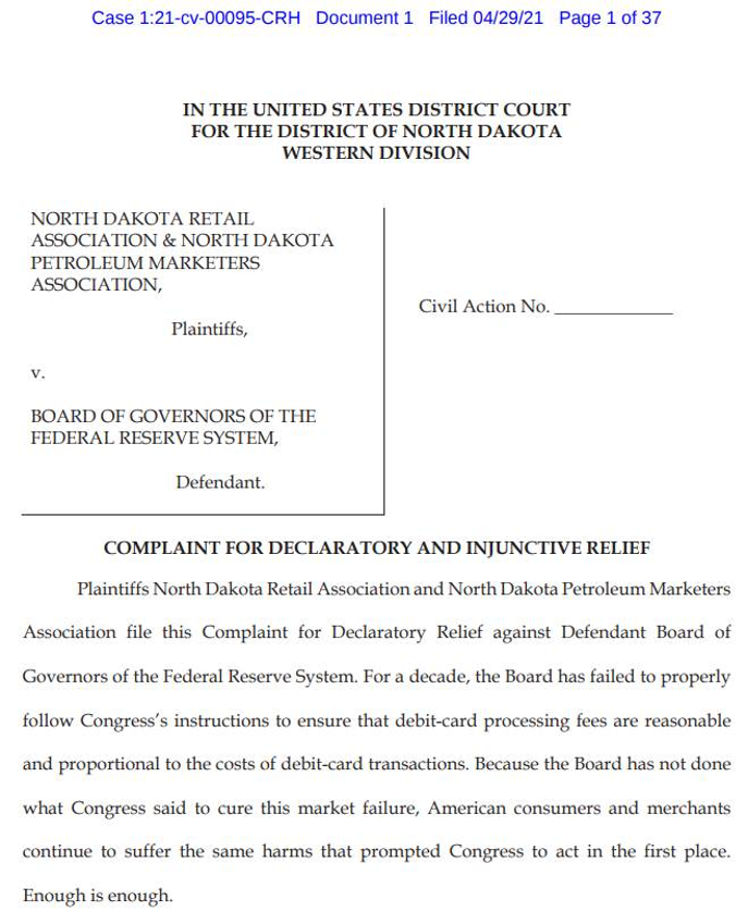
In April a group of merchants in North Dakota sued the Fed in Federal Court claiming that “for a decade, the [Federal Reserve] board has failed to properly follow Congress’ instructions to ensure that debit card processing fees are reasonable and proportional to the costs of debit card transactions. American consumers and merchants continue to suffer the same harms that prompted Congress to act in the first place. Enough is enough.”
For background, in 2011 the Fed initially said interchange fees would be limited to 12 cents per transaction. After negotiations with the banks, that cap was raised to 21 cents plus another cent for fraud prevention, and 5bps for losses.
In the end, the $24B in interchange revenue to banks from merchants (and consumers) may seem like a small number, but since it covers such a wide swath of the U.S. economy, this lawsuit bears watching.
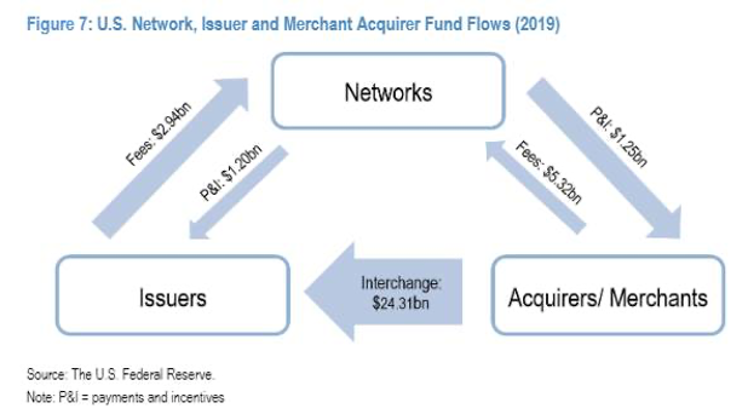
Source: JPMorgan.
Source: JPMorgan.
Also worth watching on the legal front: the Fed’s looming clarification on card-not-present debit charges, which is now in the public comment period and affects some ~16% of Visa’s revenue, according to Bernstein analysis. Visa disclosed a DOJ civil investigation on this topic in March.
Source: Federal Reserve
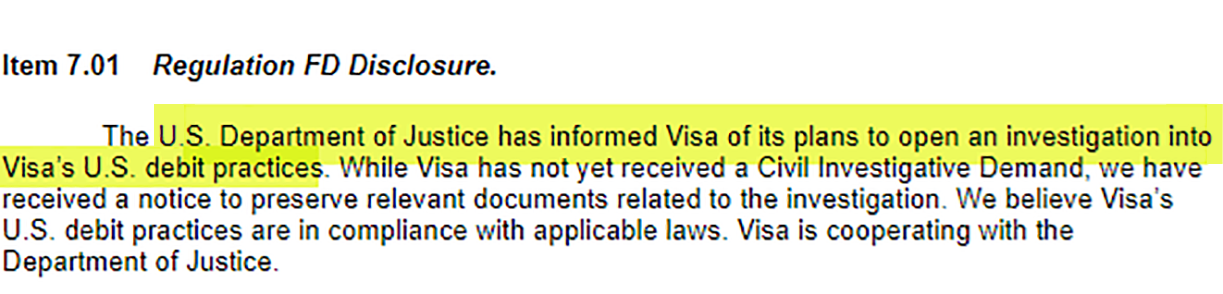
Source: Visa 8-K March 19, 2021.
As for the market-based disruption in payments, there is a $13B market cap payments company that just went public via direct listing in London, the former TransferWise, now just Wise.
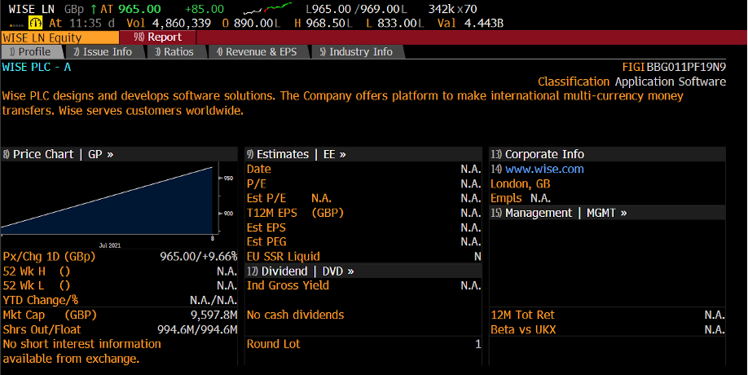
Source: Bloomberg.
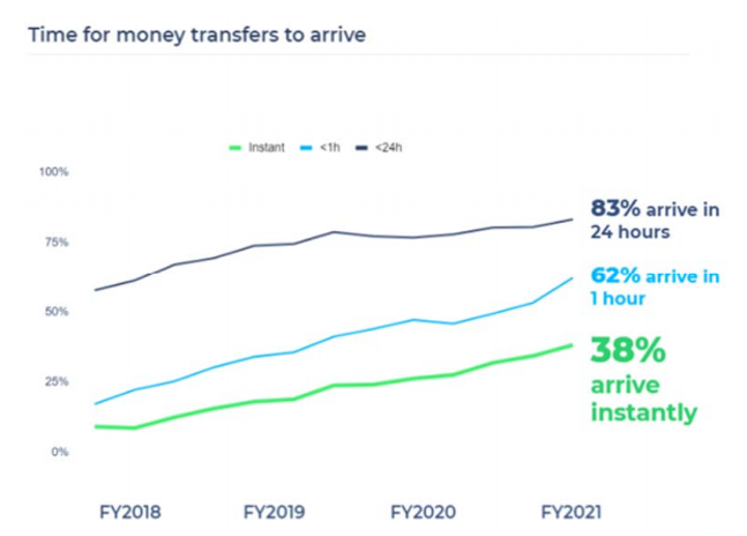
Wise promises a 70bps take-rate on international transfers with 38% of transactions settling instantly.
According to its prospectus, Wise “replaces traditional international banking for 10 million personal and business customers.”
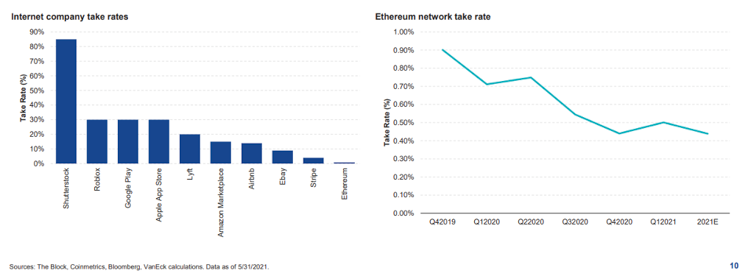
Wise facilitated $74B in volumes, earning $581M in topline for shareholders in FY2021, a 79bps “take-rate” (still nearly 2x Ethereum platform costs – see exhibit below).
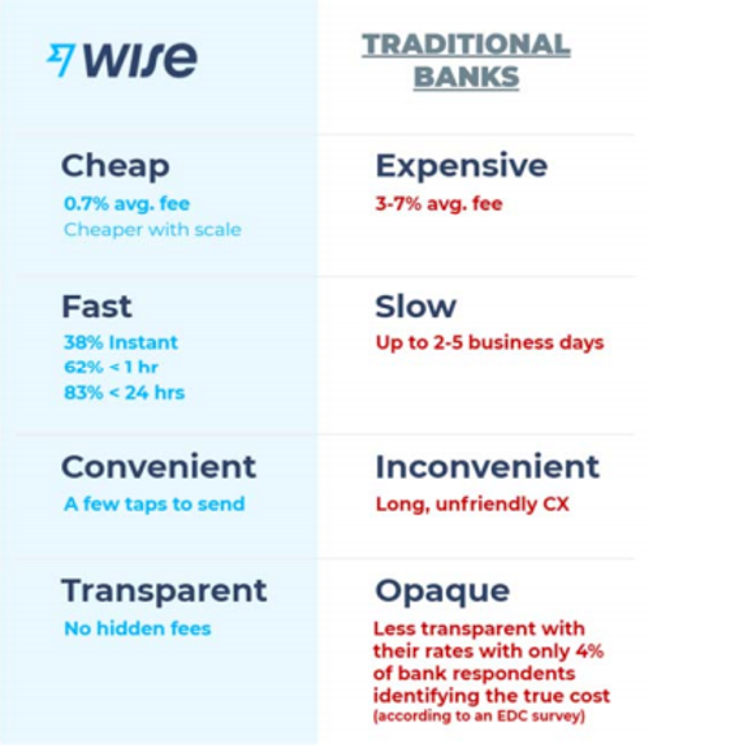
Source: Wise prospectus.
And yet given the threat from even cheaper cryptocurrency payment alternatives…
… I confess I am somewhat surprised there was no mention of crypto or blockchain in the WISE prospectus as a risk factor, as AirBnb famously included. Instead, WISE referred generally to its mission to “reduce our fees to zero.”
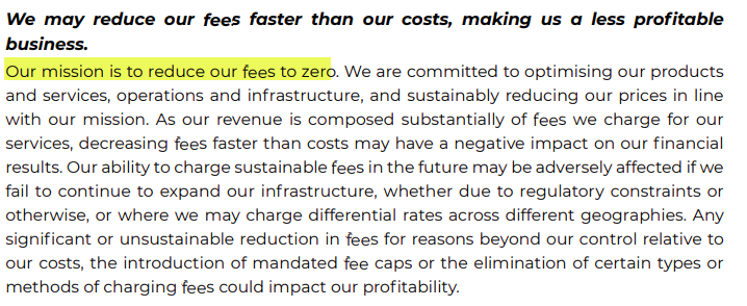
Source: Wise prospectus.
It’s hard to reduce fees to zero unless you have a token-based ecosystem in which the unit of exchange is also used for transaction fees that are distributed to participants instead of run through a corporation that pays salaries (ETH!).
(I guess you can also get there if you get paid for order flow.)
Anyway, the billionaire co-founder of WISE is 40-year-old Estonian Taavet Hinrikus.
WISE stock trades at 21x trailing sales per Bloomberg and the prospectus.
Much of crypto trades much cheaper:
When Ethereum hit $4,300 in April, it cost more than $40 to send an NFT on the network, and that was clearly not sustainable.
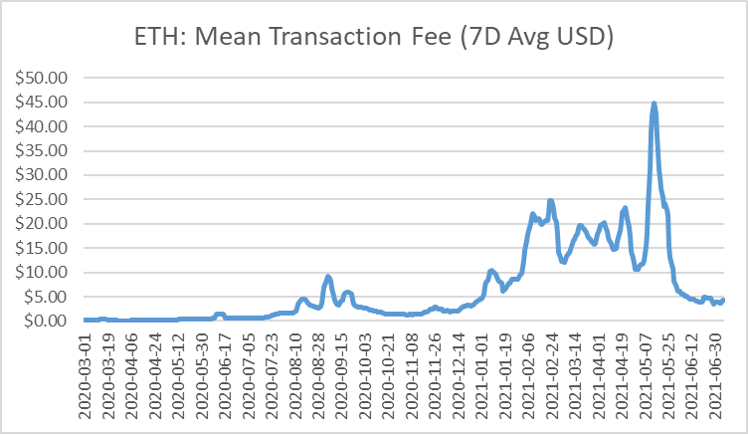
Source: CoinMetrics, VanEck.
But just as Google really took off during the recession and broadband rout of 2002-2004, the key question for ETH is whether enough latent demand materializes during now-weak pricing to soak up the new network capacity with Web 3.0 killer decentralized applications (DApps).
On that front it is encouraging to note the momentum of Axie Infinity, an Ethereum blockchain-based trading and battling game that allows players to collect, breed, raise, battle and trade token-based creatures known as “Axies.” Players can trade Axies with the AXS token, stake their coins for weekly rewards, and participate in governance voting. Max supply is capped at 270 million and importantly, in contrast to NBA Top Shot, the tokens can be exchanged for other cryptocurrencies. Axie Infinity protocol revenues have grown 405% in the last 30 days, surpassing even the lending platforms like Aave, Compound and Uniswap, according to TokenTerminal. Axie is now the most liquid digital collectibles marketplace in the world; its $2.4B in annualized gross merchandise value exceeds OpenSea, NBA Top Shot, CryptoPunks and Rarible, according to Dappradar.
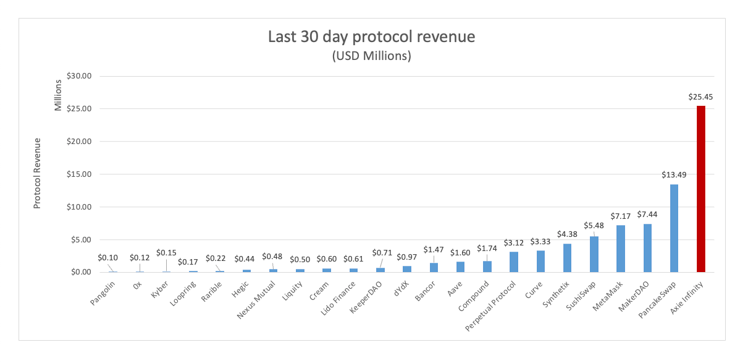
Source: TokenTerminal, VanEck. As of 15 July 2021.

Source: Axie Infinity home page.
So, Wise promises micropayments at 70bps and trades at 21x revenues.
Meanwhile AXS lets you make money while playing a social game, collects a 4.25% marketplace fee on Axie transactions, and trades on less than 10x sales, according to TokenTerminal.
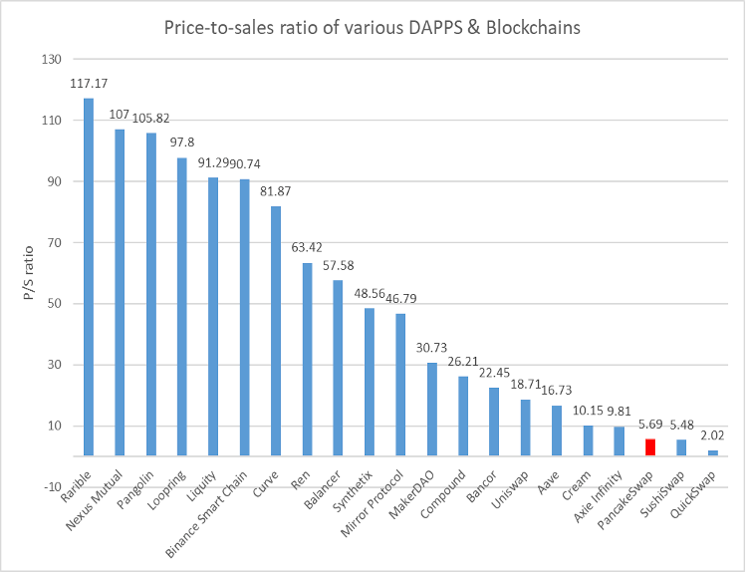
Source: TokenTerminal, VanEck. As of 15 July 2021.
Clearly the market doubts the sustainability of the game and the business model.
What the market shouldn’t doubt is that Ethereum-based DApp momentum is increasing.
In fact for a brief moment last week there were more active ETH addresses than BTC.
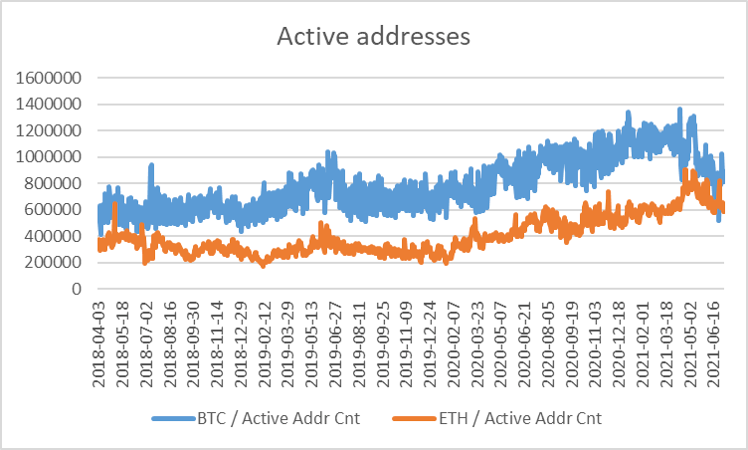
Source: CoinMetrics, VanEck.
If you are curious about this Axie Infinity game, I recommend watching a bit on Twitch; you wouldn’t be the first.
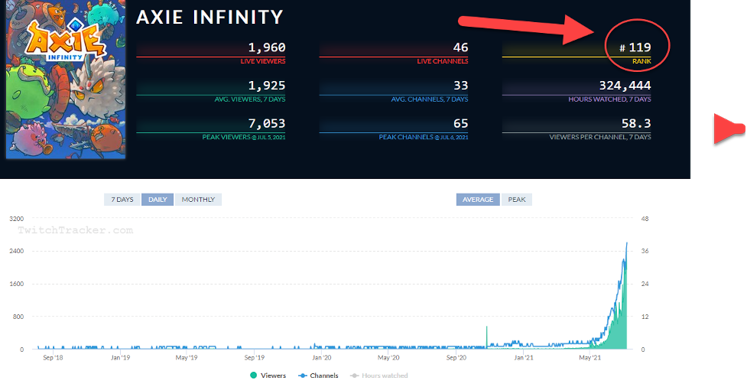
Source: Twitchtracker
Crypto doesn’t need an app store; it is an app store.
Top innovative blockchain uses of the week:
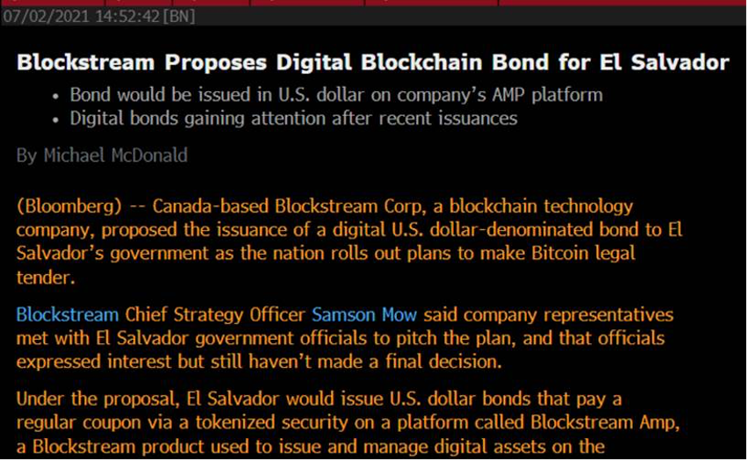
Source: Bloomberg.
Analysis: Some might say a USD bond defeats the purpose of El Salvador’s Bitcoin-as-legal-tender gambit, but think of it another way: when was the last time you bought a single issue sovereign? I’m thinking El Salvador 4.25% 2030s (a guess) that trades on FTX could attract plenty of GME/AMC YOLO types.
Source: Bloomberg.
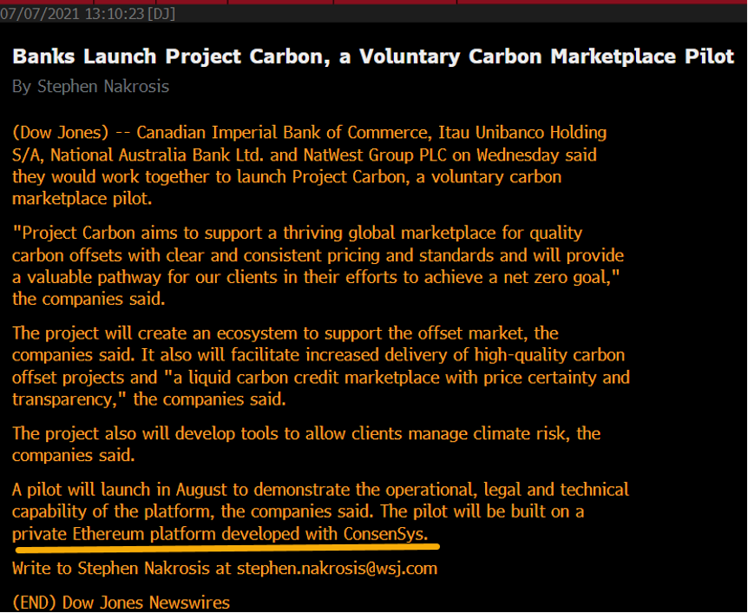
Analysis: this is hardly the first CO2 trading venue to be built on the (Ethereum) blockchain, but the fact it includes 3 heavyweight banks from 3 different continents gives it more credibility than some others.
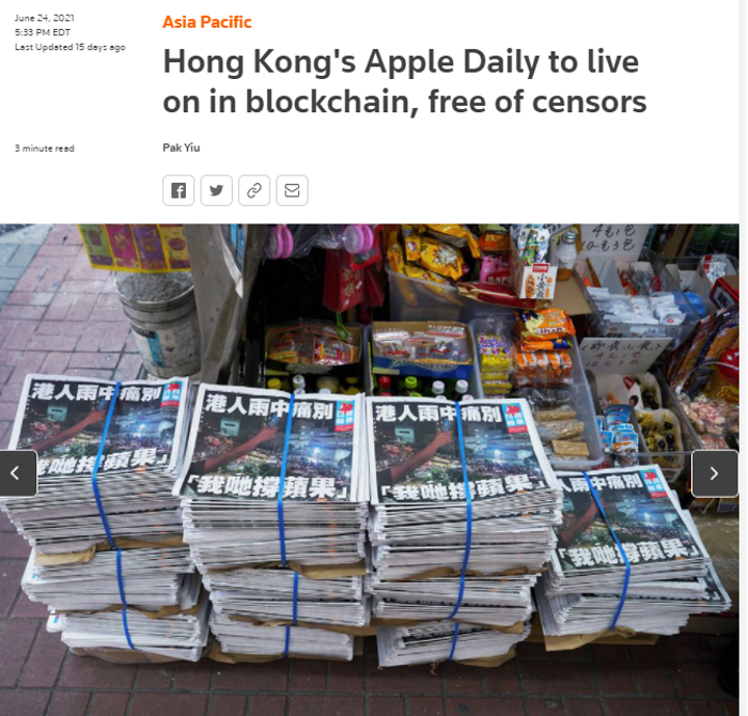
Analysis: the value of censorship resistance should rise commensurate with the rise of censorship.
“Cho has devised a virtual currency called Ggool, which means honey in Korean. Each person using the eco-friendly toilet earns 10 Ggool a day. Students can use the currency to buy goods on campus, from freshly brewed coffee to instant cup noodles, fruits and books. The students can pick up the products they want at a shop and scan a QR code to pay with Ggool. "I had only ever thought that faeces are dirty, but now it is a treasure of great value to me," postgraduate student Heo Hui-jin said.
Analysis: C02 emissions prices are up 10x since 2017. Expected continued innovative ideas to monetize stranded assets such as methane.
Source: Bloomberg.
VanEck assumes no liability for the content of any linked third-party site, and/or content hosted on external sites.
The information herein represents the opinion of the author(s), but not necessarily those of VanEck, and these opinions may change at any time and from time to time. Non-VanEck proprietary information contained herein has been obtained from sources believed to be reliable, but not guaranteed. VanEck does not guarantee the accuracy of third party data. Not intended to be a forecast of future events, a guarantee of future results or investment advice. Historical performance is not indicative of future results. Current data may differ from data quoted. Any graphs shown herein are for illustrative purposes only. Not a recommendation to buy or to sell any of the securities/ financial instruments mentioned herein.
This is a marketing communication. Please refer to the prospectus of the UCITS and to the KID before making any final investment decisions.
This information originates from VanEck Switzerland AG which has been appointed as distributor of VanEck products in Switzerland by the Management Company VanEck Asset Management B.V., incorporated under Dutch law and registered with the Dutch Authority for the Financial Markets (AFM). VanEck Switzerland AG’s registered address is at Genferstrasse 21, 8002 Zürich, Switzerland.
The information is intended only to provide general and preliminary information to investors and shall not be construed as investment, legal or tax advice. VanEck Switzerland AG and its associated and affiliated companies (together “VanEck”) assume no liability with regards to any investment, divestment or retention decision taken by the investor on the basis of this information. The views and opinions expressed are those of the author(s) but not necessarily those of VanEck. Opinions are current as of the publication date and are subject to change with market conditions. Certain statements contained herein may constitute projections, forecasts and other forward-looking statements, which do not reflect actual results. Information provided by third party sources is believed to be reliable and have not been independently verified for accuracy or completeness and cannot be guaranteed. Brokerage or transaction fees may apply. A copy of the latest prospectus, the Articles, the Key Information Document, the annual report and semi-annual report can be found on our website www.vaneck.com or can be obtained free of charge from the representative in Switzerland: First Independent Fund Services Ltd, Feldeggstrasse 12, 8008 Zurich, Switzerland. Swiss paying agent: Helvetische Bank AG, Seefeldstrasse 215, CH-8008 Zürich.
All performance information is based on historical data and does not predict future returns. Investing is subject to risk, including the possible loss of principal.
No part of this material may be reproduced in any form, or referred to in any other publication, without express written permission of VanEck.
© VanEck Switzerland AG

09 March 2026
09 March 2026