In September, digital assets, especially Bitcoin and Ethereum, performed better than traditional market indices. Large-cap tokens excelled due to decreased on-chain activities, and market hopes tied to ETF approvals.
Please note that VanEck may have a position(s) in the digital asset(s) described below.
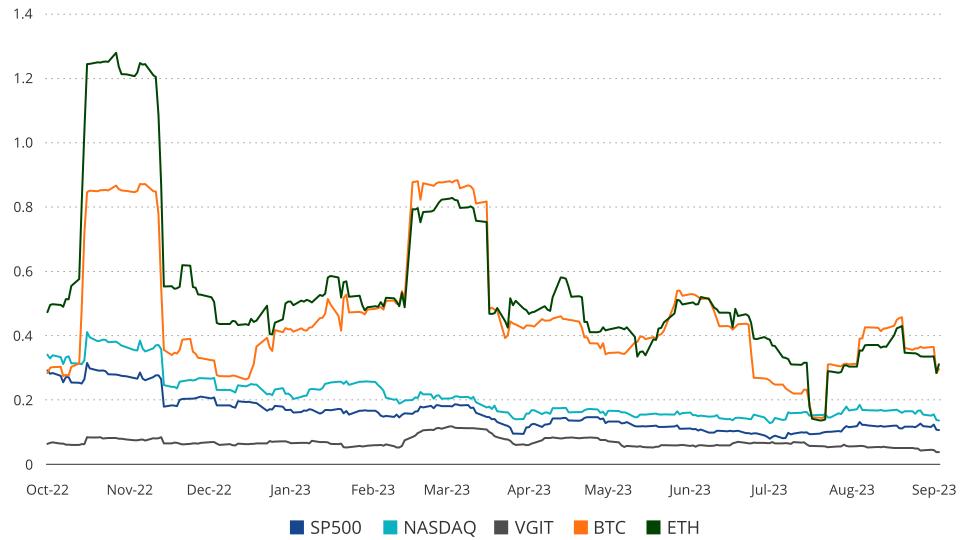
Digital assets outperformed other risk assets in September for the first time since May, as Bitcoin rose +3% and Ethereum +1% vs. the S&P -5% and the Nasdaq Composite -6%. Among tokens, large-caps’ outperformance surged to all-time highs vs. small-caps as dwindling on-chain volumes and lackluster blockchain fees prompted market participants to defend BTC and ETH weakness on ETF approval hopes rather than take risk on more speculative coins with less valuation support. The exception was DeFi, which outperformed materially (+13%) in the month thanks to AAVE & MKR essentially capturing yield income from US Treasuries (“real world assets”), a trend to be discussed further below.
| |
September |
YTD |
| Coinbase |
-6% |
112% |
| Bitcoin |
3% |
63% |
| Ethereum |
1% |
39% |
| Nasdaq 100 Index |
-6% |
27% |
| MarketVector™ Infrastructure Application Leaders Index |
11% |
22% |
| MarketVector™ Decentralized Finance Leaders Index |
13% |
17% |
| S&P 500 Index |
-5% |
12% |
| MarketVector™ Smart Contract Leaders Index |
0% |
12% |
| MarketVector™ Centralized Exchanges Index |
-1% |
-11% |
| MarketVector™ Media & Entertainment Leaders Index |
-6% |
-39% |
Source: Bloomberg, VanEck research as of 9/30/2023. Past performance is not indicative of future results. Not intended as a recommendation to buy or sell any of the names mentioned herein.
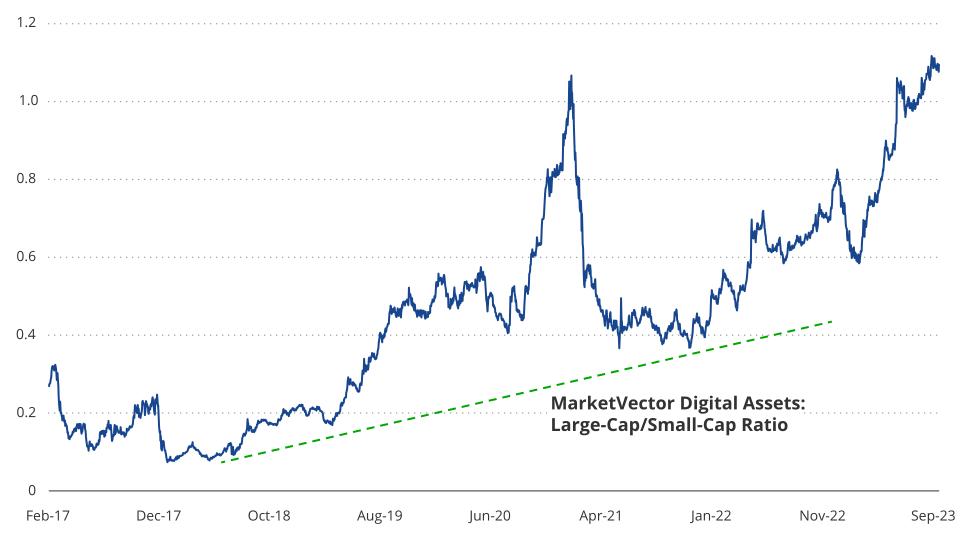
Source: Bloomberg, MarketVector, VanEck, as of 10/2/23. Past performance is not indicative of future results. Not intended as a recommendation to buy or sell any of the names mentioned herein.
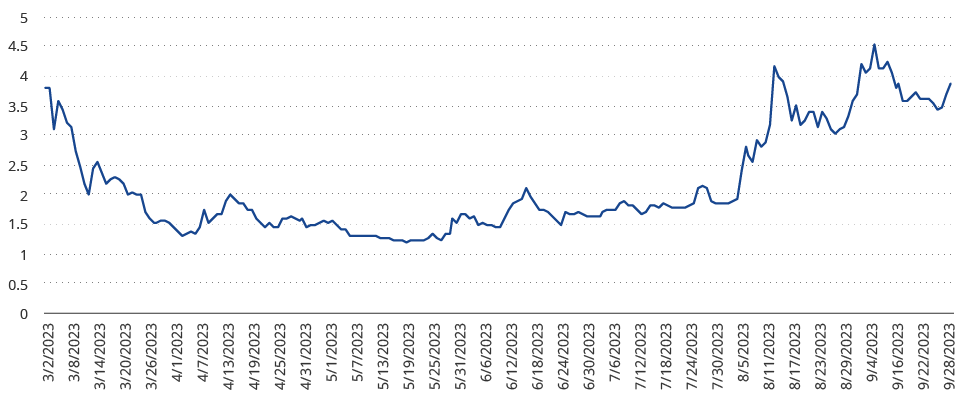
A curious development in the month involved Bitcoin active addresses making all-time highs in September even as the median transfer value made multi-year lows. One explanation is the emerging dominance of Bitcoin “Inscriptions,” which encode images, files, or text into the Bitcoin blockchain’s data structure, similar to NFTs. Such transactions are low value, but inscribers have been “buyers of last resort” of Bitcoin blockspace, and that trend continued in September. Another explanation is that Binance has been making many unusual wallet movements, possibly ahead of a DOJ action. A third reason for the animated address activity is that while overall crypto trading volumes have dwindled, Asia and Latin America (where transactions are smaller) have outperformed Europe or the US.
Bitcoin Transactions Soar Amidst Dwindling Transaction Values
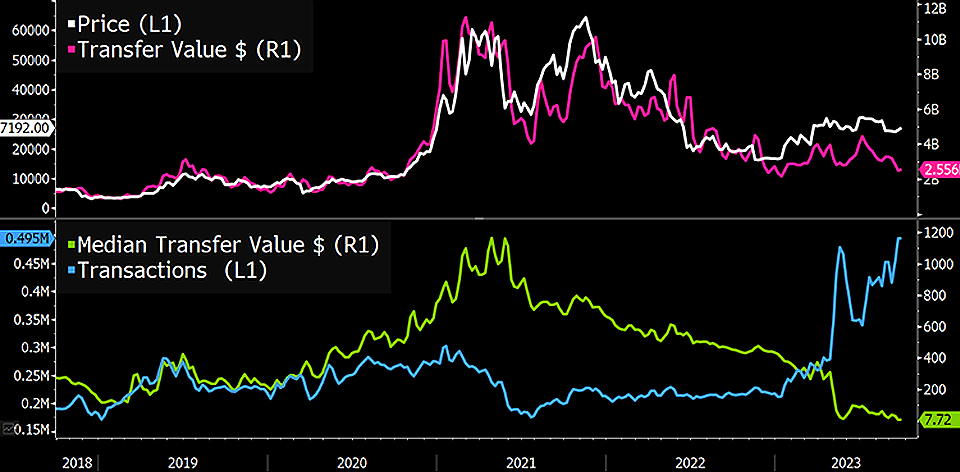
Source: Bloomberg, as of 9/27/23. Past performance is not indicative of future results. Not intended as a recommendation to buy or sell any of the names mentioned herein.
Another encouraging development of late is the narrative shift around Bitcoin’s energy intensity. First, in August, the University of Cambridge Center for Alternative Finance (CCAF) slashed its estimate of Bitcoin’s total energy usage by 14% to account for the higher efficiency of newer mining machines. Then the Bitcoin Mining Council, in its most recent quarterly release, announced that more than 50% of the network is now powered from renewable energy sources (recall that Elon Musk previously tweeted that Tesla would resume accepting Bitcoin once more than half of the network was powered by sustainable electricity). PWC then wrote a explicitly calling Bitcoin “ESG,” and Bloomberg published a long article and accompanying video (“”) touting Iceland’s “carbon-free” Bitcoin mining. Finally, on September 25th, Argentina’s largest private oil & gas company, Tecpetrol, accounting for roughly 15% of the country’s oil & gas production, announced it would start mining digital assets with gas power leftovers like vented methane in a bid to increase production and safeguard the environment. Argentina could play an even more crucial role in the global adoption of Bitcoin as soon as October 22nd, when the final round of Argentina’s Presidential Election could catapult the libertarian and pro-Bitcoin Javier Milei into the top job, based on recent polling.
The evolving story around Bitcoin’s energy intensity and its role in powering the transition to renewables is particularly welcome alongside other pivots in the energy transition story, which we believe may have positive ramifications for Bitcoin in the longer term. The UK’s Prime Minister Rishi Sunak walked back net zero targets; Kansas opted to leave a coal-fired power plant open to supply power to a $4B Panasonic EV battery factory; and Microsoft posted a job listing for a nuclear engineer to help implement its small modular reactor (SMR) strategy amidst a dizzying rally in spot uranium prices. We believe the more the world pivots to a “more is more” mindset with regard to energy consumption, the better for Bitcoin.
Of course, the opposite is still possible. The UK’s just-passed privacy laws make internet platforms – including metaverse protocols - liable for user speech. This development has prompted Whatsapp, Signal, and Apple to threaten to withdraw from the UK market if the law is not amended to protect end-to-end encryption. There are also legitimate questions about how decentralized exchanges and protocols could even possibly comply with such monitoring requests, let alone satisfy GPDR requirements to delete customer data, which is immutable on open-source blockchains. If and as crypto-enabled social apps like Friend.tech become more relevant, this debate could heat up further. To put a point on these additional friction “taxes” that crypto & other encrypting intermediaries are facing in some jurisdictions, Chase Bank just started banning transfers to crypto exchanges in the UK, presumably to comply with the new consumer protection regulations just recently enacted. And anti-AI luddites are starting to measure ChatGPT queries regarding water & electricity consumption. So far, the US has avoided such legislation along with other “progressive” proposals that seek to define digital asset node operators and validators as “brokers.” That could change.
Still, we have recently observed Bitcoin’s correlation with Donald Trump’s odds of winning the presidency (as measured by PredictIt) rising. We think such a heightened relationship currently reflects the markets’ optimism that the US can avoid Senator Elizabeth Warren’s setting White House financial policy in a Biden second term via a strong Republican showing at the ballot box next November. The stakes are high and rising.
Layer 1s
Smart contract platforms ended the month flat after a month characterized by fears of FTX asset liquidation, continued regulatory limbo, low DEX volumes, and substantial reductions in total SCP fees. For the month, Notable outperformers among layer 1 coins were TRON (+12%) and ATOM (+2%), while major losers were AVAX (-9%) and SUI (-11%). On-chain activity fell sharply in September as DEX trading fees and crypto volatility continued their downward trend, making life tough for market makers and exchanges. Ethereum fees fell -32% month-to-month, while other chains like Polygon’s ZK chain are down 70% vs. August.
FTX news was a major negative catalyst as on September 13, FTX’s liquidation estate was permitted to sell up to of its cryptocurrencies. Initially, they were authorized to liquidate $50M weekly, but with the new approval, they are now allowed to sell $100M weekly. FTX owns over $3.4B in digital assets, of which $1.16B is in SOL, $560M is in BTC, and $192M is in ETH. The SOL tokens represent nearly 15% of floating SOL, which represents between 3-6 days of total SOL trading volume. However, 67% of those SOL tokens are locked until 2025, which will limit the immediate price impact of those sales on spot markets.
SCP Daily Fees vs Daily DEX Volume
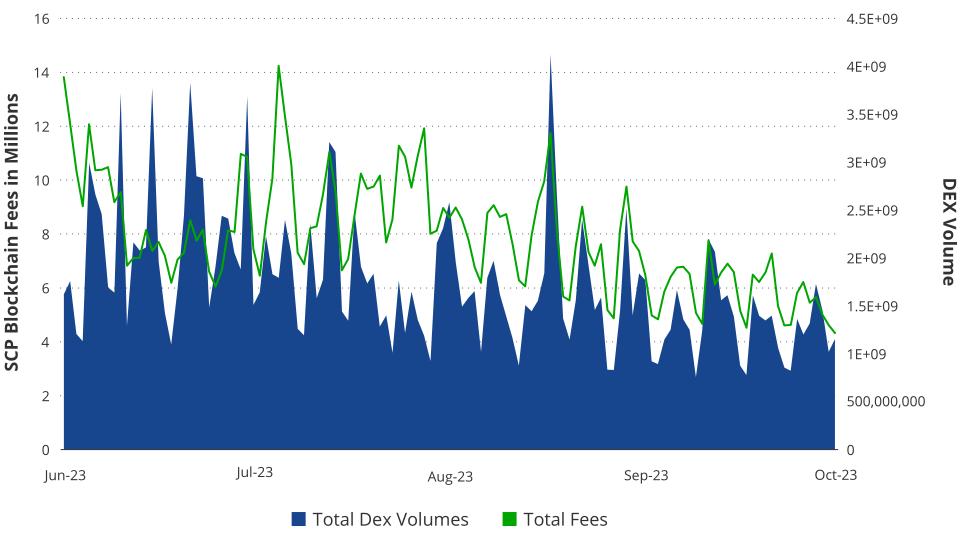
Source: Artemis XYZ as of 10/1/2023. Past performance is not indicative of future results. Not intended as a recommendation to buy or sell any of the names mentioned herein.
Implied 30-day volatility for ETH fell back to 29%, just a few notches above its low of 26% reached on August 13, 2023. Falling volatility has been a trend across all markets, with call-selling ETFs like JEPI (JPMorgan Equity Premium ETF) attracting $12B inflows this year alone and attracting copycats like BALI (Blackrock Advantage Large-cap Income ETF), which just launched last week. Thus, it’s unclear how much of the falling volatility in the space is due to structural vs. cyclical and crypto-specific reasons.
Implied 30 Day Volatility - Stocks, Bonds, Crypto
Source: Artemis XYZ as of 9/28/2023. Past performance is not indicative of future results. Not intended as a recommendation to buy or sell any of the names mentioned herein.
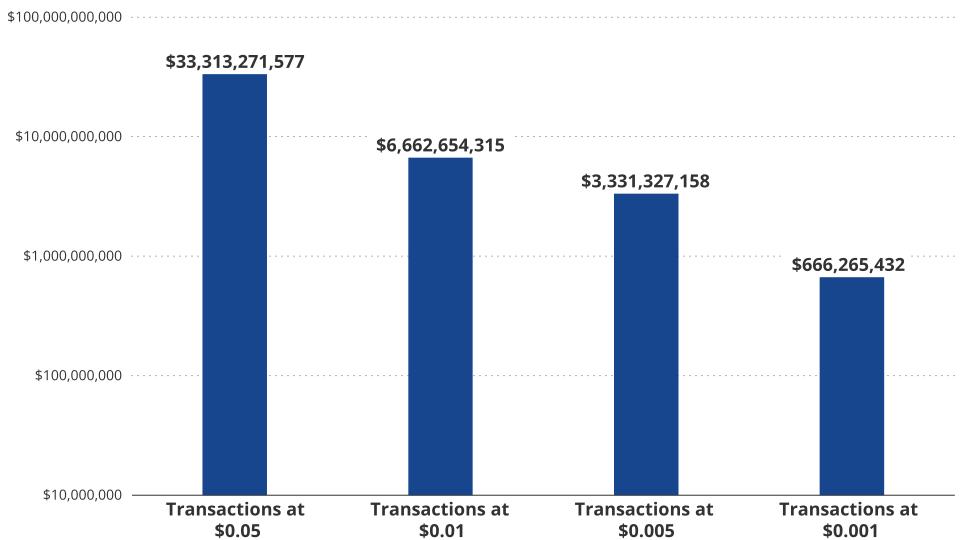
However, under the surface bubbled more positive news from corporations announcing crypto endeavors, interesting project developments, and new incentivized marketing campaigns. The most important development for crypto from the corporate world came on September 7 when Visa announced it would be using Solana to supplement Visa’s . In the new offering, Visa is running a pilot with important acquirers Nuvei and Worldpay to settle USDC on the Solana blockchain in under 0.5 seconds at the price of $0.00025 each. The pilot would follow the success of Visa’s similar using Ethereum with Crypto.com. The potential of Visa’s new arrangement could be immensely beneficial to Solana by bringing a new source of transactions, users, and application developers and necessitating entities to buy SOL tokens to use the Solana network.
Total Payments Revenue Opportunity, Less China
Source: Federal Reserve, VanEck Estimates as of 9/28/2023. Past performance is not indicative of future results. Not intended as a recommendation to buy or sell any of the names mentioned herein.
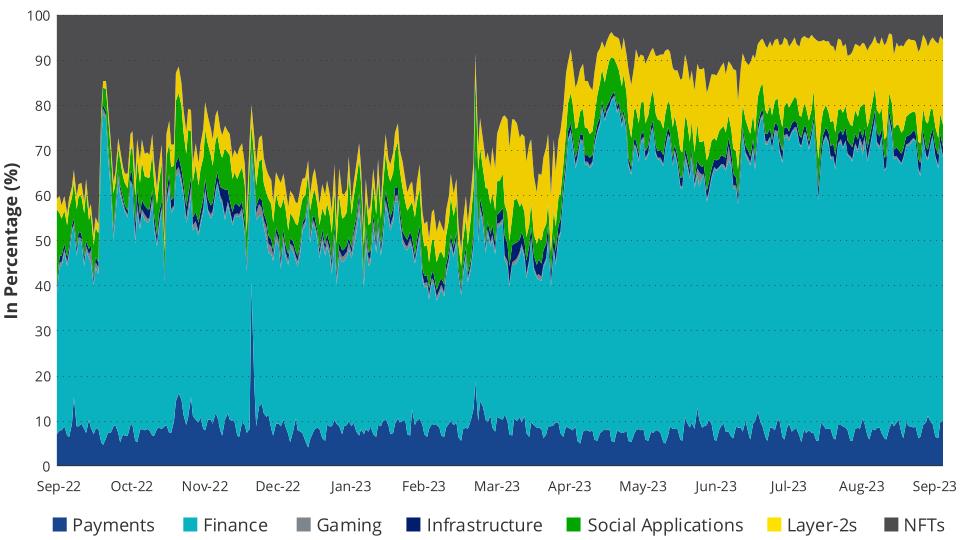
To unpack Solana's potential, we estimate the number of annual payments across all mediums. Using data from the US Federal Reserve (Fed), we calculate that the total number of payments made across the globe each year is ~1T transactions or 629B less China. Therefore, we estimate the TAM revenue opportunity for payments on Solana will be between $666M and $3.3B, as the average fee on Solana will likely be between $0.005 and $0.001. However, this figure vastly understates the potential benefits to Solana because the impact on Solana’s ecosystem will transcend the payment revenue opportunity alone. With the introduction of payments will come many new users, application developers, and institutional attention. As a result, businesses can deploy value-added services to payments, such as banking, asset management, identity, marketing, and social media. If Solana replicates Ethereum’s distribution of revenues from payments and associated services, payments would only represent around 5% of Solana’s revenues. Extrapolating this, we find that the total revenue opportunity for Solana could be between $13B and $66B vs. our base case for ETH revenues of .
Ethereum Revenue by Business Line
Source: Artemis XYZ as of 9/19/2023. Past performance is not indicative of future results. Not intended as a recommendation to buy or sell any of the names mentioned herein.
Another way to consider the impact on Solana is to assess the value unlocked for merchants switching to payments using Solana-hosted stablecoins over credit cards. While the credit card experience is simple and costless for many consumers, it is grossly expensive to those who accept it. Ideally, the merchant would prefer as many customers as possible away from credit cards to avoid substantial merchant charges. Merchants currently pay around 2-3% of their GMV of sales to the ecosystem of credit card businesses. At the same time, the consumer receives around 1% of the GMV back in the form of credit card points and benefits. In a new system where Solana USDC payments are used in lieu of credit card payments, merchants could work with Circle (the USDC stablecoin issuer) to rebate a portion of the savings to consumers through a new points system or even using direct payments in USDC. And because this would all be accomplished on Solana, those funds would be instantly received right after purchasing the product or service. We will expand on this potential in an upcoming payments piece to further underline the potential stablecoins have for merchants, blockchains, and consumers.
In terms of important technical developments for open-source blockchain protocols, the most important in the month of September may have been Circle’s blitz to enable native USDC on five blockchains and Google Cloud’s expansion of blockchain support to include Polygon, Tron, Arbitrum, and Bitcoin Ordinals. After Circle’s new integrations, USDC is now natively available on Base, Polkadot, NEAR, Cosmos, and Optimism. Before this development, USDC was only available as a wrapped bridge asset where a user had to lock USDC on smart contracts on Ethereum and mint a representation of it on another blockchain. This presented many issues as each blockchain has dozens of bridges with different levels of security. This means that each bridge mints a different version of USDC, which is not interchangeable. In some ecosystems, like Polkadot, there were nearly a dozen versions of USDC – each belonging to a different bridge. Most critically, in this wrapped asset arrangement, many hacks could and did happen of the bridges, which allowed hackers to unlock and steal the locked USDC on Ethereum, which rendered wrapped assets on other blockchains worthless. Native USDC is a substantial development for all blockchains that host. It enables users to bridge stable liquidity and traders the ability to enhance market-making activities.
ATOM (+3.13%)
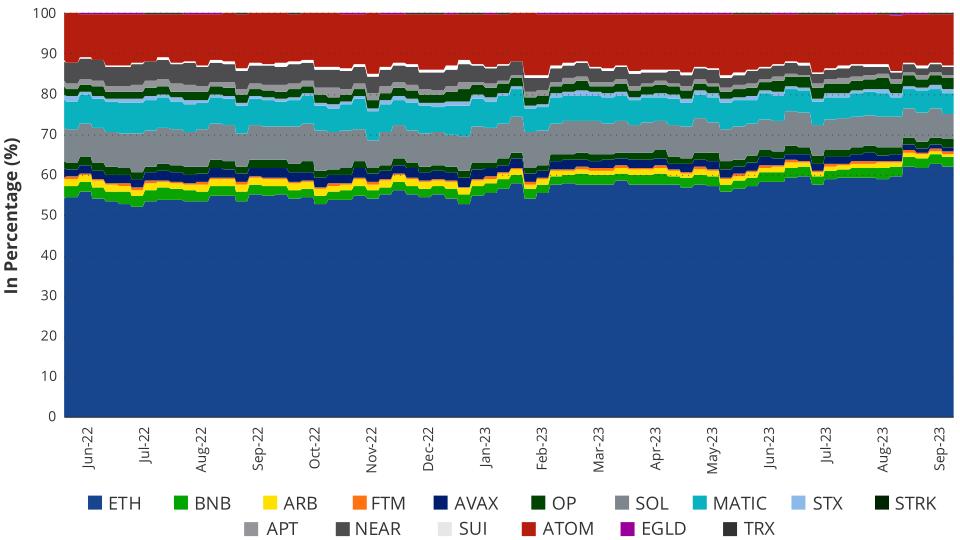
Cosmos Developer Market Share
Source: Artemis XYZ as of 9/27/2023. Past performance is not indicative of future results. Not intended as a recommendation to buy or sell any of the names mentioned herein.
After persistent monthly underperformance over the past few months, ATOM was able to find footing in a down market to provide a positive return for the month of September (+3.13%). The biggest news for the ecosystem was one that is evolving in tandem. First, the launch of USDC occurred with Noble chain integrating into Circle. This will allow Noble to mint USDC and send it across IBC, a very secure form of interchain asset transfer, to the that make up the Cosmos. Native USDC issuance is the precipitating cause of dYdX chain moving to the Cosmos. Until native USDC was live in the Cosmos, dYdX would not upgrade to v4, which is its standalone blockchain in the Cosmos. The dYdX migration will now occur, which is massively positive for the Cosmos ecosystem. It is the most important decentralized derivatives exchange and will bring its $343M in liquidity to the Cosmos. A third dimension to this positive news for the Cosmos is that Noble is speculated to be joining the Cosmos Hub, which would provide direct value accrual of Noble’s financial activities to the ATOM token.
Another important development in the introduction was the announcement of MetaMask snaps integrating Cosmos blockchains. Previously, Cosmos blockchains would need to use Cosmos-specific wallets and could not use Ethereum wallets like Metamask. As a result, Cosmos usage was illusive to users of MetaMask, who were wedded to its application experience. With snaps, Metamask’s monthly active users can now use Metamask in the Cosmos. Other positive news for the Cosmos included the creation of a liquid staking module on the Cosmos Hub, the announcement of a Celestia airdrop, and the announcement of a roadmap to introduce IBC to new blockchains through initiatives such as integration in the . Finally, another positive development is an increased usage of ATOM to pay for transactions on blockchains in the Cosmos. For example, in September, 14% of all transactions on Osmosis were paid for using ATOM.
Tron (+12.42%)
stUSDT
Source: DefiLlama as of 9/28/2023. Past performance is not indicative of future results. Not intended as a recommendation to buy or sell any of the names mentioned herein.
Tron had another stellar month despite seeing a (+4%) drop in daily active users amid a roughly flat month-to-month reading on fees at (+0.4%). The total value locked on Tron continues to inch up, up around (+8%), as other blockchains like Ethereum (-8%) and BNB (-7%) reported down figures. Tron also continues to see an average USDT of around . This $10B figure compares to Ethereum, which averages $14.5B daily in stablecoin volumes. Tron continues to demonstrate a strong product market fit for payments using stablecoins.
A big driver of the TVL increases is the stUSDT application, which accepts USDT in return for a fixed yield denominated in USDT. After only 11 weeks of operation, stUSDT has grown to $1.8B in USDT locked. While this clearly demonstrates demand for its project, details on how and where the funds are invested are scant. While the protocol claims to invest in real-world assets that produce yield, little is known about its risk exposure other than cryptic releases claiming to where it is invested, but not precise CUSIPs nor who custodies those assets. According to its site, USDT “staked” USDT yields 4.6% per year, corresponding to the yield on a US Treasury 10-year Note.
AVAX (-7%)
DEX Volume 30 Day MA vs DAUs
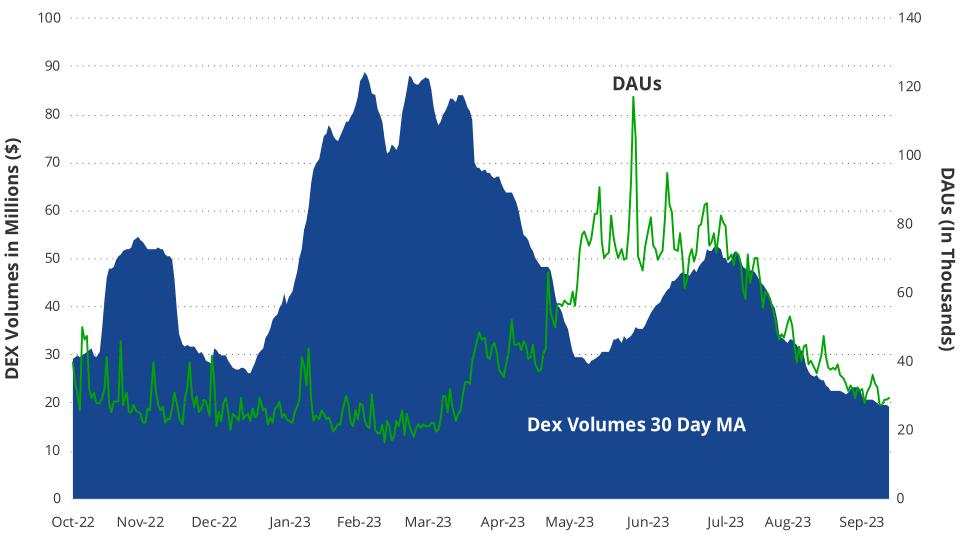
Source: Artemis XYZ as of 9/27/2023. Past performance is not indicative of future results. Not intended as a recommendation to buy or sell any of the names mentioned herein.
Avalanche continues to demonstrate a collapse in usership and activity on all its blockchains. Avalanche lost the third most DAUs among SCPs as it churned (-34%) of its daily active user base in September compared to August. In terms of fees, Avalanche earned (-45%) less fees, which was the second worst decline among the SCPs we track. Weekly active developers on Avalanche have dropped to 28, compared to 165 for Solana and 125 for Polygon. Avalanche’s active developer count is down (-34%) month to month and down (-70%) from September 2022. Of Avalanche’s 53 chains, the only mildly successful subnet is the JEWEL DFK Subnet, which earns around $1k-$3k daily in fees on 300-500k transactions.
Despite poor on-chain activity, Avalanche recently released upgrades to its software development kit, called the “Hyper SDK,” that enables users to create blockchains capable of 143k TPS. This monumental figure compares well to Solana’s 50k TPS claims and dwarfs Ethereum’s current estimated 200-300 TPS. In September, Avalanche also announced the launch of Firewood, which claims to revolutionize blockchain storage. Storage, or the ability to keep a record of historical transactions of a blockchain, will increasingly become an issue as blockchain persists. The longer blockchain’s exist, the more data it takes to hold all blockchain records. This record is important because if a new node wants to join the network, it needs to sync to the current state of the blockchain by downloading the entire history. As networks grow, this could become a multi-day or multi-month activity. A solution is needed to enable new nodes to join a blockchain network. In September, Avalanche also quietly acknowledged that its developer ecosystem is terminally ill and, to address this, has launched an academy to teach programmers how to become blockchain application creators.
Avalanche’s long-term strategy is to create a multi-blockchain network whose value is secured by the AVAX token. This was premised on creating a framework for others to build blockchains, an SDK, that would bring new ideas, users, and fees to Avalanche’s growing blockchain web. It was also supposed that Ava Labs, the entity that developed the software that runs Avalanche, would be paid consulting fees to build these Avalanche blockchains for outside parties. When Avalanche launched in September 2020, it was staffed with some of the sharpest academic minds in blockchain protocols and marketed itself as a faster version of Ethereum.
Avalanche’s blockchain eventually became a financial success in the fall of 2021 on its in-house developed EVM blockchain, called the C-Chain. At its peak, the C-Chain held more than $10B TVL locked in its smart contracts, boasted $1M in fees per day, and consistently held over 100K DAUs. In September 2023, those figures had dwindled to $500M in TVL, $11k per day in fees, and 34k daily active users.
The reason for this decline is manifold but mostly relates to the implosion of Avalanche’s chief backers, the dastardly Three Arrows Capital, and Avalanche’s lack of product differentiation becoming painfully clear in a bear market. Avalanche has never been able to capitalize on its unique architecture, and many of the projects that were built during Avalanche’s early days were shoddy copies of Ethereum projects (that were often copies of other projects). Avalanche’s initial user base came mostly from the more financially adventurous and curious Ethereum user base. At its peak, $6B, around 60% of Avalanche’s peak TVL of $10B, came directly from Ethereum users. As the bear market gripped crypto amid the implosion of Three Arrows Capital and Luna, it became clear that Avalanche usage was geared to speculation on use cases that never materialized and developers who abandoned their projects once Three Arrows Capital and related VC funding dried up. At the same time, the explosion in usership amongst Ethereum L2s like Arbitrum, Base, and Optimism has taken away many users and much capital from Avalanche.
Though we have great confidence in the technical abilities of Avalanche, we are unsure if Avalanche will be able to use its strong marketing talent to bring in the enterprise customers needed to revitalize Avalanche’s chain of chains, additionally, with a rapidly vaporizing developer base and a crop of VC capital migrating away from all but the top projects in crypto, its hard to be bullish on the long term prospects of Avalanche. Avalanche does not have the sticky coder base nor the backing of Jump Capital to create a 1M TPS chain, and it also lacks the thriving ecosystem of developers and capital that Ethereum retains. That said, anything could happen in a bull market, and we continue to see Avalanche announce fascinating technical solutions to complex blockchain problems. But until it gets applications that bring in new users, AVAX will suffer accordingly.
SUI (-15.4%)
SUI TVL and Daily Active Users
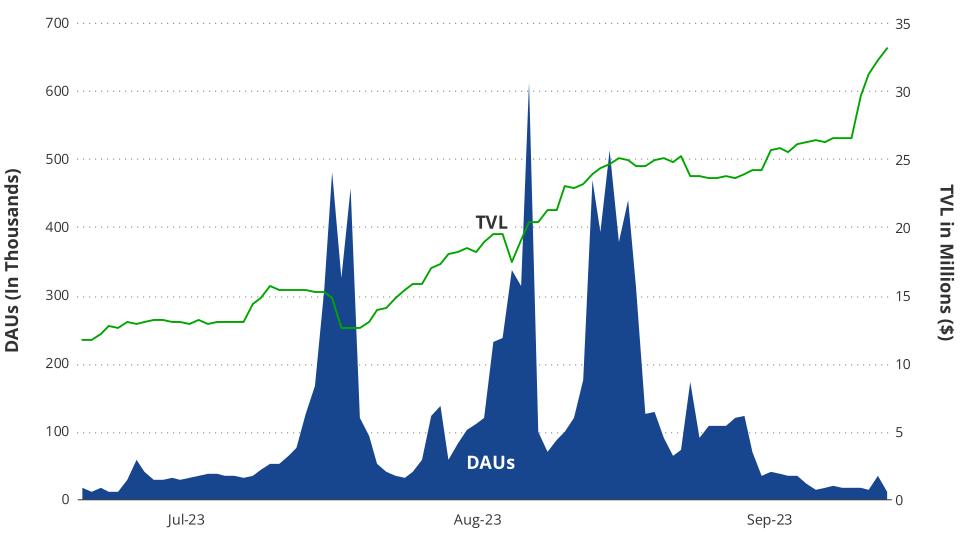
Source: Artemis XYZ as of 9/30/2023. Past performance is not indicative of future results. Not intended as a recommendation to buy or sell any of the names mentioned herein.
SUI was the weakest token amongst SCP tokens in September, and this decline resulted from sagging on-chain activity and persistent, substantial token unlocks. SUI’s blockchain saw the third worst decline in users (-36%) and the highest drop in transactions (-42%) among SCPs.
From the standpoint of unlocks, the current floating supply of SUI is worth roughly $352M, and in the month of September, 70M tokens worth ~$36M were unlocked. Going forward, a further 70M tokens will be unlocked monthly between June and August 2024 when unlocks of over 1B tokens occur. As a result, the token supply will grow 197% over that period of time. While some would contend that the market prices in these supply inflows and that much of the supply will not be sold for years, even if only 10% of this supply is sold, it would amount to multiples of the current daily active volume for the SUI token. Most likely, that selling would cause substantial price declines.
While SUI has enormous transaction throughput potential, which was as high as 60M transactions per day in late July, its financial viability is premised on tremendous blockchain usage. Currently, transactions cost roughly $0.0004. This implies that the current revenue of the chain is approximately $200-$400 per day. While it is not uncommon for start-ups to lack revenues, it is quite uncommon to see them command fully diluted valuations of $4.5B.
SUI’s focus has been on creating a blockchain to enable high throughput to enable consumer use cases that demand lots of transactions per second. To that end, SUI claims to be able to process up to 297k TPS, which should be more than enough blockspace supply to satisfy most use cases. This technical feat is accomplished by a combination of SUI's unique programming language, Move, and a more computationally efficient virtual machine. Unlink Ethereum enables SUI to parallelize the processing of many transactions simultaneously, which massively speeds up throughput.
As a result of SUI’s consumer focus, it has sought to simplify the user experience for both the account holder and the developer. In September, SUI announced zkLogin, eliminating the need for account holders to maintain private keys. The new setup allows SUI users to log into Web3 dApps with their Google, Twitch, and Facebook credentials. This is a massive user improvement over that offered by Ethereum and others, where users have to maintain seed phrases to keep backups of their accounts. Sui has also formed important partnerships with gaming companies, and in September, SUI announced partnerships with NHN, an important mobile game developer out of South Korea. Going forward, SUI will need to see these initiatives blossom into substantial usage of its chain, or it will wither due to selling pressure.
DeFi
The Market Vector Decentralized Finance Leaders index displayed remarkable resilience in September, +13%, surpassing ETH’s 1% gain as investors gravitated towards assets such as MKR and AAVE, which returned 40% and 14% respectively. These protocols have spearheaded the drive to bring Real World Assets (RWA) onto the blockchain, a narrative which, with T-bills at 5%, continues to attract investors across the space. The RWA narrative has ignited enthusiasm among DeFi enthusiasts, who view it as the first big step in bringing traditional financial instruments on-chain since the inception of stablecoins and potentially paving the way for a composable financial world in the future. Notably, the establishment of the Tokenized Asset Coalition, comprising Aave, Centrifuge, Circle, Coinbase, Base, Credix, Goldfinch, and RWA.xyz, represents a groundbreaking partnership encompassing both centralized and decentralized actors with a collective mission to integrate traditional financial assets into the realm of DeFi.
Centrifuge, notably, demonstrated remarkable performance this month, with CFG rallying 42%. This surge followed an announcement at the Real World Asset Summit that Centrifuge would build infrastructure for an RWA lending market on Aave. This market will enable DAOs to acquire tokenized short-duration U.S. treasury bills through Centrifuge’s permissioned liquidity pools and deposit the assets into Aave, allowing DAOs to borrow USDC against their interest-bearing deposits. The initial funding for tokenized RWA pools will come from the Aave treasury, providing access to the ~5% yield generated by overnight financing of U.S. treasury assets. Furthermore, adopting RWAs on Aave could potentially boost the utilization of Aave's stablecoin GHO. This should be top of mind for Aave governance as GHO has witnessed lackluster adoption since its inception earlier this year, with a market capitalization of only $22 million despite its relatively low borrow APR of 2.5%. These emerging markets should also allow MakerDAO the capability to borrow stablecoins against their RWA deposits.
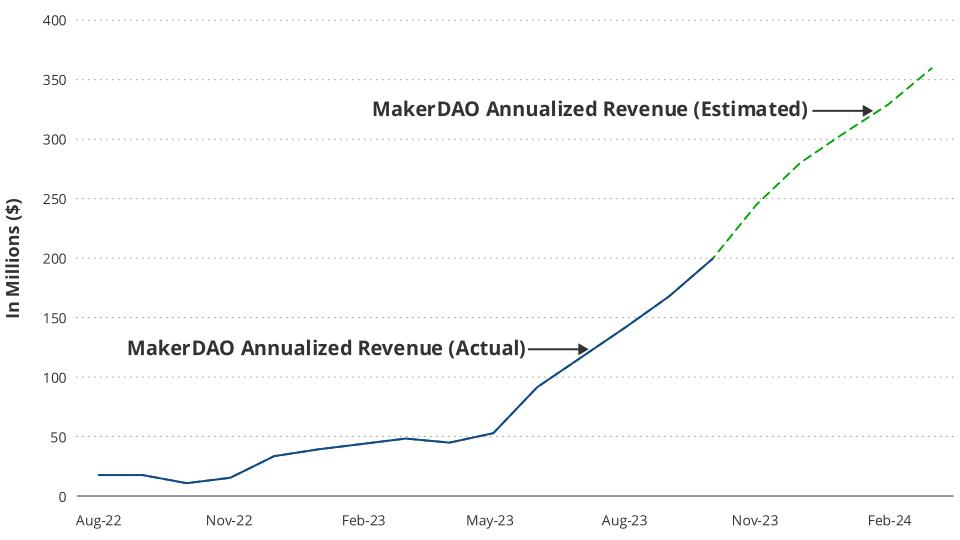
Source: Makerburn.com, VanEck research as of 9/29/23. Past performance is not indicative of future results. Not intended as a recommendation to buy or sell any of the names mentioned herein.
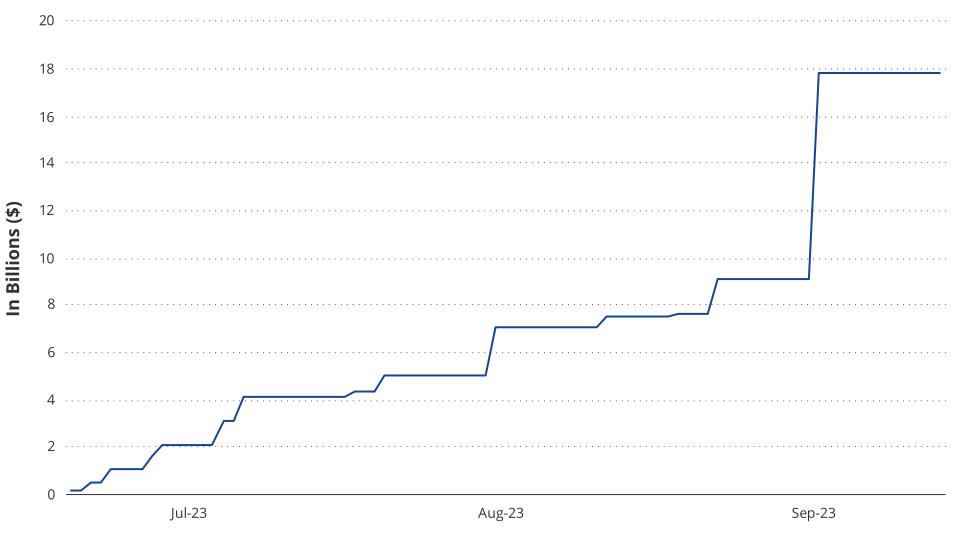
Towards the end of the month, MakerDAO initiated a poll to raise the debt ceiling for their two most extensive U.S. treasury bill vaults, Monetalis Clydesdale and Blocktower Andromeda, from $1.2 billion to $3 billion each. If this poll garners approval, passes a governance vote, and the vaults are fully utilized, the annual revenue for MakerDAO could see a staggering 84% increase, amounting to $159 million. Subsequently, these funds are slated to be used to buy back and deposit $MKR into the Uniswap V2 MKR-DAI pool. The potential expansion of on-chain liquidity and constant buy pressure played a pivotal role in driving MKR's rally over the course of the month.
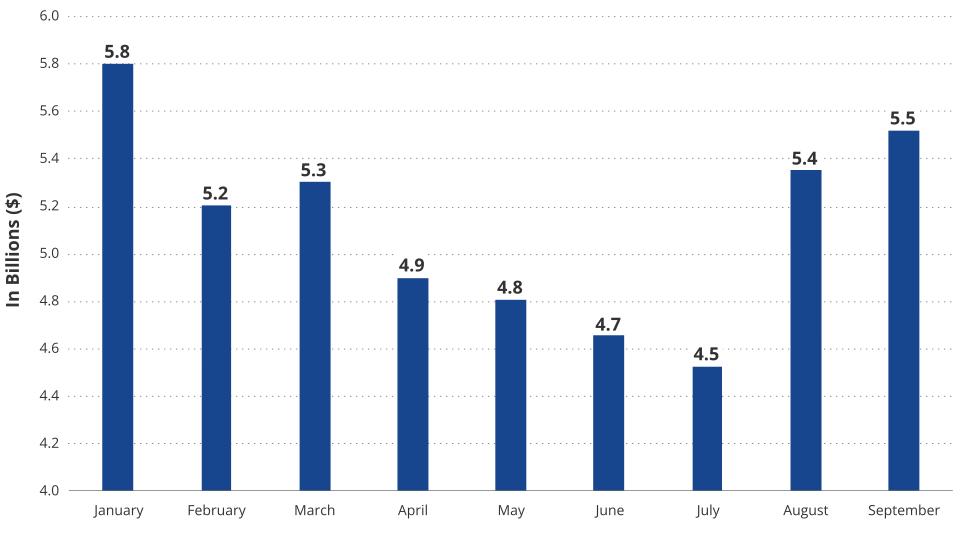
The amount of DAI deposited in Maker’s DAI Savings Rate (DSR), which pays depositors 5% APR, rose 23% to $1.65 billion. This boosted DAI’s supply to a 6-month high of 5.5 billion, potentially indicating that the bottom is in for DAI as it continues its supply trend reversal from its bear market low in August of 4.4 billion. Additionally, Spark protocol voted to raise the DAI borrow limit on the platform 100% to $400 million after demand for borrowing DAI reached its governance-approved $200 million ceiling.
DAI Market Capitalization Growth Continues
Source: Makerburn.com, VanEck research as of 9/29/23. Past performance is not indicative of future results. Not intended as a recommendation to buy or sell any of the names mentioned herein.
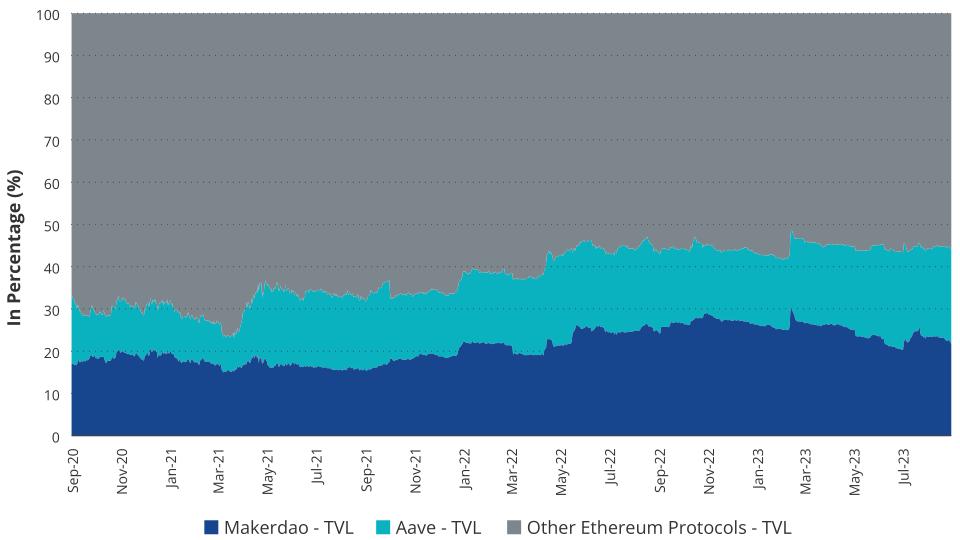
While the RWA narrative has acted as a favorable tailwind for major DeFi assets in this sector, on-chain economic activity has struggled overall. Decentralized exchange volume dwindled this month, experiencing a decline of 30% to $40 billion. Meanwhile, the total value locked in DeFi slightly grew, rising 1.7% to $38.46 billion. However, with the strides made to bring tokenized RWAs on-chain, we foresee significant consolidation in the space, with Maker and Aave expected to capture most of these assets and see their share of the total value locked in DeFi rise accordingly.
Ethereum DeFi TVL: Further Consolidation Expected
Source: Artemis, VanEck Research as of 9/29/2023. Past performance is not indicative of future results. Not intended as a recommendation to buy or sell any of the names mentioned herein.
CRV Rallies After Egorov Repays Aave Debt and Whale Locks CRV on Convex
The Decentralized Finance Leaders index also received a significant boost from the robust rally of CRV, which rebounded by 15% during the month. This resurgence comes after CRV faced a downturn in the aftermath of the Vyper compiler exploit in July. The rally in CRV was further facilitated by Michael Egorov's decision to fully settle his debts on Aave and transfer his assets to other lending platforms, where he anticipates a less aggressive approach to managing his position. The move was prompted by Aave governance's decision to freeze the CRV market and initiate discussions on how to liquidate his position safely due to the bad debt risk it posed to the platform. Egorov's most substantial position now resides on Silo. Finance, where he has deposited $55 million worth of CRV and borrowed $17 million in crvUSD. Following this development, Silo's governance token, SILO, experienced an impressive rally of 76%, surging from $0.025 to $0.044. Furthermore, on the 21st of the month, a fresh wallet was deployed, withdrawing 19.9 million CRV from Binance and using it to acquire Convex's liquid-locker product, cvxCRV. At the time of this purchase, cvxCRV had been trading at a discount relative to its peg, and this purchase signaled strong conviction from the whale that CRV would continue to play a pivotal role in DeFi.
DeFi Protocols Facing CFTC Scrutiny
Opyn, Inc., Deridex, Inc., and ZeroEx, Inc. (0x) were accused by the Commodities and Futures Trading Commission (CFTC) of unlawfully providing leveraged and margined retail commodity transactions in digital assets through their DeFi protocols. Opyn and Deridex are also facing charges for functioning as unregistered swap execution facilities, undertaking activities restricted to registered futures commission merchants (FCMs), and neglecting to carry out know-your-customer (KYC) due diligence. The entities did not confess to or dispute the accusations; however, they have consented to settle by paying fines of $250,000 (Opyn), $100,000 (Deridex), and $200,000 (0x).
The case involving 0x carries potentially broader implications within the DeFi space. Unlike the other projects that faced regulatory actions, it is essential to note that the assets in question were not issued by 0x but rather by a third party. This underscores the regulatory stance taken by the CFTC, which seeks to establish accountability for DeFi projects in relation to the assets traded on their platforms, irrespective of whether these projects exercise direct control over the assets in question. Within this regulatory framework, protocols such as Uniswap may find themselves subject to scrutiny. Notably, the deployment of liquidity pools on the Uniswap platform is characterized by its permissionless nature. Consequently, should these pools involve assets that the CFTC deems necessitate KYC verification, Uniswap Labs could potentially face similar allegations from the CFTC. This highlights the increasing regulatory landscape within the DeFi sector, which investors should closely monitor, especially considering DeFi’s latest push to bring more tokenized securities on-chain.
Friend Tech & Clones Drive the SoFi Frenzy
Friend.Tech Protocol Fees Dominates Clones
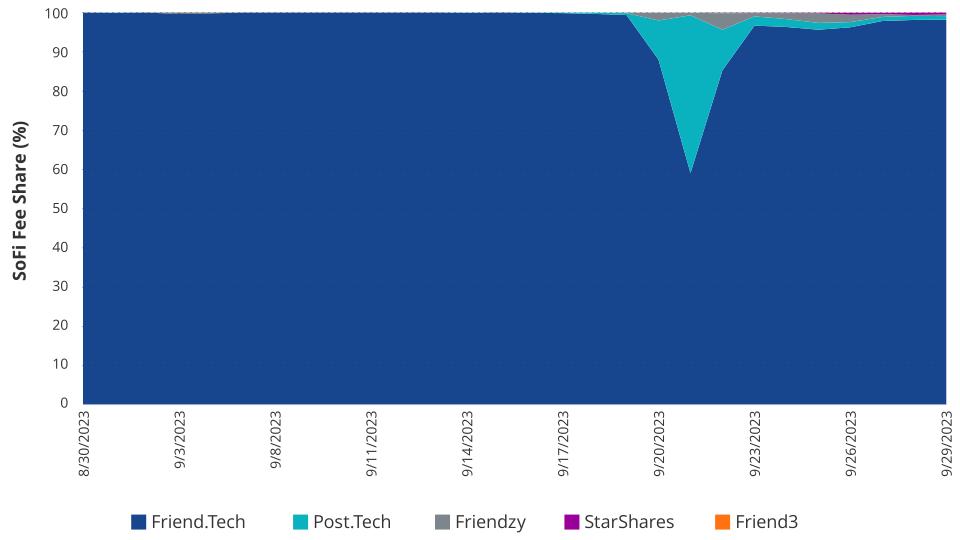
Source: Dune: @Cryptokoryo as of 9/29/2023. Past performance is not indicative of future results. Not intended as a recommendation to buy or sell any of the names mentioned herein.
Friend.Tech, the social-finance (SoFi) app on Base, continued to see accelerated adoption this month, with unique users growing from 128k to 284k throughout the month. The impressive user growth has caused developers to create clones of the SoFi app on other chains in hopes of seeing a similar uptake in adoption. Post.Tech, Star Shares, Friendzy.gg, and Friend3.group were deployed this month on Arbitrum, Avalanche, Solana, and BNB Chain with slightly tweaked features, but all essentially doing the same thing as Friend.Tech. However, of the Friend.Tech clones, only Post.Tech has seen significant usage. Friend. Tech demonstrates the importance of being the first to market and the moat it creates, as it commands a 96% share of the protocol fees generated by SoFi platforms.
Friend.Tech Key Volume Outpaces Ethereum NFT Volume
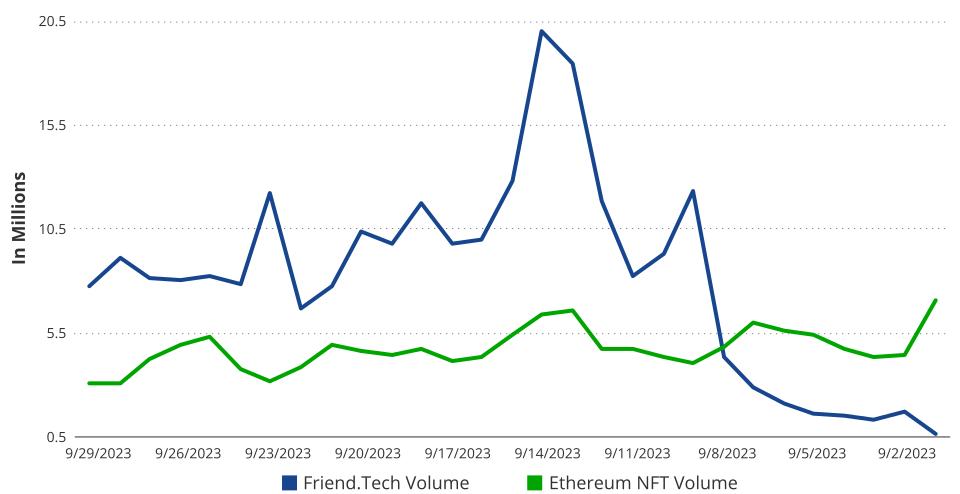
Source: Dune: @21co, VanEck Research as of 9/29/2023. Past performance is not indicative of future results. Not intended as a recommendation to buy or sell any of the names mentioned herein.
Impressively, the volume generated by trading of Friend.Tech shares exceeded NFT volume on Ethereum for most of the month due to the illiquidity of the Friend.Tech key market. Friend.Tech allows traders to flip their key purchases for a profit much faster than in NFT markets because a pricing curve dictates the price. For example, if one were to buy a key from a user that had 100 keys, this would change the price per key by ~2%. This differs from the NFT market, where most projects have a multitude of NFTs sitting at the floor price, meaning it would take significantly more purchases on average to cause a meaningful change in the floor price. For this reason, we theorize many NFT traders have transitioned to the Friend.Tech market due to the drastically higher volatility.
Friend.Tech Key Pricing Curve
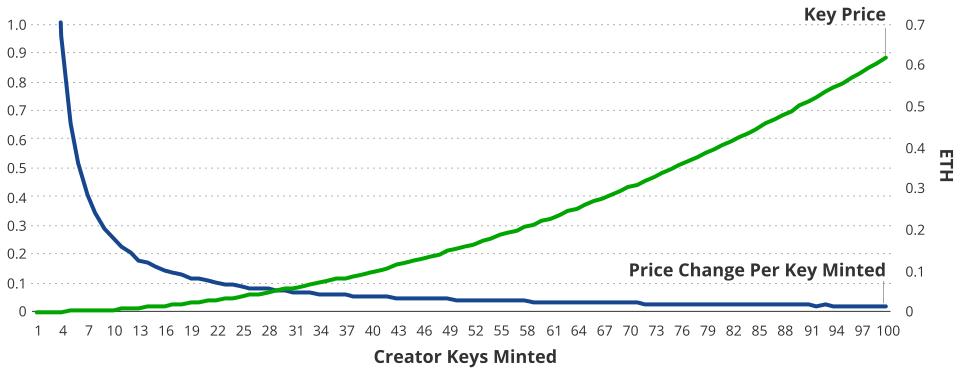
Source: Dune: @21co, VanEck Research as of 9/29/2023. Past performance is not indicative of future results. Not intended as a recommendation to buy or sell any of the names mentioned herein.
Metaverse
The Market Vector Media and Entertainment Leaders index declined 6% in September, continuing to underperform ETH and BTC. APE had the worst performance of the index components, falling 18%, while SAND only declined 5%. MANA was the only index component that saw positive price action this month, rising a mild 1.5%. APE’s underperformance comes despite an 8% rally at the end of the month after Yuga Labs released Legends of the Mara, an idle trading card game set in Yuga’s metaverse, The Otherside. The Mara NFTs are also only tradeable on the X2Y2 marketplace, a result of OpenSea’s decision to sunset their operator filter contract in February, allowing creators to have royalties enforced on the platform. In the days following the launch, X2Y2 rocketed 30% but finished the month down 24%.
NFT Volume Continues to Collapse
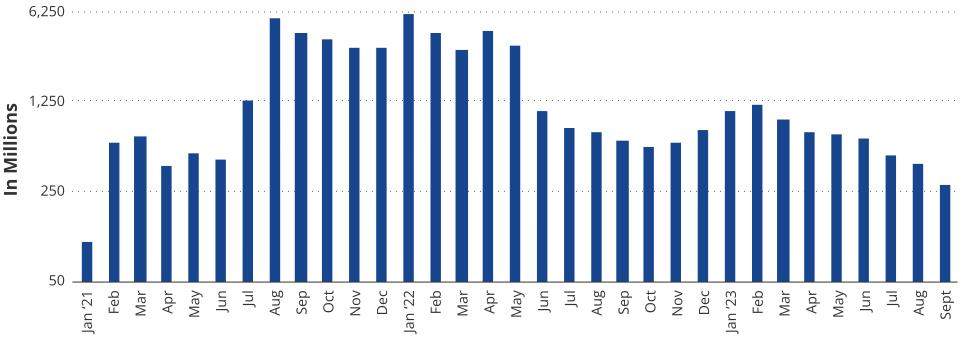
Source: Cryptoslam! as of 9/29/2023. Past performance is not indicative of future results. Not intended as a recommendation to buy or sell any of the names mentioned herein.
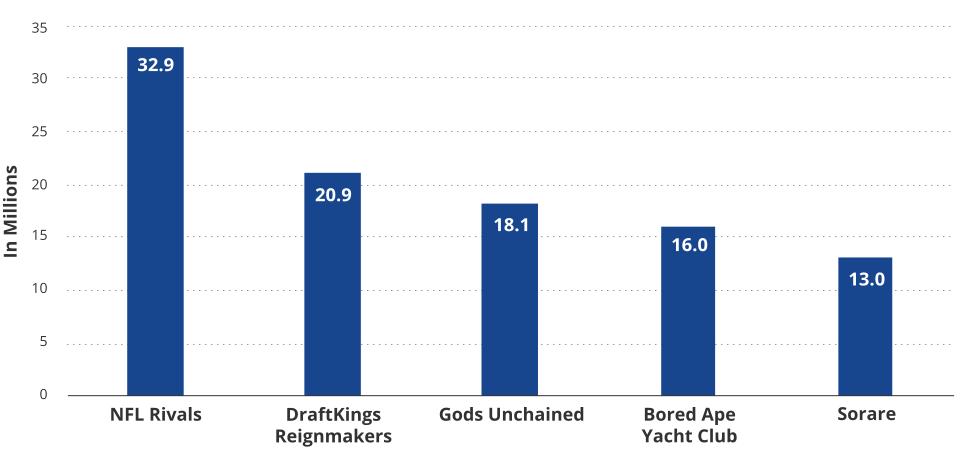
Top NFT Collections in September by Volume
Source: Cryptoslam! as of 9/29/2023. Past performance is not indicative of future results. Not intended as a recommendation to buy or sell any of the names mentioned herein.
NFT volumes have continued their descent, experiencing a decline of 32% to $285 million. This drop marks the lowest levels observed in over two years, reflecting a waning appetite among investors in the sector. Blur has maintained its position as the top NFT exchange by volume traded with $125 million of volume, while OpenSea followed with $58 million of volume. Despite its continued dominance, due to the lack of any value accrual mechanism, $BLUR price still declined X% this month. This is also likely driven by investors speculating that successful NFT collections will only let their NFTs trade on platforms where they can still collect royalties on their sales, as was the case with Yuga’s Legends of the Mara collection.
However, amidst this general decline, specific areas within the market continue to exhibit bullish sentiment. Notably, select gaming NFTs have managed to sustain significant attention. This trend is evident in gaming NFT collections consistently dominating the NFT volume rankings. Collections such as Mythical Games' NFL Rivals, DraftKings Reignmakers, Sorare, and Gods Unchained have consistently secured positions within the top 5 NFT collections by volume. It's worth noting that these NFTs typically have lower price points, so they do not generate massive volumes from just a few high-value sales. But what they may lack in high prices, they more than compensate for in user retention and ongoing expenditure.
Given their speculative nature, the key takeaway is that high-priced NFTs with no utility beyond use as a profile picture rely on bull markets to maintain high sales volumes. In contrast, gaming NFTs derive utility from their integration into gameplay, making them more akin to a purchase for entertainment value rather than purely an investment. Users appreciate these NFTs for their ability to enhance competitive outcomes in their games, and this utility-driven demand contributes to their sustained popularity.
Pudgy Penguins Walmart Partnership Leads to Price Floor Rally
Source: VanEck Research as of 9/29/2023. Past performance is not indicative of future results. Not intended as a recommendation to buy or sell any of the names mentioned herein.
This month, the Pudgy Penguins NFT collection announced that they would launch their plush toys in 2,000 Walmart stores nationwide. Each plush toy comes with a unique QR code, allowing the owner to claim a free NFT trait that can be utilized in the Pudgy World, an online social platform where users can engage with penguin avatars. This launch marks one of the first major partnerships between an NFT collection and a major retailer. The proceeds from the plush toy sales will go to LSLTTT Holdings, Inc., the company behind the Pudgy Penguins brand, run by Luca Netz. Some NFT holders showed dismay at the fact that they would not receive a portion of the revenue, while others noted that it’s a much better alternative than fundraising via dilution, as was done by the Azuki team.
Additionally, if an NFT bull market returns, having the Pudgy brand in one of the largest retailers could attract an outsized proportion of NFT buyers as investors will likely seek out NFTs with the strongest IP. The success of this collaboration will provide valuable insights into the ability of NFT brands to leverage their intellectual property and community to attract new users through NFT rewards tied to physical goods. At present, it is evident that this launch has revitalized investor interest in the NFT collection. The collection's floor price has surged by 18% this month, a noteworthy achievement, especially considering the prevailing trend of declining floor prices across the majority of NFTs.
NFT Enthusiasts Cashing Out Big on Zynga’s Free Sugartown Mint
Sugartown Oras, the inaugural NFT mint from Zynga, a renowned name in casual gaming, was distributed via a free mint on the 13th of the month on the Ethereum blockchain. This move stirred excitement among NFT enthusiasts, who promptly claimed Zynga's initial venture into the web3 realm within the first hour of launch. Their enthusiasm was well-placed, as these free NFTs are currently trading at a floor price of 0.25 ETH, equivalent to $400. Zynga has intentionally maintained a shroud of secrecy around their upcoming Sugartown IP, revealing minimal details to create an aura of intrigue surrounding the project. This strategy seems effective, evident in the considerable prices that NFT traders are willing to pay for these digital assets. In two weeks, the Oras NFTs have recorded trading volumes exceeding $4 million, with this exclusive collection of 6,000 NFTs distributed among 2,374 distinct wallets.
Parallel TCG: A Potential Breakout Game on Base
Parallel TCG, a recently launched game on the Base blockchain, has piqued the interest of many since its beta launch in August. This sci-fi-themed trading card game allows players to align with different factions and engage in PvP battles. Notably, Parallel TCG marks the debut of the Echelon Prime ecosystem, powered by the $PRIME token, which rallied an impressive 14%, finishing the month with a $93 million market capitalization. In previous newsletters, we emphasized the importance of Web3 games, providing players with the flexibility to enjoy the game without the intricacies of blockchain management. Parallel TCG aligns with this perspective. Players seeking pure enjoyment without dealing with NFTs and web3 wallets can utilize apparition decks, which are not tradable as NFTs. However, they still enable participation in ranked games and progression through the monthly battle pass.
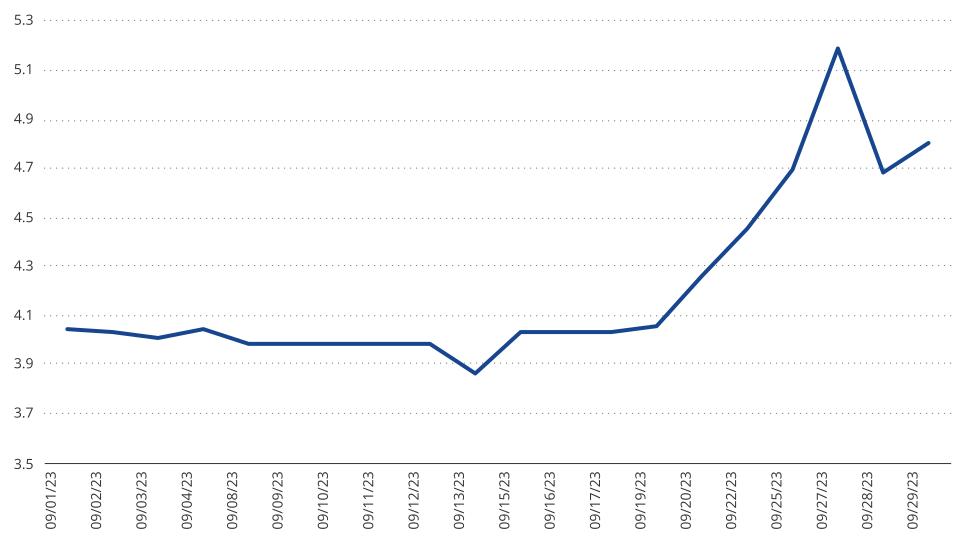
$PRIME Performance
Source: Coingecko as of 9/29/2023. Past performance is not indicative of future results. Not intended as a recommendation to buy or sell any of the names mentioned herein.
For players who opt to acquire their cards as NFTs, there's an opportunity to earn $PRIME by achieving victories in ranked matches. This incentive scales with the number of NFT cards in their deck, allowing for up to 5 wins per day. To foster a thriving ecosystem that rewards players, $PRIME is sunk into gameplay pools through various player actions, such as purchasing Glints, the non-crypto in-game currency for Parallel, which has already seen substantial user investment, exceeding $100k during the beta phase.
The pivotal factor for the success of $PRIME lies in ensuring that gameplay mechanics necessitate the sinking of $PRIME at a rate higher than the distribution rate awarded to players for winning ranked matches. Impressively, early results suggest that the team has achieved this balance. In the private beta phase, with approximately 2500 players, around 1.5 million $PRIME (equivalent to 6% of circulating supply) has been sunk, while only approximately 1000 $PRIME has been distributed to players as rewards for ranked victories. With an impressive queue of over 250k players awaiting entry into the TCG beta and support from industry giants like Paradigm, we eagerly anticipate the growth of this ecosystem in the coming months.
Additionally, Parallel Studios, the creator of Parallel TCG, has a significantly more captivating project in the pipeline. Parallel Colony, set to launch in beta within the $PRIME ecosystem by year-end or early next year, introduces AI-powered characters that players can instruct to undertake various tasks to achieve specific objectives. Utilizing ERC-6551 accounts, these AI characters can engage in economic activities, exchanging $PRIME and other digital assets to fulfill their assigned missions. We perceive this development as a groundbreaking leap in gaming, potentially capturing the broader gaming audience's attention and demonstrating the innovative possibilities that blockchain games can offer.
Singapore Leads the Charge in Web3 Adoption
In contrast to the challenging landscape for Web3 adoption in the United States, where regulatory battles with innovators persist, other jurisdictions have shown the way in accelerating the adoption of consumer-facing applications built on blockchain technology. Notably, two significant developments emerged this month in Singapore, illustrating how progressive policy approaches can foster innovation and deliver consumer cost savings.
The launch of KaiKai, a retail shopping app developed by Cosmose AI, offering cashback rewards in their Kai-ching stablecoin, generated a significant surge in daily active users (DAUs) on the Near blockchain when it was introduced in Singapore this month. This user surge was so substantial that Near now boasts more DAUs than Ethereum, Arbitrum, and Optimism combined. This development underscores the untapped potential of the global market when it comes to onboarding users onto blockchain platforms. It also highlights the immense user traffic that consumer-facing apps can channel into blockchains, mainly when they offer a seamless, user-friendly experience without requiring extensive blockchain knowledge and provide integrated wallet functionality. Over time, the increased usage should contribute positively to $NEAR economics, as 70% of the gas fees paid on the network are burned. However, despite the increased user base, NEAR still experienced a notable underperformance compared to ETH this month, with a price decline of 9%.
NEAR DAUs Surpasses Ethereum Optimism & Arbitrium Combined
Source: Artemis, VanEck Research as of 9/27/2023. Past performance is not indicative of future results. Not intended as a recommendation to buy or sell any of the names mentioned herein.
The positive news for Web3 in Singapore didn't end there. Grab, a popular app known for its ride-hailing, food delivery, and digital payment services, announced the pilot launch of its app-based wallet experience on September 17th. Grab claims a user base of over 180 million users and offers services akin to Uber in Southeast Asia. The wallet will be powered by Circle and deployed on Polygon. Notably, the app incorporates NFTs as vouchers that users can redeem for rewards within the app. This move signals ongoing support in Singapore for consumer-facing Web3 products and demonstrates the growing interest in integrating blockchain technology into everyday consumer experiences.
Links to third party websites are provided as a convenience and the inclusion of such links does not imply any endorsement, approval, investigation, verification or monitoring by us of any content or information contained within or accessible from the linked sites. By clicking on the link to a non-VanEck webpage, you acknowledge that you are entering a third-party website subject to its own terms and conditions. VanEck disclaims responsibility for content, legality of access or suitability of the third-party websites.
To receive more Digital Assets insights, subscribe for our Crypto Newsletter
Important Information
This is not financial research but the opinion of the author of the article. We publish this information to inform and educate about recent market developments and technological updates, not to give any recommendation for certain products or projects. The selection of articles should therefore not be understood as financial advice or recommendation for any specific product and/or digital asset. We may occasionally include analysis of past market, network performance expectations and/or on-chain performance. Historical performance is not indicative for future returns.
For informational and advertising purposes only.
This information originates from VanEck (Europe) GmbH, Kreuznacher Straße 30, 60486 Frankfurt am Main. It is intended only to provide general and preliminary information to investors and shall not be construed as investment, legal or tax advice. VanEck (Europe) GmbH and its associated and affiliated companies (together “VanEck”) assume no liability with regards to any investment, divestment or retention decision taken by the investor on the basis of this information. Views and opinions expressed are current as of the date of this information and are subject to change with market conditions. Certain statements contained herein may constitute projections, forecasts and other forward looking statements, which do not reflect actual results. VanEck makes no representation or warranty, express or implied regarding the advisability of investing in securities or digital assets generally or in the product mentioned in this information (the “Product”) or the ability of the underlying Index to track the performance of the relevant digital assets market.
The underlying Index is the exclusive property of MarketVector Indexes GmbH, which has contracted with CryptoCompare Data Limited to maintain and calculate the Index. CryptoCompare Data Limited uses its best efforts to ensure that the Index is calculated correctly. Irrespective of its obligations towards the MarketVector Indexes GmbH, CryptoCompare Data Limited has no obligation to point out errors in the Index to third parties.
Investing is subject to risk, including the possible loss of principal up to the entire invested amount and the extreme volatility that ETNs experience. You must read the prospectus and KID before investing, in order to fully understand the potential risks and rewards associated with the decision to invest in the Product. The approved Prospectus is available at www.vaneck.com . Please note that the approval of the prospectus should not be understood as an endorsement of the Products offered or admitted to trading on a regulated market.
Performance quoted represents past performance, which is no guarantee of future results and which may be lower or higher than current performance.
Current performance may be lower or higher than average annual returns shown. Performance shows 12 month performance to the most recent Quarter end for each of the last 5yrs where available. E.g. '1st year' shows the most recent of these 12-month periods and '2nd year' shows the previous 12 month period and so on. Performance data is displayed in Base Currency terms, with net income reinvested, net of fees. Brokerage or transaction fees will apply. Investment return and the principal value of an investment will fluctuate. Notes may be worth more or less than their original cost when redeemed.
Index returns are not ETN returns and do not reflect any management fees or brokerage expenses. An index’s performance is not illustrative of the ETN’s performance. Investors cannot invest directly in the Index. Indices are not securities in which investments can be made.
No part of this material may be reproduced in any form, or referred to in any other publication, without express written permission of VanEck.
© VanEck (Europe) GmbH
]]>