Welcome to VanEck
Select Investor Type
11 December 2023
As we're approaching the end of 2023, the cryptocurrency industry seems ready to embark on a significant transformation, signalling the start of a promising bull run. Despite the initial calmness that felt a bit like the market taking a long winter's nap at the beginning of the year, asset prices have leapt significantly. This surge contradicts any expectations of stability experienced during the first half of 2023, especially in the case of Bitcoin.
Now, let's dive into the pivotal events that have guided the path of the crypto space throughout this dynamic year.
NFTs, those unique and non-interchangeable digital assets residing securely on blockchains, found their way into Bitcoin's realm. While Bitcoin has been a veteran in the crypto sphere, its recent embrace of NFTs has proven lucrative, grossing around $401 million trading volume in November, albeit trailing Ethereum's staggering $433 million (Cryptoslam, data of 10/29/2023 to 03/12/2023). Despite lagging behind Ethereum, Bitcoin's NFT sales still outstrip those on the Solana network by nearly fourfold, amounting to approximately $97 million. The expansion of inscriptions to other networks underlines the burgeoning value of block space, emphasizing its critical role. There is an ongoing debate on how the Bitcoin Blockchain should be used, opponents of Ordinals (Bitcoin-based NFTs) declare them as spam attacks while proponents see it as part of the freedom that decentralization brings.
The finalization of MiCAR in 2023 fortified Europe's position as the global vanguard in comprehensive crypto regulation. The Markets in Crypto-Assets (MiCA) regulation aims to standardize the crypto-assets framework across the European Union. MiCA promises legal clarity for issuers, service providers, and users, bolstering consumer protection and market integrity. Additionally, it fosters a level playing field, nurturing innovation and competition among market participants.
The ascent of digitally native tokenized assets witnessed remarkable growth in 2023. The market capitalization of tokenized RWAs surged from zero to over 400M$ (Dune, data as of 10/12/2023), reflecting a monthly growth rate of approximately 6%. Their value stems from real-world assets, demand for the blockchain version of the asset, and utility within the blockchain ecosystem (for example within DeFi), a trend indicating potential future growth.
Emerging as potential alternatives to blockchain-based counterparts, non-blockchain cryptocurrencies address scalability and transaction speed constraints. The market share and user adoption of these assets have increased, with examples like Hedera Hashgraph, Nano, IOTA, Kaspa, SUI, SEI, and other smaller players gaining traction. The rise of Directed Acyclic Graph (DAG) based ledgers highlights an evolution in technology, hinting at a potential successor to traditional blockchain frameworks. This information should not be understood as financial advice for particular digital assets.
Staking, a practice embraced not only by Ethereum but also by various PoS-based cryptocurrencies, has witnessed a surge in participation. This trend stems from technological advancements, increased institutional involvement, and a quest for additional yields in a bearish market. Ethereum's staking ratio has surged from 12% to nearly 25% (Stakingrewards.com, data as of 10/12/2023), accentuating its deflationary nature and intensifying pressure on its limited circulating supply.
Airdrops in the cryptocurrency context are events where tokens or coins are distributed for free to the wallets of active members of the blockchain community, often as a promotion or reward for loyalty. They are used by new or existing projects to increase awareness, distribute tokens widely, and incentivize participation in the network. Airdrops can also serve as a way to reward early adopters or users who perform specific tasks within the ecosystem. Some of the largest airdrops that happened this year include:
| Project | Description | Airdrop in tokens and dollar value |
| Arbitrum | Arbitrum is an Ethereum layer-two (L2) scaling solution. | 1.1 billion ARB (approx. $1.5B) |
| Jito | Jito Network is a liquid staking provider on Solana | 90 million JTO (approx. $225M) |
| Blur | Blur is a non-fungible token (NFT) marketplace | 360 million BLUR (approx. $185M) |
| Worldcoin | Worldcoin is a layer-one (L1) co-founded by Sam Altman | 43 million WLD (approx. $110M) |
Source: Coinmarketcap, data as of 10/12/2023. Historic performance is not an indicator of future results. This information should not be understood as financial advice for particular digital assets.
Token unlocks refer to the scheduled release of previously locked or reserved tokens into the circulating supply of a cryptocurrency. These events are typically outlined in a project’s tokenomics and can occur at various intervals, often after an initial coin offering (ICO) or similar fundraising event. Token unlocks can impact the market by increasing the available supply, which may affect the token’s price depending on the demand. Thanks to Blockchain's transparency, anyone can access this information.
| Project | Description | Tokens unlocked and dollar value |
| Aptos | Aptos is a Layer 1 Proof-of-Stake (PoS) blockchain | 67.5 million APT (approx. $470M) |
| Worldcoin | Worldcoin is a layer-one (L1) co-founded by Sam Altman | 443 million WLD (approx. $1.10B) |
| Solana | Solana is a Layer 1 Proof-of-Stake (PoS) blockchain | 31 million SOL (approx. $2.30B) |
| Avalanche | Avalanche is a Layer 1 Proof-of-Stake (PoS) blockchain | 72 million AVAX (approx. $2.17B) |
Source: token.unlocks.app, data as of 10/12/2023. Historic performance is not an indicator of future results. This information should not be understood as financial advice for any particular digital asset.
As we evaluate the transformative journey of cryptocurrencies throughout 2023, it's essential to delve into various performance metrics that illuminate their growth and decline.

The Year-to-Date (YTD) price performance, depicted in the column chart, showcases the percentage increase or decrease in value of each token.
Source: MarketVector, data as of 06/12/2023, Historic performance is not an indicator of future results.
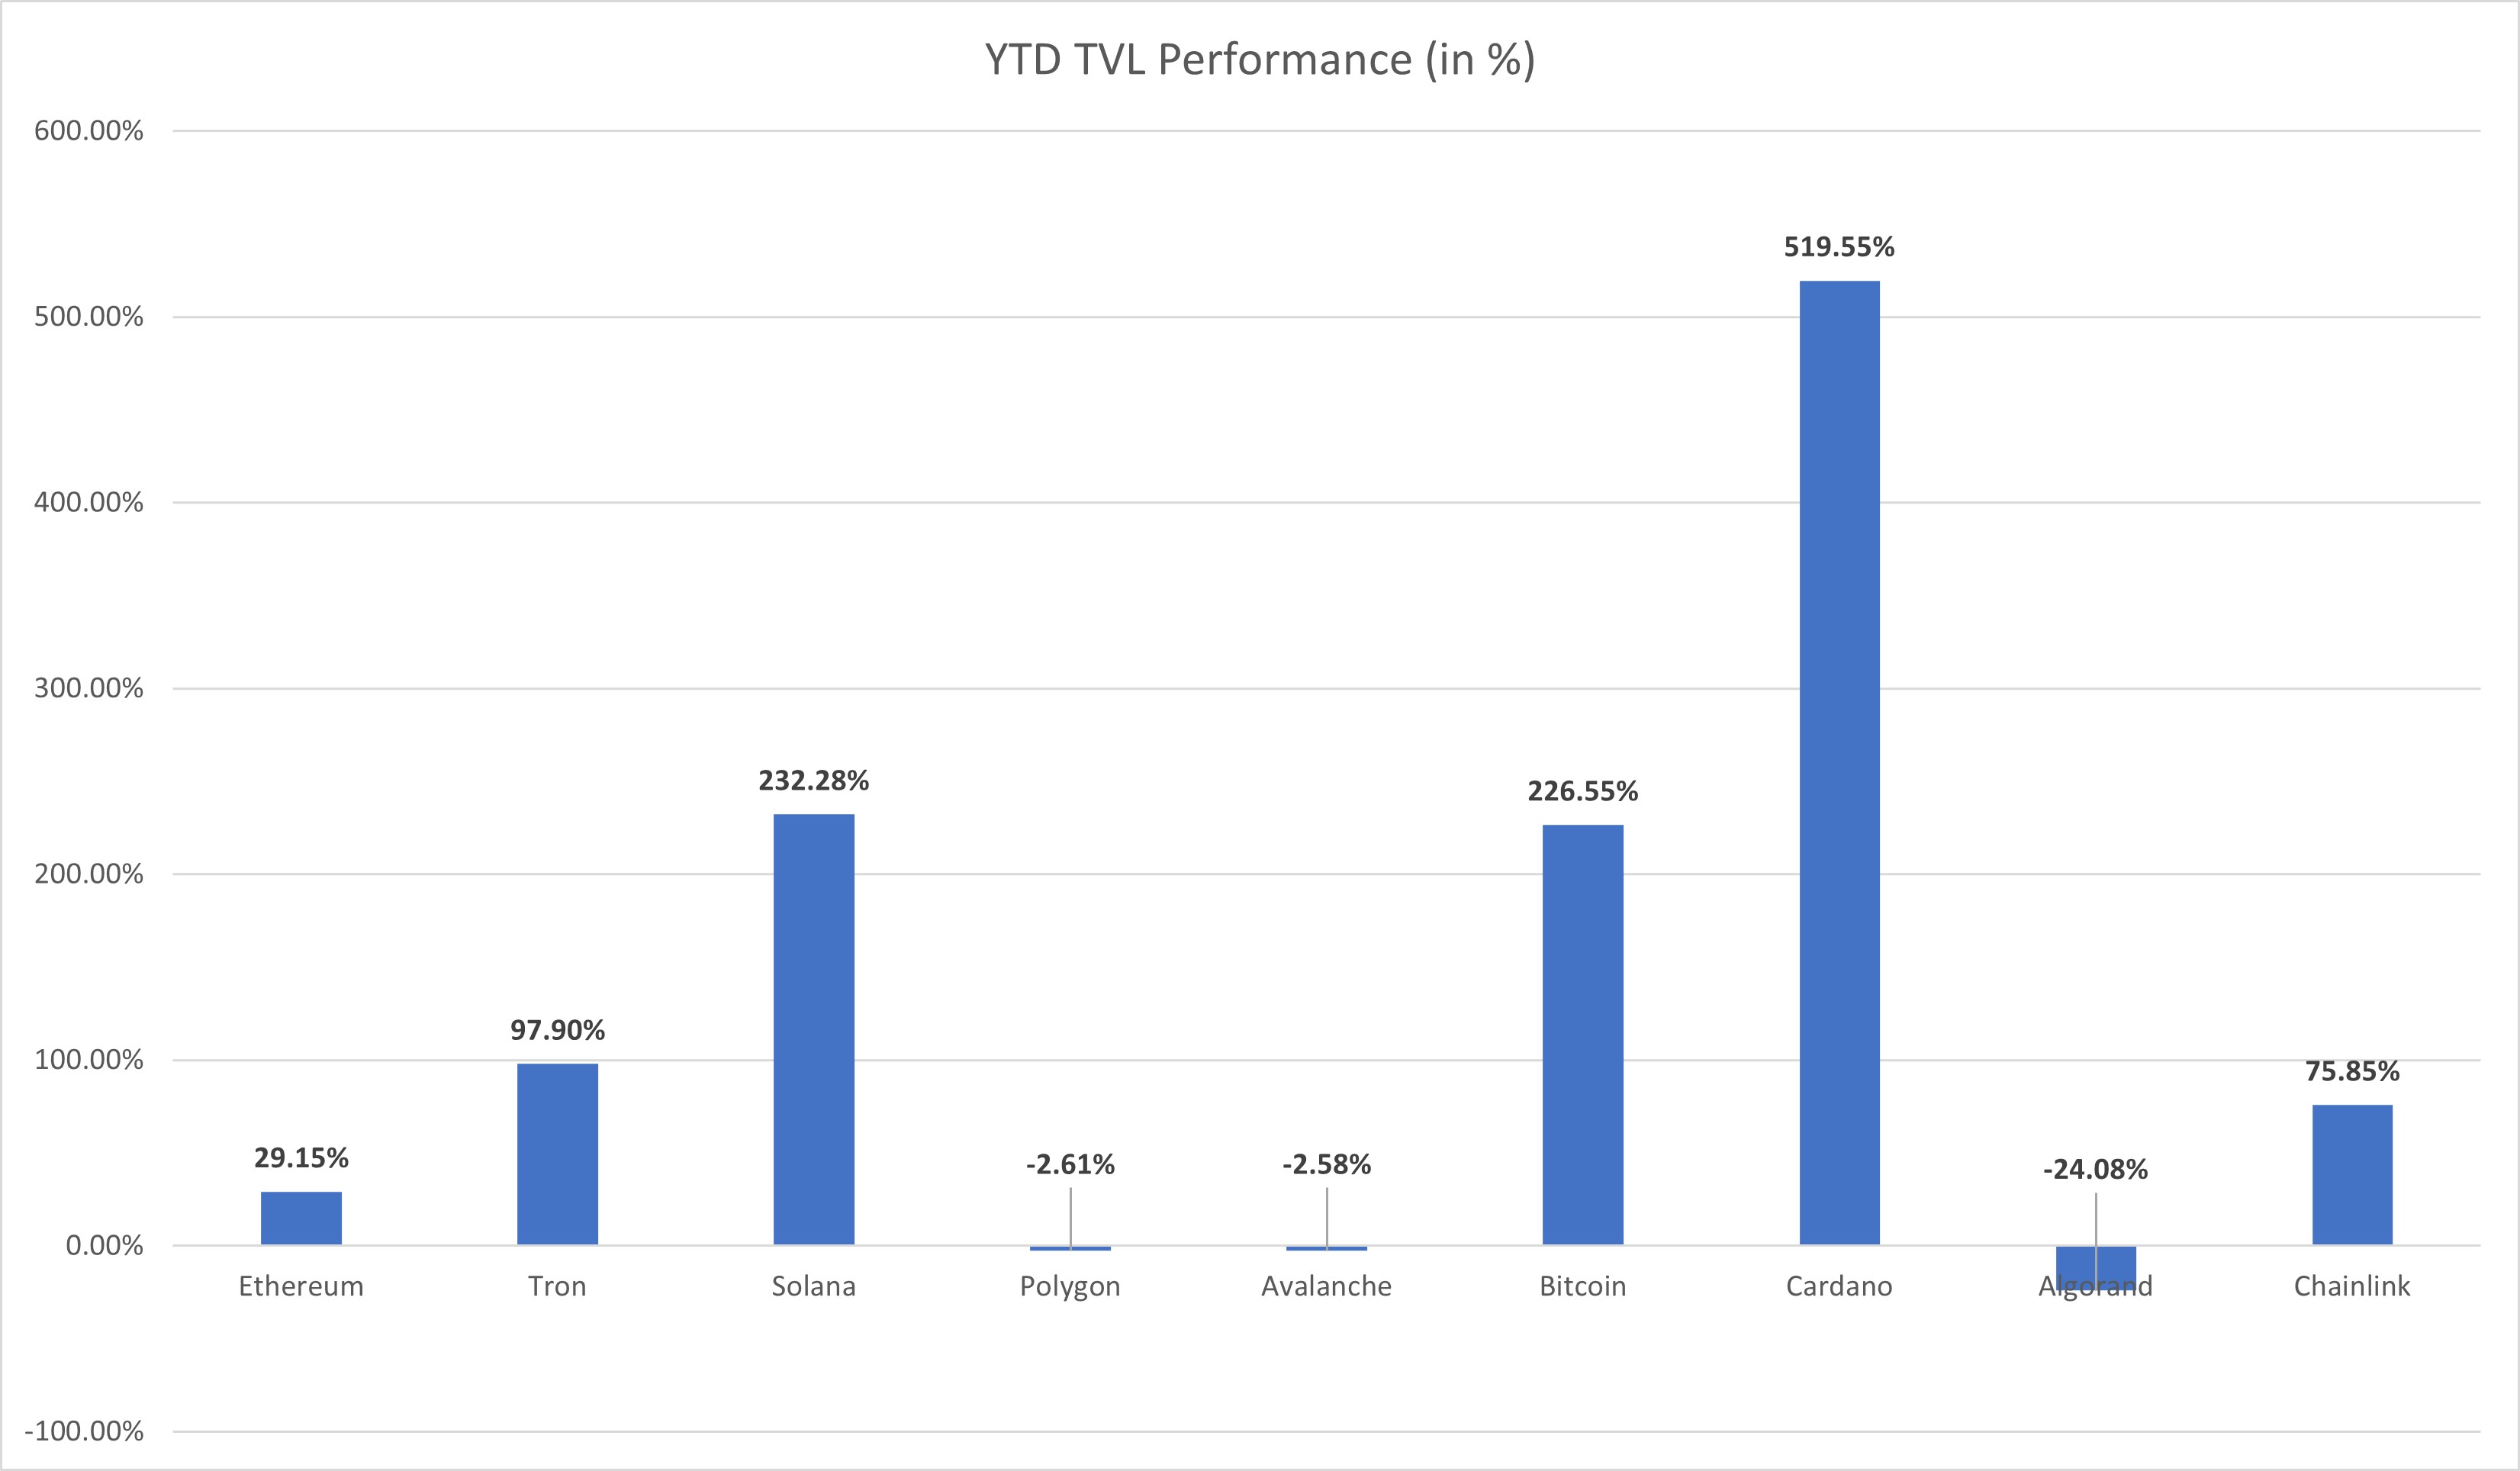
The Year-to-Date (YTD) TVL performance, depicted in the column chart, showcases the percentage increase or decrease in total value locked (TVL) or total value secured (in the case of Chainlink) for each token.
Source: Defillama, data as of 06/12/2023, Historic performance is not an indicator of future results.

The Year-to-Date (YTD) TVL performance, depicted in the column chart, showcases the percentage point increase or decrease in the percentage of market share of each token.
Source: Coinmarketcap, data as of 10/12/2023. Historic performance is not an indicator of future results.
To receive more Digital Assets insights, subscribe for our Crypto Newsletter
Important Information
This is not financial research but the opinion of the author of the article. We publish this information to inform and educate about recent market developments and technological updates, not to give any recommendation for certain products or projects. The selection of articles should therefore not be understood as financial advice or recommendation for any specific product and/or digital asset. We may occasionally include analysis of past market, network performance expectations and/or on-chain performance. Historical performance is not indicative for future returns.
For informational and advertising purposes only.
This information originates from VanEck (Europe) GmbH, Kreuznacher Straße 30, 60486 Frankfurt am Main. It is intended only to provide general and preliminary information to investors and shall not be construed as investment, legal or tax advice. VanEck (Europe) GmbH and its associated and affiliated companies (together “VanEck”) assume no liability with regards to any investment, divestment or retention decision taken by the investor on the basis of this information. Views and opinions expressed are current as of the date of this information and are subject to change with market conditions. Certain statements contained herein may constitute projections, forecasts and other forward looking statements, which do not reflect actual results. VanEck makes no representation or warranty, express or implied regarding the advisability of investing in securities or digital assets generally or in the product mentioned in this information (the “Product”) or the ability of the underlying Index to track the performance of the relevant digital assets market.
The underlying Index is the exclusive property of MarketVector Indexes GmbH, which has contracted with CryptoCompare Data Limited to maintain and calculate the Index. CryptoCompare Data Limited uses its best efforts to ensure that the Index is calculated correctly. Irrespective of its obligations towards the MarketVector Indexes GmbH, CryptoCompare Data Limited has no obligation to point out errors in the Index to third parties.
Investing is subject to risk, including the possible loss of principal up to the entire invested amount and the extreme volatility that ETNs experience. You must read the prospectus and KID before investing, in order to fully understand the potential risks and rewards associated with the decision to invest in the Product. The approved Prospectus is available at www.vaneck.com . Please note that the approval of the prospectus should not be understood as an endorsement of the Products offered or admitted to trading on a regulated market.
Performance quoted represents past performance, which is no guarantee of future results and which may be lower or higher than current performance.
Current performance may be lower or higher than average annual returns shown. Performance shows 12 month performance to the most recent Quarter end for each of the last 5yrs where available. E.g. '1st year' shows the most recent of these 12-month periods and '2nd year' shows the previous 12 month period and so on. Performance data is displayed in Base Currency terms, with net income reinvested, net of fees. Brokerage or transaction fees will apply. Investment return and the principal value of an investment will fluctuate. Notes may be worth more or less than their original cost when redeemed.
Index returns are not ETN returns and do not reflect any management fees or brokerage expenses. An index’s performance is not illustrative of the ETN’s performance. Investors cannot invest directly in the Index. Indices are not securities in which investments can be made.
No part of this material may be reproduced in any form, or referred to in any other publication, without express written permission of VanEck.
© VanEck (Europe) GmbH
This is a marketing communication. Please refer to the prospectus of the UCITS and to the KID before making any final investment decisions.
This information originates from VanEck (Europe) GmbH, which has been appointed as distributor of VanEck products in Europe by the Management Company VanEck Asset Management B.V., incorporated under Dutch law and registered with the Dutch Authority for the Financial Markets (AFM). VanEck (Europe) GmbH with registered address at Kreuznacher Str. 30, 60486 Frankfurt, Germany, is a financial services provider regulated by the Federal Financial Supervisory Authority in Germany (BaFin).
The information is intended only to provide general and preliminary information to investors and shall not be construed as investment, legal or tax advice VanEck (Europe) GmbH, VanEck Switzerland AG, VanEck Securities UK Limited and their associated and affiliated companies (together “VanEck”) assume no liability with regards to any investment, divestment or retention decision taken by the investor on the basis of this information. The views and opinions expressed are those of the author(s) but not necessarily those of VanEck. Opinions are current as of the publication date and are subject to change with market conditions. Certain statements contained herein may constitute projections, forecasts and other forward-looking statements, which do not reflect actual results. Information provided by third party sources is believed to be reliable and have not been independently verified for accuracy or completeness and cannot be guaranteed. Brokerage or transaction fees may apply.
All performance information is based on historical data and does not predict future returns. Investing is subject to risk, including the possible loss of principal.
No part of this material may be reproduced in any form, or referred to in any other publication, without express written permission of VanEck.
© VanEck (Europe) GmbH / VanEck Asset Management B.V.

09 March 2026
09 March 2026