Welcome to VanEck
Select Investor Type
29 July 2026
If your mental view of how investments work was formed in the last 25 years, you may need to think again. Why? Because the signs are that the traditional equity/bond portfolio – a model of diversification designed to protect against market volatility – no longer works.
To explain yesterday’s model, equities and bonds were generally thought to be negatively correlated, meaning their prices moved in opposite directions. In market shocks, when equities fell in price bonds would rise, cushioning overall investment portfolios.
Yet in 2022 this form of diversification stopped working. Surging global inflation hit equities and bonds together. The S&P 500 fell roughly 18% on the year, and a classic 60/40 portfolio — 60% equities, 40% bonds — lost 15.5%, one of its five worst calendar years since 1871. More defensive mixes fared even worse relative to their history: a 50/50 and a 40/60 portfolio each recorded their second-worst year on record, surpassed only by 1931. The supposedly safer the allocation, the more surprising the loss — because the bonds meant to cushion the fall were falling too.
In fact, over the last century the years from 2000-2021 of negative equity/bond correlations when diversification worked were an anomaly, coinciding with a long period of disinflation. Before that correlations between equities and bonds were positive in inflationary times and negative only in the briefer periods when inflation was low and stable (see chart).
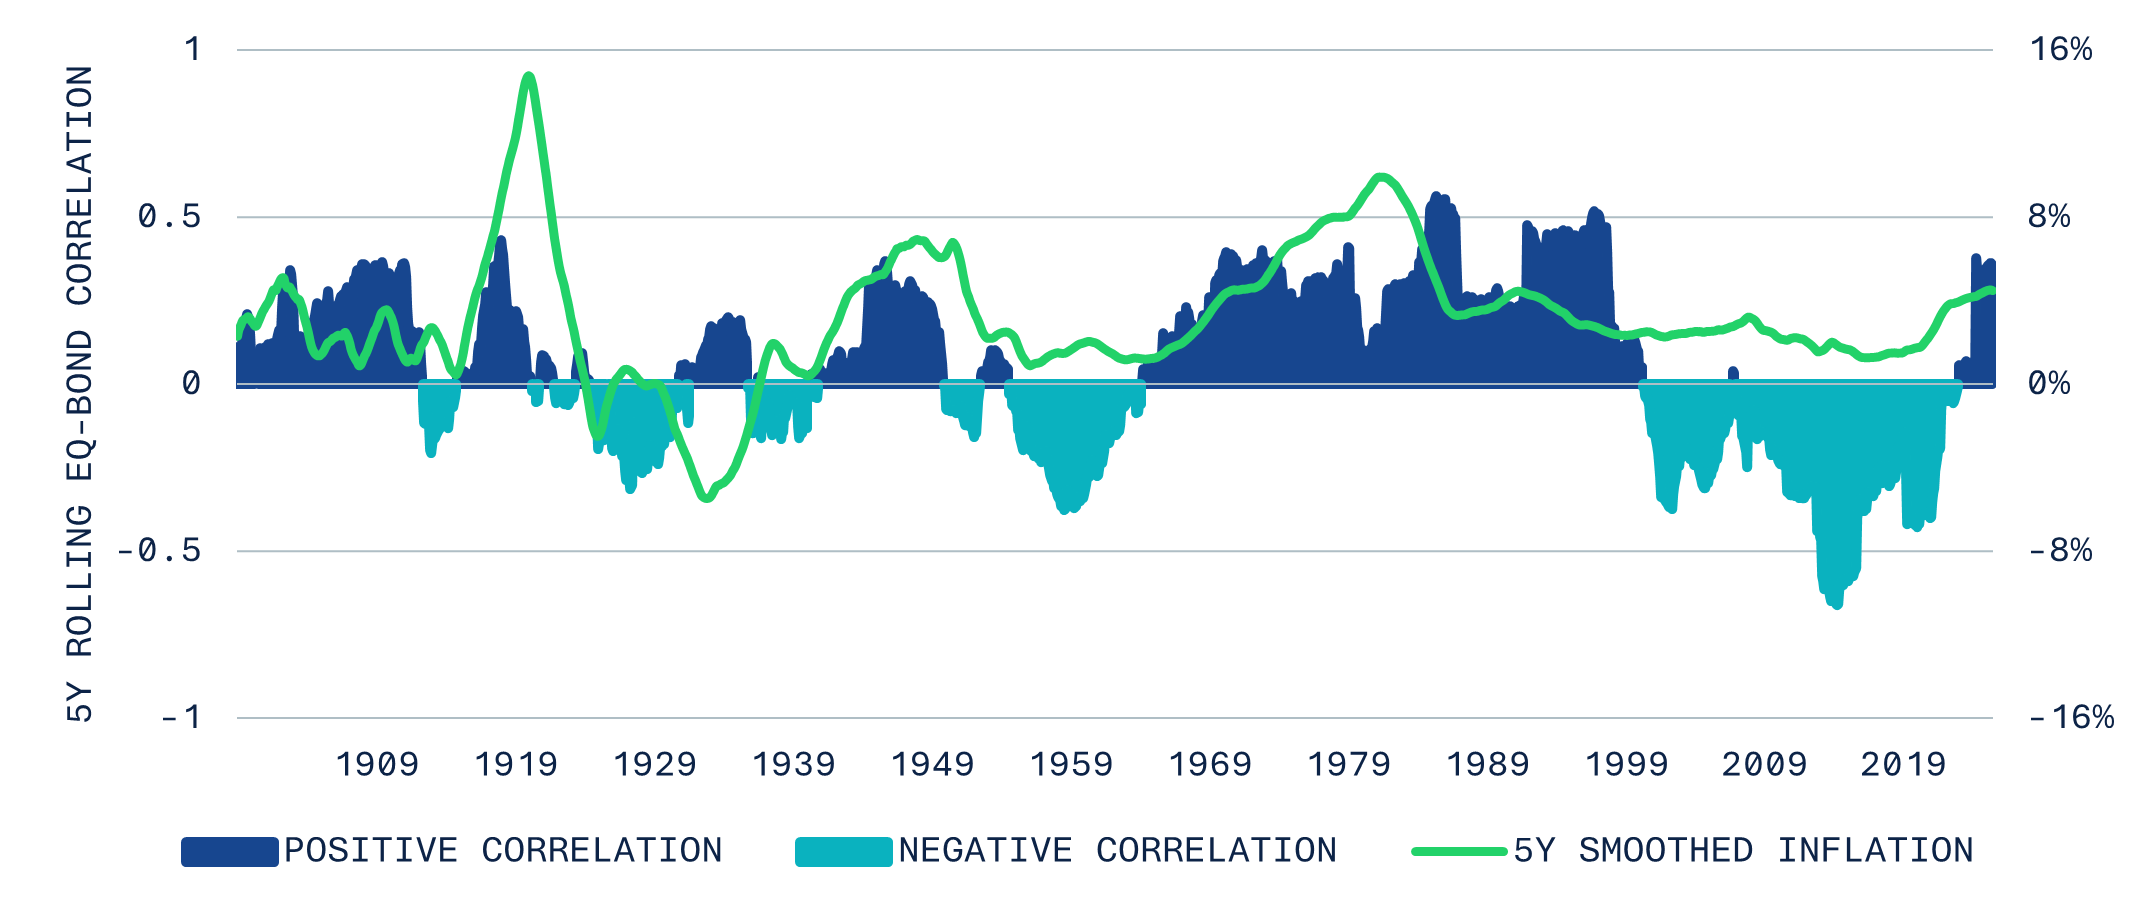
Notes: Five-year rolling equity-bond correlation against five-year smoothed consumer price index (CPI) inflation, post-19001.
After two decades of disinflation, 2022 appears to be when the economic regime changed. It heralded a shift to a period like the post-World War II years of 1946-1953, when inflation spiked, or the 1970s energy crises. In both eras, inflationary spikes triggered simultaneous losses in equities and bonds.
While the reversal of the demographic dividend that suppressed labor’s wages is the chief reason for today’s higher and likely longer lasting inflation, it’s reinforced by others. The three forces underpinning inflation are:
1. Demographic reversal. From the 1980s to the 2010s, the ‘baby boomer’ generation, born in the post-World War II baby boom, was joined by China's massive labor pool. This ample labor supply suppressed wages and goods inflation, anchoring the equity-bond architecture. But that dynamic is reversing as working-age populations shrink in the developed world and much of East Asia. The developed world has seen high dependency before — in the post-war baby boom — but that was youth dependency, a future workforce in waiting that went on to suppress wages for decades. Today's is old-age dependency: a shrinking workforce that pushes the other way, toward higher wages and prices.
Youth dependency (0–14 / 15–64) versus old-age dependency (65+ / 15–64) for Europe and North America. Source: UN World Population Prospects 2024.
2. Fiscal dominance. Aging populations are locking in entitlement spending that cannot easily be cut. Across the developed world — the US, France, Germany, and the euro area as a whole — governments are running large deficits even outside recessions, with national debts at post-World War II peaks. As higher refinancing rates push interest payments up as a share of revenue and begin to threaten sovereign solvency, central banks become reluctant to raise rates, further stoking inflation.
General government deficit/surplus, % of GDP
General government deficits as % of GDP, selected developed economies. Source: OECD National Accounts (B9S13). Elevated deficits persist even outside recessions across both major developed-market blocs.
3. Multipolar fragmentation. In a world where governments are using economic and trade tools to geopolitical ends, the global trading system is fragmenting. Trade tariffs, export controls on strategic technologies, and near-shoring of critical inputs act as a structural tax on corporate margins and push up input prices. Again, this fragmentation is inflationary.
Trade policy uncertainty by decade, average of the monthly Federal Reserve Board TPU index. Source: Caldara, Iacoviello, Molligo, Prestipino and Raffo (2019), Federal Reserve Board; VanEck calculations. The 2020s average is roughly five times the 2000s.
This move from disinflation to inflation means the days of easy portfolio diversification are over. You can still diversify portfolios to cushion them against the risks of market falls but doing so requires a wider spread of assets.
The equity-bond portfolio does not have to disappear — but both parts need rebuilding, with assets chosen deliberately for their ability to weather the conditions ahead rather than the ones behind us. The core of the portfolio remains broad equities and bonds, prized for their liquidity and low cost. But even within the core, composition matters: equal-weighted or dividend-tilted equity reduces the concentration now embedded in standard capitalization-weighted indexes, and a bond sleeve has to be built for the roles it can still play rather than assumed to diversify on its own.
The greatest potential for protection, however, lies in the portfolio’s satellite, which both diversifies and drives returns. The genuine diversifiers are real and hard assets — gold, silver, and broad commodities — together with, for example, defense equities that have behaved similarly. Our research shows all four moved differently from mainstream equity indices and held their value across both the Great Inflation of the 1970s and the post-2020 inflationary period.
Alongside them sit return-drivers — the companies producing metals and commodities, such as miners, and stocks associated with the structural-growth themes of the energy transition and semiconductors, where today’s rising demand is meeting constrained supply. These add real return rather than protection, and the balance between the two shifts with an investor's time horizon.
Fresh thinking is required as the past few decades of easy diversification come to an end. In the months to come, we will offer more insights on how to structure portfolios for these more inflationary times.
1 Shiller online data (Yale University) using monthly S&P 500 prices, 10-year Treasury yields and CPI.
IMPORTANT INFORMATION
This is marketing communication.
This information originates from VanEck (Europe) GmbH, which is authorized as an EEA investment firm under the Markets in Financial Instruments Directive (“MiFiD”). VanEck (Europe) GmbH has its registered address at Kreuznacher Str. 30, 60486 Frankfurt, Germany, and has been appointed as distributor of VanEck products in Europe by the Management Company, VanEck Asset Management B.V.(“ManCo”), which is incorporated under Dutch law and registered with the Dutch Authority for the Financial Markets (AFM).
This material is only intended for general and preliminary information and does not constitute an investment, legal or tax advice. No representation or warranty is made as to the accuracy or completeness of the information and no liability is accepted to the fullest extent permitted by law.
The views and opinions expressed are those of the author(s) but not necessarily those of VanEck. Opinions are current as of the publication date and are subject to change with market conditions. Information provided by third party sources is believed to be reliable and has not been independently verified for accuracy or completeness and cannot be guaranteed.
The S&P 500 Index (“Index”) is a product of S&P Dow Jones Indices LLC and/or its affiliates and has been licensed for use by Van Eck Associates Corporation. Copyright © 2020 S&P Dow Jones Indices LLC, a division of S&P Global, Inc., and/or its affiliates. All rights reserved. Redistribution or reproduction in whole or in part are prohibited without written permission of S&P Dow Jones Indices LLC. For more information on any of S&P Dow Jones Indices LLC’s indices please visit www.spdji.com. S&P® is a registered trademark of S&P Global and Dow Jones® is a registered trademark of Dow Jones Trademark Holdings LLC. Neither S&P Dow Jones Indices LLC, Dow Jones Trademark Holdings LLC, their affiliates nor their third party licensors make any representation or warranty, express or implied, as to the ability of any index to accurately represent the asset class or market sector that it purports to represent and neither S&P Dow Jones Indices LLC, Dow Jones Trademark Holdings LLC, their affiliates nor their third party licensors shall have any liability for any errors, omissions, or interruptions of any index or the data included therein. It is not possible to invest directly in an index.
Investing is subject to risk, including the possible loss of principal. For any unfamiliar technical terms, please refer to ETF Glossary | VanEck.
No part of this material may be reproduced in any form, or referred to in any other publication, without express written permission of VanEck.
© VanEck (Europe) GmbH
This is a marketing communication. Please refer to the prospectus of the UCITS and to the KID before making any final investment decisions.
This information originates from VanEck (Europe) GmbH, which has been appointed as distributor of VanEck products in Europe by the Management Company VanEck Asset Management B.V., incorporated under Dutch law and registered with the Dutch Authority for the Financial Markets (AFM). VanEck (Europe) GmbH with registered address at Kreuznacher Str. 30, 60486 Frankfurt, Germany, is a financial services provider regulated by the Federal Financial Supervisory Authority in Germany (BaFin).
The information is intended only to provide general and preliminary information to investors and shall not be construed as investment, legal or tax advice VanEck (Europe) GmbH, VanEck Switzerland AG, VanEck Securities UK Limited and their associated and affiliated companies (together “VanEck”) assume no liability with regards to any investment, divestment or retention decision taken by the investor on the basis of this information. The views and opinions expressed are those of the author(s) but not necessarily those of VanEck. Opinions are current as of the publication date and are subject to change with market conditions. Certain statements contained herein may constitute projections, forecasts and other forward-looking statements, which do not reflect actual results. Information provided by third party sources is believed to be reliable and have not been independently verified for accuracy or completeness and cannot be guaranteed. Brokerage or transaction fees may apply.
All performance information is based on historical data and does not predict future returns. Investing is subject to risk, including the possible loss of principal.
No part of this material may be reproduced in any form, or referred to in any other publication, without express written permission of VanEck.
© VanEck (Europe) GmbH / VanEck Asset Management B.V.