Time to Go EM Local Currency?
November 23, 2020
Read Time 9 MIN
The VanEck Emerging Markets Bond Fund (EMBAX) utilizes a flexible approach to emerging markets debt investing and invests in debt securities issued by governments, quasi-government entities or corporations in emerging markets countries. These securities may be denominated in any currency, including those of emerging markets. By investing in emerging markets debt securities, the Fund offers exposure to emerging markets fundamentals, generally characterized by lower debts and deficits, higher growth rates and independent central banks. The expanded PDF version of this commentary can be downloaded here.
Market Review
Our basic stance remains and the changes we made were largely telegraphed in previous monthlies—we’ve generally been more diversified and selective after the “buy of the century” view started to get fully priced in July. Since then, we’ve gradually reduced some of the high-flying winners, as discussed in our monthlies. These have generally been in USD. Replacing them are mostly EM local currency markets. Importantly, we’d note that not all local currency markets are the same and a number of EM local currency markets (such as China’s) are low volatility affairs. Anyway, given these developments in the portfolio, we thought we’d review “the case for EM local currency”.
What’s the case for EM local currency? EMFX has lagged and many currencies have good policy that can offer a combination of defensive and offensive (i.e., beta to growth) characteristics. We’ll go into that argument in detail, below. What we should add, though, is that the global context supports EM local currency bond markets in many ways. Global government bond markets are undergoing two serious challenges right now. First, many of them pay low yields or even a high probability of losses. Their safety value is arguably fully priced, if not subject to distortive “hothouse” effects. Second, the classic “60/40” stocks/bond portfolio is challenged by these low or negative yields on many developed markets (DM) bonds. We think EM bonds will be a growing answer to filling in whatever that, perhaps declining, “40” is.
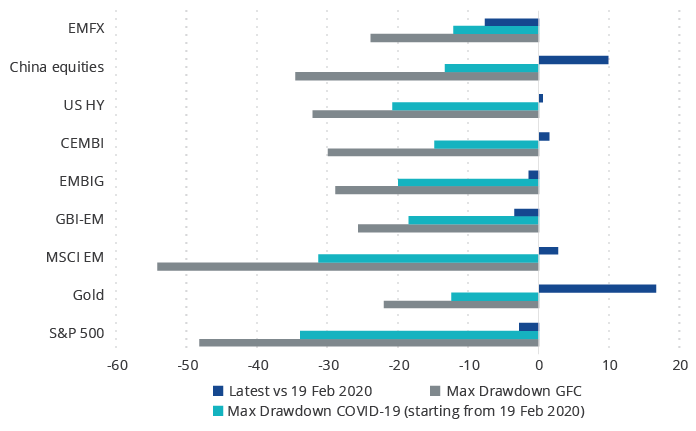
EMFX hasn’t even retraced half of its pre-COVID lows. Let’s discuss lagging and catching-up, first. Exhibit 1 below makes the point that most asset prices are largely back to their pre-COVID highs, with gold (wow!) and Chinese equities (even more impressive!) being well above pre-COVID highs. (VanEck happens to have leading funds in both gold and EM equities). Everything else—including all the EM debt categories such as the EMBIG and CEMBI—is back to pre-Covid levels. Except for EMFX, though—it’s only retraced under half of its pre-COVID lows.
Exhibit 1 – Asset Prices Near Pre-COVID highs
Max Drawdowns: GFC vs. COVID-19
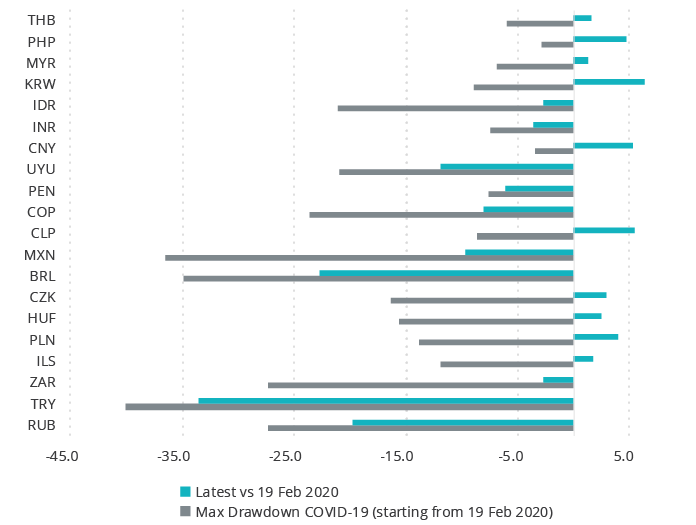
There are a number of individual EM foreign currencies that have lagged significantly, but which do not have an obvious fundamental that deteriorated enough to explain it: why is the Russian ruble down in line with the (so far) de-rating Turkish lira? Exhibit 2 goes through the major EMFX in detail. The ruble really stands out to us, given the country’s low debt, high reserves, plenty of fiscal and monetary space and improving economic structure. We don’t see a good reason for this lagged currency performance. Similarly for Peru, which has beta to global growth due to its mining sector, but also great defensive characteristics due to its strong balance sheet and good policy track record. Both of these examples pay high real interest rates relative to their fundamentals, consistent with the core of our investment process, of course.
Exhibit 2 – EMFX Has Some Big Laggards
EM FX Performance during COVID Crisis (%)
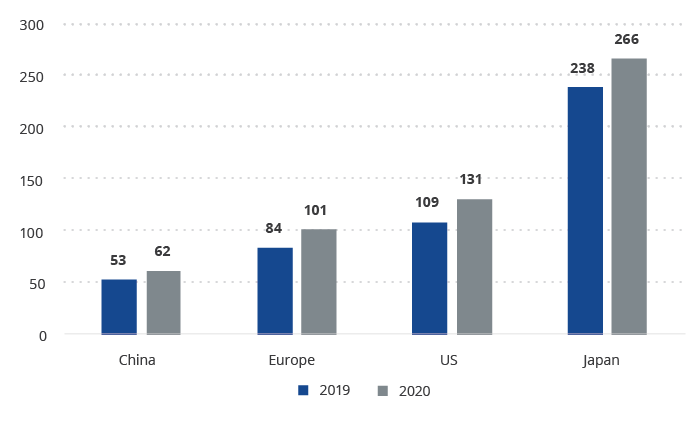
Another reason supportive of local currency is their policymakers’ generally orthodox stances—paying high real interest rates and maintaining fiscal space via limiting debt and deepening structural reform. China will be our poster child for this type of bond market. First, let’s look at Chinese government debt, relative to DM. Fine, a large portion of Chinese debt is on the part of corporates with varying degrees of implicit government support, but let’s put that aside given the tightness of the country’s financial controls. China has a lot of flexibility to stimulate, if growth is needed to drive asset prices, but also pays high real yields if growth doesn’t materialize quickly.
Exhibit 3 – China Maintains Fiscal Space
General Government Gross Debt, % GDP
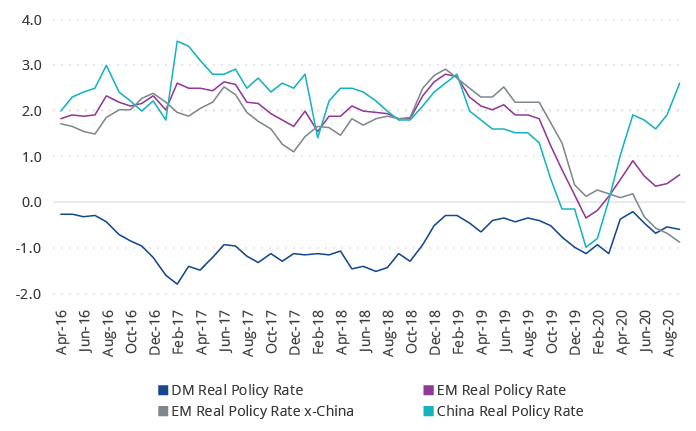
Another example of policy orthodoxy which rewards government bondholders also comes from China. The Exhibit below shows the higher real policy rates offered by Chinese bonds. This is a reflection of the Chinese authorities’ position of strength. They do not have to gin-up growth and markets without end and can afford to tighten policy when needed. This obviously optimizes long-term outcomes, because any adversity can be met by loosening. It’s a sign of strength to be tightening policy in the current nascent growth environment.
Exhibit 4 – Higher Chinese Rates A Sign of Strength
Selected Global Real Policy Rates, %
Exposure Types and Significant Changes
The changes to our top positions are summarized below. Our largest positions in October were: Mexico, China, South Africa, Thailand and Indonesia.
- We increased our local currency exposures in South Africa and Russia. The main driver in South Africa was the expectation that the government’s budget presentation will be realistic, with a clear path to the stabilization of the debt-to-GDP ratio. These expectations fully materialized. As usual, there are implementation risks, but for now these developments improved the country’s policy test score. In addition, there are clear signs that the historically low prime rate is having a positive impact on consumption and growth. In terms of our investment process, this improves the country’s economic test score. As regards Russia, a lot of bad news related to geopolitics is already priced in (for example, the ruble is among the worst-performing currencies despite stellar macroeconomic fundamentals), which improves the country’s technical test score. Against this backdrop, it is becoming increasingly difficult to justify having a big underweight in Russia.
- We also increased our local currency exposures in Malaysia and Peru. One reason for choosing Malaysia is that the currency has one of the highest historic correlations with CNY, so it presents a good way to get diversified exposure to the region and express the China growth outperformance theme. In terms of our investment process, this improved the country’s technical test score. Peruvian assets suffered a lot in the past months due to a very high COVID mortality rate, a very deep recession and a lot of political noise associated with withdrawals from local pension funds and attempts to impeach the president. These developments improved local valuations and limited future vulnerabilities, strengthening the country’s technical test score. We also believe that Peru is likely to experience large foreign exchange inflows if there is another round of pension fund withdrawals, which bodes well for the currency (in addition to the sizable international reserves and limited external account pressures).
- Finally, we increased our hard currency quasi-sovereign exposure and local currency exposure in Indonesia. The main reason is that a temporary scare related to a potential policy rollback—which might have affected the central bank’s independence—seems to be over. Indonesia is slowly reverting to the fiscally orthodox path, while the recently ratified Job Creation Law (Omnibus Law) provides a firmer foundation for growth going forward. On the external side, the current account is expected to show further improvement in 2020, which should reduce pressure on the central bank to tighten. In terms of our investment process, this improved the country’s policy test score.
- We reduced our hard currency sovereign exposure in Costa Rica and hard currency corporate exposure in Mongolia. The Costa Rican government unexpectedly decided to pull and reassess its initial proposal to the IMF following large-scale demonstrations. The fact that the country’s congress was not on board was a major contributing factor. In terms of our investment process, this worsened the country’s policy test score. As regards Mongolia, the corporate bond that we held there experienced 20+ points price appreciation since May. We saw no discernible catalyst for further price upside and there was little support on the secondary market. In terms of our investment process, this worsened the technical test score for the company.
- We also continued to divest from hard currency corporate and quasi-sovereign exposure in Argentina and local currency exposure in Uruguay. In Argentina, we finalized the post-restructuring exit and took profits from the debt exchange in which we participated. Policy-wise, it is difficult to find any positive developments in Argentina. The government does not seem to be capable of handling the COVID pandemic, the international reserves continue to fall, the recovery stumbles, the gap between the official and market exchange rates is wide and there is no prospect of reforms. So, both economic and policy test scores for the country continue to worsen. The decision to exit Uruguay reflected more benign considerations—local valuations no longer look attractive and compelling after a big rally (in which we happily participated).
- Finally, we reduced our hard currency sovereign and corporate exposures in Israel. Our sovereign exposure was a low-spread off-index bond with a deteriorating technical test score. As regards the corporate exposure, this was also a technical downgrade—the company’s valuation went down by one “Bucket”, and, in addition, our holding was diluted by a parent company. So, we chose to take profit on our position and employ the money elsewhere.
Fund Performance
The VanEck Emerging Markets Bond Fund (Class A shares excluding sales charge) lost 0.05% in October compared to a gain of 0.20 % for the 50/50 J.P. Morgan Government Bond Index-Emerging Markets Global Diversified (GBI-EM) local currency and the J.P. Morgan Emerging Markets Bond Index (EMBI) hard-currency index.
Turning to the market’s performance, GBI-EM’s biggest winners were Mexico, Indonesia, and South Africa. Its biggest losers were Turkey, Brazil and Poland. The EMBI’s biggest winners were South Africa, Egypt, and Ukraine. Its losers were Sri Lanka, Argentina and Costa Rica.
| Average Annual Total Returns (%) as of October 31, 2020 | ||||||
| 1 Mo† | 3 Mo† | YTD | 1 Year | 5 Year | Life | |
| Class A: NAV (Inception 7/9/12) | -0.05 | 0.49 | 2.89 | 7.13 | 4.74 | 2.18 |
| Class A: Maximum 5.75% Load | -5.79 | -5.29 | -3.02 | 0.97 | 3.51 | 1.45 |
| 50 GBI-EM GD / 50% EMBI GD | 0.20 | -1.63 | -3.21 | -1.38 | 4.82 | 2.56 |
| Average Annual Total Returns (%) as of September 30, 2020 | ||||||
| 1 Mo† | 3 Mo† | YTD | 1 Year | 5 Year | Life | |
| Class A: NAV (Inception 7/9/12) | -1.94 | 5.42 | 2.94 | 7.48 | 5.36 | 2.21 |
| Class A: Maximum 5.75% Load | -7.57 | -0.64 | -2.98 | 1.30 | 4.12 | 1.47 |
| 50 GBI-EM GD / 50% EMBI GD | -1.93 | 1.47 | -3.41 | -0.02 | 5.53 | 2.57 |
† Monthly returns are not annualized.
Expenses: Class A: Gross 2.69%; Net 1.26%. Expenses are capped contractually until 05/01/21 at 1.25% for Class A. Caps exclude acquired fund fees and expenses, interest expense, trading expenses, dividends and interest payments on securities sold short, taxes and extraordinary expenses. Please note that, generally, unconstrained bond funds may have higher fees than core bond funds due to the specialized nature of their strategies.
The tables above present past performance which is no guarantee of future results and which may be lower or higher than current performance. Returns reflect temporary contractual fee waivers and/or expense reimbursements. Had the Fund incurred all expenses and fees, investment returns would have been reduced. Investment returns and Fund share values will fluctuate so that investors’ shares, when redeemed, may be worth more or less than their original cost. Fund returns assume that dividends and capital gains distributions have been reinvested in the Fund at Net Asset Value (NAV). An index’s performance is not illustrative of the Fund’s performance. Certain indices may take into account withholding taxes. Index returns assume that dividends of the index constituents in the index have been reinvested. Investing involves risk, including loss of principal; please see disclaimers on next page. Please call 800.826.2333 or visit vaneck.com for performance current to the most recent month ended.
Disclosures
Source of all Data: VanEck, Bloomberg.
Prior to May 1, 2020, the fund was known as the VanEck Unconstrained Emerging Markets Bond Fund.
Value at risk (VaR) is a statistic that measures and quantifies the level of financial risk within a firm, portfolio or position over a specific time frame. Beta is a measure of the volatility–or systematic risk–of a security or portfolio compared to the market as a whole. Correlation a statistic that measures the degree to which two securities move in relation to each other.
Duration measures a bond’s sensitivity to interest rate changes that reflects the change in a bond’s price given a change in yield. This duration measure is appropriate for bonds with embedded options. Quantitative Easing by a central bank increases the money supply engaging in open market operations in an effort to promote increased lending and liquidity. Monetary Easing is an economic tool employed by a central bank to reduce interest rates and increase money supply in an effort to stimulate economic activity. Correlation is a statistical measure of how two variables move in relation to one other. Liquidity Illusion refers to the effect that an independent variable might have in the liquidity of a security as such variable fluctuates overtime. A Holdouts Issue in the fixed income asset class occurs when a bond issuing country or entity is in default or at the brink of default, and launches an exchange offer in an attempt to restructure its debt held by existing bond holding investors. Carry is the benefit or cost for owning an asset.
All indices are unmanaged and include the reinvestment of all dividends, but do not reflect the payment of transaction costs, advisory fees or expenses that are associated with an investment in the Fund. Certain indices may take into account withholding taxes. An index’s performance is not illustrative of the Fund’s performance. Indices are not securities in which investments can be made. The Fund’s benchmark index (50% GBI-EM/50% EMBI) is a blended index consisting of 50% J.P. Morgan Government Bond Index-Emerging Markets (GBI-EM) Global Diversified and 50% J.P. Morgan Emerging Markets Bond Index (EMBI). The J.P. Morgan GBI-EM Global Diversified tracks local currency bonds issued by Emerging Markets governments. The J.P. Morgan EMBI Global Diversified tracks returns for actively traded external debt instruments in emerging markets, and is also J.P. Morgan’s most liquid U.S. dollar emerging markets debt benchmark.
Information has been obtained from sources believed to be reliable but J.P. Morgan does not warrant its completeness or accuracy. The Index is used with permission. The index may not be copied, used or distributed without J.P. Morgan’s written approval. Copyright 2020, J.P. Morgan Chase & Co. All rights reserved.
Please note that the information herein represents the opinion of the portfolio manager and these opinions may change at any time and from time to time and portfolio managers of other investment strategies may take an opposite opinion than those stated herein. Not intended to be a forecast of future events, a guarantee of future results or investment advice. Current market conditions may not continue. Non-VanEck proprietary information contained herein has been obtained from sources believed to be reliable, but not guaranteed. No part of this material may be reproduced in any form, or referred to in any other publication, without express written permission of Van Eck Securities Corporation.
Investing involves risk, including loss of principal. You can lose money by investing in the Fund. Any investment in the Fund should be part of an overall investment program, not a complete program. The Fund is subject to risks associated with its investments in below investment grade securities, credit, currency management strategies, debt securities, derivatives, emerging market securities, foreign currency transactions, foreign securities, hedging, other investment companies, Latin American issuers, management, market, non-diversification, operational, portfolio turnover, sectors and sovereign bond risks. Investing in foreign denominated and/or domiciled securities may involve heightened risk due to currency fluctuations, and economic and political risks, which may be enhanced in emerging markets. As the Fund may invest in securities denominated in foreign currencies and some of the income received by the Fund will be in foreign currencies, changes in currency exchange rates may negatively impact the Fund’s return. Derivatives may involve certain costs and risks such as liquidity, interest rate, and the risk that a position could not be closed when most advantageous. The Fund may also be subject to risks associated with non-investment grade securities.
Investors should consider the Fund’s investment objective, risks, charges, and expenses of the investment company carefully before investing. Bond and bond funds will decrease in value as interest rates rise. The prospectus and summary prospectus contain this and other information. Please read them carefully before investing. Please call 800.826.2333 or visit vaneck.com for performance information current to the most recent month end and for a free prospectus and summary prospectus.
© 2020 VanEck.
Related Funds
Disclosures
Source of all Data: VanEck, Bloomberg.
Prior to May 1, 2020, the fund was known as the VanEck Unconstrained Emerging Markets Bond Fund.
Value at risk (VaR) is a statistic that measures and quantifies the level of financial risk within a firm, portfolio or position over a specific time frame. Beta is a measure of the volatility–or systematic risk–of a security or portfolio compared to the market as a whole. Correlation a statistic that measures the degree to which two securities move in relation to each other.
Duration measures a bond’s sensitivity to interest rate changes that reflects the change in a bond’s price given a change in yield. This duration measure is appropriate for bonds with embedded options. Quantitative Easing by a central bank increases the money supply engaging in open market operations in an effort to promote increased lending and liquidity. Monetary Easing is an economic tool employed by a central bank to reduce interest rates and increase money supply in an effort to stimulate economic activity. Correlation is a statistical measure of how two variables move in relation to one other. Liquidity Illusion refers to the effect that an independent variable might have in the liquidity of a security as such variable fluctuates overtime. A Holdouts Issue in the fixed income asset class occurs when a bond issuing country or entity is in default or at the brink of default, and launches an exchange offer in an attempt to restructure its debt held by existing bond holding investors. Carry is the benefit or cost for owning an asset.
All indices are unmanaged and include the reinvestment of all dividends, but do not reflect the payment of transaction costs, advisory fees or expenses that are associated with an investment in the Fund. Certain indices may take into account withholding taxes. An index’s performance is not illustrative of the Fund’s performance. Indices are not securities in which investments can be made. The Fund’s benchmark index (50% GBI-EM/50% EMBI) is a blended index consisting of 50% J.P. Morgan Government Bond Index-Emerging Markets (GBI-EM) Global Diversified and 50% J.P. Morgan Emerging Markets Bond Index (EMBI). The J.P. Morgan GBI-EM Global Diversified tracks local currency bonds issued by Emerging Markets governments. The J.P. Morgan EMBI Global Diversified tracks returns for actively traded external debt instruments in emerging markets, and is also J.P. Morgan’s most liquid U.S. dollar emerging markets debt benchmark.
Information has been obtained from sources believed to be reliable but J.P. Morgan does not warrant its completeness or accuracy. The Index is used with permission. The index may not be copied, used or distributed without J.P. Morgan’s written approval. Copyright 2020, J.P. Morgan Chase & Co. All rights reserved.
Please note that the information herein represents the opinion of the portfolio manager and these opinions may change at any time and from time to time and portfolio managers of other investment strategies may take an opposite opinion than those stated herein. Not intended to be a forecast of future events, a guarantee of future results or investment advice. Current market conditions may not continue. Non-VanEck proprietary information contained herein has been obtained from sources believed to be reliable, but not guaranteed. No part of this material may be reproduced in any form, or referred to in any other publication, without express written permission of Van Eck Securities Corporation.
Investing involves risk, including loss of principal. You can lose money by investing in the Fund. Any investment in the Fund should be part of an overall investment program, not a complete program. The Fund is subject to risks associated with its investments in below investment grade securities, credit, currency management strategies, debt securities, derivatives, emerging market securities, foreign currency transactions, foreign securities, hedging, other investment companies, Latin American issuers, management, market, non-diversification, operational, portfolio turnover, sectors and sovereign bond risks. Investing in foreign denominated and/or domiciled securities may involve heightened risk due to currency fluctuations, and economic and political risks, which may be enhanced in emerging markets. As the Fund may invest in securities denominated in foreign currencies and some of the income received by the Fund will be in foreign currencies, changes in currency exchange rates may negatively impact the Fund’s return. Derivatives may involve certain costs and risks such as liquidity, interest rate, and the risk that a position could not be closed when most advantageous. The Fund may also be subject to risks associated with non-investment grade securities.
Investors should consider the Fund’s investment objective, risks, charges, and expenses of the investment company carefully before investing. Bond and bond funds will decrease in value as interest rates rise. The prospectus and summary prospectus contain this and other information. Please read them carefully before investing. Please call 800.826.2333 or visit vaneck.com for performance information current to the most recent month end and for a free prospectus and summary prospectus.
© 2020 VanEck.