Examining Gold’s Recovery Cycles
March 18, 2020
Read Time 4 MIN
While the outcome of this most recent market sell-off and related pandemic are yet-to-be-seen, we remain optimistic about the outlook for gold and gold stocks in the near-term. Much of the market movement in gold prices is relatively easy to explain, while gold companies continue to exhibit, we believe, truly compelling fundamentals and valuations. With respect to the pandemic, companies are taking all precautions, and although we do anticipate that some operations will be impacted, discussions we have had with companies indicate that every effort is being made to ensure inventories, supply lines, employee health and back-up redundancies are in place to sustain production.
Below is a summary of our most recent takeaways.
We believe there are, predominately, two reasons why gold has been under pressure as of late.
- 1. Unwinding of hedged positions in risk parity and other volatility model funds – Gold, commodity and fixed income investments are typically leveraged in risk parity models (based on their underlying volatility relative to equities), so substantial liquidations in these funds have led to outsized, forced selling of these assets.
- 2. Liquidations to raise cash – Selling to meet margin calls and raising cash to cover stock market losses, especially among leveraged funds, is commonplace during market sell-offs.
We believe that gold/gold stocks tend to recover faster than the broader markets following crises.
- More recently, during the 2008 financial crisis, gold and gold stocks bottomed and recovered much earlier than the S&P 500—recouping losses at/around the time the S&P reached its lows in February/March 2009. The S&P 500 took nearly two years to reach its pre-crisis levels again.
Gold and Gold Stocks Recovered Before S&P 500 During 2008 Financial Crisis
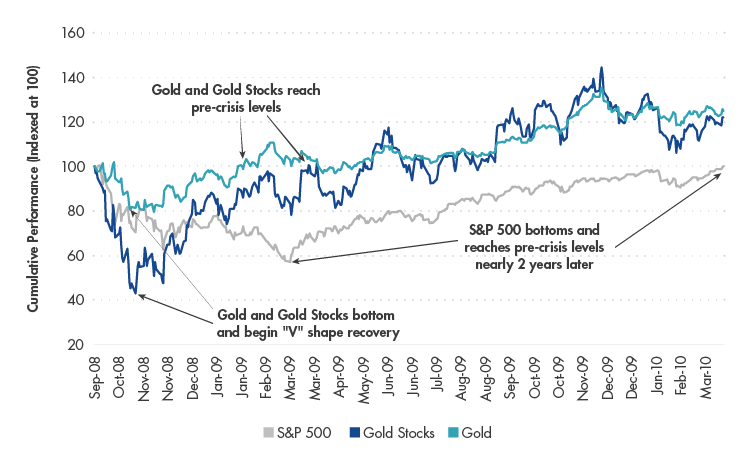
Source: VanEck, Bloomberg. Data as of March 2020. “S&P 500” represented by the S&P 500 Index TR (SPXT). “Gold Stocks” represented by the NYSE Arca Gold Miners Index Net Total Return (GDMNTR). “Gold” represented by gold spot prices.
- Looking at other past market sell offs, gold has held up particularly well while gold stocks—though often following the broader equity market through a drawdown—have, on the whole, outperformed over the full cycle (drawdown to recovery).
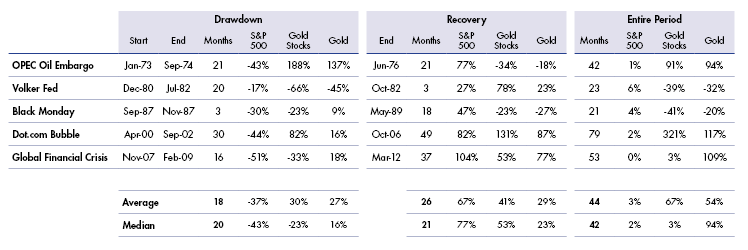
Source: VanEck, Bloomberg. Data as of March 2020. Index returns are cumulative. “S&P 500” represented by the S&P 500 TR Index (SPXT). “Gold Stocks” represented by Barron’s Gold Mining Index (BGMI) from January 1973 to inception date of the Philadelphia Gold and Silver Index (XAUTR) in January 1984 and XAUTR to the inception of the NYSE Arca Gold Miners Index Net Total Return (GDMNTR) in October 1993. “Gold” represented by gold spot prices
We believe that gold stocks, generally speaking, remain in fundamentally good shape.
- We expect no credit problems, while the lengths to which companies have gone to reduce costs and capital expenditures and to avoid mistakes of the past could translate to an additional near 40% increase in free cash flow, on average, for a gold price move from $1,600 to $1,800 (for seniors and mid-tiers).
Estimated Free Cash Flow for Gold Price Moves
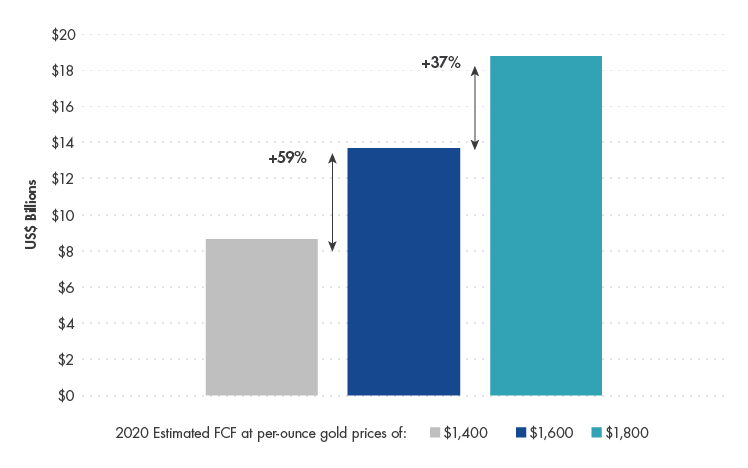
Source: VanEck, Bloomberg. Data as of March 2020. “Senior” miners defined by production levels of approximately 1.5-6.0 million ounces of gold per year (“Mid-Tier” approximately 0.3-1.5 million ounces per year).
DISCLOSURE
Please note that Van Eck Securities Corporation (an affiliated broker-dealer of Van Eck Associates Corporation) offers investments products that invest in the securities included in this commentary. This is not an offer to buy or sell, or a solicitation of any offer to buy or sell any of the securities mentioned herein.
Indices are not securities in which investments can be made. Barron’s Gold Mining Index (BGMI) is an industry average of publically traded gold mining stocks. NYSE Arca Gold Miners (GDMNTR) Index is a modified market capitalization weighted index comprised of publicly traded companies primarily involved in the mining of gold and silver in locations around the world. PHLX Gold/Silver Sector Index (XAU) is a capitalization-weighted index composed of companies involved in the gold or silver mining industry. Dow Jones Global Indexes (DJGI) is a family of float-adjusted, market-cap weighted international equity indexes, including world, region, and country indexes and economic sector, market sector, industry-group, and subgroup indexes.
This is not an offer to buy or sell, or a solicitation of any offer to buy or sell any of the securities mentioned herein. The information presented does not involve the rendering of personalized investment, financial, legal, or tax advice. Certain statements contained herein may constitute projections, forecasts and other forward looking statements, which do not reflect actual results, are valid as of the date of this communication and subject to change without notice. Information provided by third party sources are believed to be reliable and have not been independently verified for accuracy or completeness and cannot be guaranteed. The information herein represents the opinion of the author(s), but not necessarily those of VanEck. This content is published in the United States. Investors are subject to securities and tax regulations within their applicable jurisdictions that are not addressed herein.
The S&P 500 Index is a product of S&P Dow Jones Indices LLC and/or its affiliates and has been licensed for use by Van Eck Associates Corporation. Copyright© 2020 S&P Dow Jones Indices LLC, a division of S&P Global, Inc., and/or its affiliates. All rights reserved. Redistribution or reproduction in whole or in part are prohibited without written permission of S&P Dow Jones Indices LLC. For more information on any of S&P Dow Jones Indices LLC’s indices please visit www.spdji.com. S&P® is a registered trademark of S&P Global and Dow Jones® is a registered trademark of Dow Jones Trademark Holdings LLC. Neither S&P Dow Jones Indices LLC, Dow Jones Trademark Holdings LLC, their affiliates nor their third party licensors make any representation or warranty, express or implied, as to the ability of any index to accurately represent the asset class or market sector that it purports to represent and neither S&P Dow Jones Indices LLC, Dow Jones Trademark Holdings LLC, their affiliates nor their third party licensors shall have any liability for any errors, omissions, or interruptions of any index or the data included therein.
All investing is subject to risk, including the possible loss of the money you invest. As with any investment strategy, there is no guarantee that investment objectives will be met and investors may lose money. Diversification does not ensure a profit or protect against a loss in a declining market. Past performance is no guarantee of future results.
©2020 VanEck.