Miners Remain Undervalued Despite Gold’s Run
September 08, 2020
Read Time 7 MIN
Gold Reaches Another All-Time High
The strong gains of July carried on to early August. Gold reached an all-time high of $2,070 per ounce on August 6 amid U.S. dollar weakness and new lows in treasury yields. Gold then saw a sharp reversal and fell $207 over the following three trading days to an intraday low of $1,863 on August 12. The reversal was triggered by dollar strength, a move higher in interest rates and news of a Russian COVID vaccine. Gold had become over-bought in the past month, trading well above-trend, making it ripe for a correction. Once gold started to fall, momentum built as profit-taking set in and bullion exchange traded products saw their first redemptions since June. Gold recovered quickly and spent the rest of the month consolidating between $1,900 and $2,000 per ounce as the U.S. Dollar Index (DXY)1 made new two-year lows on August 31. Spot gold ended the month at $1,967.80 for an $8.06 (0.4%) loss.
Fed Shifts Inflation Target
U.S. Federal Reserve (Fed) Chairman Powell announced a significant shift in inflation targeting that will allow inflation to rise above the 2% target that the Fed has been trying to achieve for years. Aside from some volatility, gold did not react significantly to the announcement, as it has little bearing in the current markets. Pandemic-related deflation is the dominant economic force and it looks to be here for a while. An August 7 study by the Aspen Institute finds that without intervention, as many as 17 million U.S. households (40 million people) risk eviction by year-end. An August 29 Wall Street Journal article details a new wave of layoffs washing over the U.S., reflecting a shift in corporate thinking toward a more protracted crisis. New York is being transformed into a second-tier city mired in budget shortfalls and rising gun violence. The New York Times figures one-third of New York’s small businesses may be gone forever.
While there are no inflation worries at the moment, the Fed’s new softer stance risks sowing the seeds of unwanted inflation in the future, driven by massive fiscal and central bank liquidity and a reluctance or inability to raise rates to stop it. In all practicality, we don’t see why low inflation is such a bad thing. Consumers benefit when prices stay low or fall thanks to production efficiencies and technological advances. Perhaps the Fed’s motive becomes clearer when considering that a 2% inflation rate effectively reduces the value of U.S. government debt by 25% every 11 years.
Mali Coup Has No Effect on Gold Operations
During August, there was a military coup in Mali forcing the president to step down. The coup was relatively peaceful and the soldiers responsible have indicated an interim government will lead to new elections. Barrick and B2Gold have large gold operations in Mali. Both operations have seen no interruptions and are producing as normal. Nonetheless, B2Gold’s share price fell about 15% over two days on the news. We have been investing in West Africa for a long time and have seen coups and civil strife come and go. The market always reacts to the headlines, which has historically created a buying opportunity for savvy investors. Terrorist activity is a new risk that didn’t exist in past coups. Hopefully the military and foreign (mainly French) troops will thwart opportunistic terrorist strikes. In any case, the gold mines are far from the capital, Bamako, and very far from the terrorist activity in the north. No matter who is in power in Mali, everyone knows it is in the country’s best interest to keep the gold mines running.
Strong Run Does Not Mean Gold Stocks Are Overvalued
A common question we get after a strong run is whether stocks are overvalued. Since gold broke out on June 20, 2019 into its current trend, the gold price has gained 45% and the NYSE Gold Miners Index (GDMNTR)2 79%. However, this outperformance has not led to over-valued stocks. This is because most of the costs of mining are fixed, so any price increase is pure profit (net of taxes). An analysis of our senior/mid-tier4 universe shows that on average, an 11% increase in the gold price from $1,800 to $2,000 per ounce brings a potential 29% boost to free-cash-flow. Resources in the ground also become more valuable at higher prices. This may raise the value of a company, such that gold stocks generally have to outperform gold by over 30% in order for valuations to climb. We have yet to see such outperformance in this market. RBC Capital Markets calculates price/cash flow (P/CF) rose from 7.0x in June 2019 to 8.0x currently. This is below the long-term average of 10.9x and far below the bull market average of 15.1x. The last time P/CF valuation reached the average was the first half of 2016 when gold gained 25% and the GDMNTR 103%, while P/CF advanced from 5.7x to 10.7x.
Forward Price-to-Cash-Flow of Senior & Mid-Tier Miners3
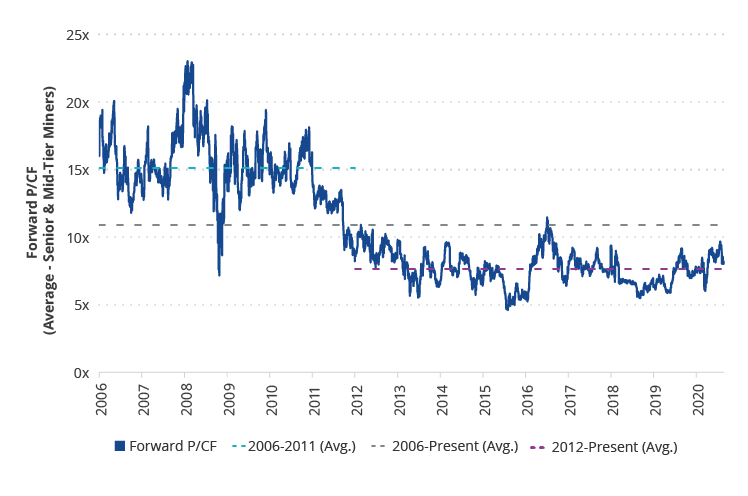
Source: RBC Capital Markets. Data as of August 26, 2020. Past performance is no guarantee of future results.
When determining financial returns and making construction decisions for gold projects, companies have been using the base price, or lowest price that gold might go in order to insure that projects prosper through the cycle. Prior to the recent price rise, gold trended between $1,100 and $1,300 per ounce for years. As a result, companies have been using $1,200 or thereabouts to run their project models. If a project didn’t generate double-digit returns at $1,200, it didn’t get built.
We have talked often of the new financial and operating discipline across the industry that we have not seen in past cycles. We have also said many times that when generalist investors take a look at this sector they will like what they see. Berkshire Hathaway’s new stake in Barrick bears this out. Barrick and many other companies we invest in have every intention of maintaining their discipline by controlling costs, controlling debt and using $1,200 per ounce as the benchmark for evaluating capital projects. However, the recent rise in prices have caused some companies to relax their standards.
With higher gold prices we will see lower quality gold mines being built. These are deposits that were not economic at lower prices because they would have high operating costs and/or high capital costs due to low-grades and/or mining challenges. An example of this is Iamgold’s Cote Lake project, a 6.6 million ounce low-grade gold deposit in Ontario, Canada that Iamgold figures will cost $1.3 billion to build. In January 2019, Iamgold announced its decision not to proceed with construction of Cote in order to wait for improved market conditions. Then on July 21, 2020, Iamgold announced it will proceed with construction, raising its gold price assumption from $1,250 to $1,350 in order to justify its decision. A handful of other companies have also boosted their project price assumptions to as much as $1,541 per ounce. These companies are typically facing a choice between falling production or maintaining production through either high-cost acquisitions or low quality projects. For them, developing low-quality projects within their portfolio of properties is the best way forward. There are also a growing number of junior companies that are now able raise money to develop low-quality gold deposits.
We are forecasting gold prices of over $3,000 per ounce, and if correct, all companies will win. However, it would be reckless to build a mine and risk a company based on such forecasts. It takes up to seven years to construct a mine and achieve payback of investment if all goes as planned. In the last gold cycle, gold topped at $1,921 and bottomed at $1,050, much lower than most had anticipated. Gold is again in the $2,000 neighborhood. Everyone knows there will be another bear market but no one can know whether it comes in a year or a decade. If it comes sooner than we anticipate, projects that are using higher price assumptions might face failure.
The industry is beginning to bifurcate between dividend-paying companies with high quality, low cost mines and those with lower quality projects and higher risks. Until there is confirmation that higher gold prices are here to stay, it seems too early in this cycle to speculate on companies that aren’t maintaining the discipline learned from the mistakes of the last cycle.
Download Commentary PDF with Fund specific information and performance.
IMPORTANT DISCLOSURES
Please note that Van Eck Securities Corporation (an affiliated broker-dealer of Van Eck Associates Corporation) may offer investments products that invest in the asset class(es) or industries discussed herein.
This is not an offer to buy or sell, or a recommendation to buy or sell any of the securities mentioned herein. The information presented does not involve the rendering of personalized investment, financial, legal or tax advice. Certain statements contained herein may constitute projections, forecasts and other forward looking statements, which do not reflect actual results, are valid as of the date of this communication and subject to change without notice. Information provided by third party sources are believed to be reliable and have not been independently verified for accuracy or completeness and cannot be guaranteed. The information herein represents the opinion of the author(s), but not necessarily those of VanEck.
1U.S. Dollar Index (DXY) indicates the general international value of the U.S. dollar by averaging the exchange rates between the U.S. dollar and six major world currencies. 2NYSE Arca Gold Miners Index (GDMNTR) is a modified market capitalization-weighted index comprised of publicly traded companies involved primarily in the mining for gold. 3“Seniors” and “Mid-Tiers” are gold mining companies that produce, approximately and respectively, 1.5-6.0 and 0.3-1.5 million ounces of gold per year.
Any indices listed are unmanaged indices and include the reinvestment of all dividends, but do not reflect the payment of transaction costs, advisory fees or expenses that are associated with an investment in a Fund. Certain indices may take into account withholding taxes. An index’s performance is not illustrative of a Fund’s performance. Indices are not securities in which investments can be made.
NYSE Arca Gold Miners Index is a service mark of ICE Data Indices, LLC or its affiliates (“ICE Data”) and has been licensed for use by VanEck Vectors ETF Trust (the “Trust”) in connection with VanEck Vectors Gold Miners ETF (the “Fund”). Neither the Trust nor the Fund is sponsored, endorsed, sold or promoted by ICE Data. ICE Data makes no representations or warranties regarding the Trust or the Fund or the ability of the NYSE Arca Gold Miners Index to track general stock market performance.
ICE DATA MAKES NO EXPRESS OR IMPLIED WARRANTIES, AND HEREBY EXPRESSLY DISCLAIMS ALL WARRANTIES OF MERCHANTABILITY OR FITNESS FOR A PARTICULAR PURPOSE WITH RESPECT TO THE NYSE ARCA GOLD MINERS INDEX OR ANY DATA INCLUDED THEREIN. IN NO EVENT SHALL ICE DATA HAVE ANY LIABILITY FOR ANY SPECIAL, PUNITIVE, INDIRECT, OR CONSEQUENTIAL DAMAGES (INCLUDING LOST PROFITS), EVEN IF NOTIFIED OF THE POSSIBILITY OF SUCH DAMAGES.
MVIS Global Junior Gold Miners Index (the “Index”) is the exclusive property of MarketVector Indexes GmbH (a wholly owned subsidiary of Van Eck Associates Corporation), which has contracted with Solactive AG to maintain and calculate the Index. Solactive AG uses its best efforts to ensure that the Index is calculated correctly. Irrespective of its obligations towards MarketVector Indexes GmbH, Solactive AG has no obligation to point out errors in the Index to third parties. The VanEck Vectors Junior Gold Miners ETF (the “Fund”) is not sponsored, endorsed, sold or promoted by MarketVector Indexes GmbH and MarketVector Indexes GmbH makes no representation regarding the advisability of investing in the Fund.
The S&P 500® Index is a product of S&P Dow Jones Indices LLC and/or its affiliates and has been licensed for use by Van Eck Associates Corporation. Copyright © 2018 S&P Dow Jones Indices LLC, a division of S&P Global, Inc., and/or its affiliates. All rights reserved. Redistribution or reproduction in whole or in part are prohibited without written permission of S&P Dow Jones Indices LLC. For more information on any of S&P Dow Jones Indices LLC’s indices please visit www.spdji.com. S&P® is a registered trademark of S&P Global and Dow Jones® is a registered trademark of Dow Jones Trademark Holdings LLC. Neither S&P Dow Jones Indices LLC, Dow Jones Trademark Holdings LLC, their affiliates nor their third party licensors make any representation or warranty, express or implied, as to the ability of any index to accurately represent the asset class or market sector that it purports to represent and neither S&P Dow Jones Indices LLC, Dow Jones Trademark Holdings LLC, their affiliates nor their third party licensors shall have any liability for any errors, omissions, or interruptions of any index or the data included therein.
All investing is subject to risk, including the possible loss of the money you invest. As with any investment strategy, there is no guarantee that investment objectives will be met and investors may lose money. Diversification does not ensure a profit or protect against a loss in a declining market. Past performance is no guarantee of future results.
Related Funds
IMPORTANT DISCLOSURES
Please note that Van Eck Securities Corporation (an affiliated broker-dealer of Van Eck Associates Corporation) may offer investments products that invest in the asset class(es) or industries discussed herein.
This is not an offer to buy or sell, or a recommendation to buy or sell any of the securities mentioned herein. The information presented does not involve the rendering of personalized investment, financial, legal or tax advice. Certain statements contained herein may constitute projections, forecasts and other forward looking statements, which do not reflect actual results, are valid as of the date of this communication and subject to change without notice. Information provided by third party sources are believed to be reliable and have not been independently verified for accuracy or completeness and cannot be guaranteed. The information herein represents the opinion of the author(s), but not necessarily those of VanEck.
1U.S. Dollar Index (DXY) indicates the general international value of the U.S. dollar by averaging the exchange rates between the U.S. dollar and six major world currencies. 2NYSE Arca Gold Miners Index (GDMNTR) is a modified market capitalization-weighted index comprised of publicly traded companies involved primarily in the mining for gold. 3“Seniors” and “Mid-Tiers” are gold mining companies that produce, approximately and respectively, 1.5-6.0 and 0.3-1.5 million ounces of gold per year.
Any indices listed are unmanaged indices and include the reinvestment of all dividends, but do not reflect the payment of transaction costs, advisory fees or expenses that are associated with an investment in a Fund. Certain indices may take into account withholding taxes. An index’s performance is not illustrative of a Fund’s performance. Indices are not securities in which investments can be made.
NYSE Arca Gold Miners Index is a service mark of ICE Data Indices, LLC or its affiliates (“ICE Data”) and has been licensed for use by VanEck Vectors ETF Trust (the “Trust”) in connection with VanEck Vectors Gold Miners ETF (the “Fund”). Neither the Trust nor the Fund is sponsored, endorsed, sold or promoted by ICE Data. ICE Data makes no representations or warranties regarding the Trust or the Fund or the ability of the NYSE Arca Gold Miners Index to track general stock market performance.
ICE DATA MAKES NO EXPRESS OR IMPLIED WARRANTIES, AND HEREBY EXPRESSLY DISCLAIMS ALL WARRANTIES OF MERCHANTABILITY OR FITNESS FOR A PARTICULAR PURPOSE WITH RESPECT TO THE NYSE ARCA GOLD MINERS INDEX OR ANY DATA INCLUDED THEREIN. IN NO EVENT SHALL ICE DATA HAVE ANY LIABILITY FOR ANY SPECIAL, PUNITIVE, INDIRECT, OR CONSEQUENTIAL DAMAGES (INCLUDING LOST PROFITS), EVEN IF NOTIFIED OF THE POSSIBILITY OF SUCH DAMAGES.
MVIS Global Junior Gold Miners Index (the “Index”) is the exclusive property of MarketVector Indexes GmbH (a wholly owned subsidiary of Van Eck Associates Corporation), which has contracted with Solactive AG to maintain and calculate the Index. Solactive AG uses its best efforts to ensure that the Index is calculated correctly. Irrespective of its obligations towards MarketVector Indexes GmbH, Solactive AG has no obligation to point out errors in the Index to third parties. The VanEck Vectors Junior Gold Miners ETF (the “Fund”) is not sponsored, endorsed, sold or promoted by MarketVector Indexes GmbH and MarketVector Indexes GmbH makes no representation regarding the advisability of investing in the Fund.
The S&P 500® Index is a product of S&P Dow Jones Indices LLC and/or its affiliates and has been licensed for use by Van Eck Associates Corporation. Copyright © 2018 S&P Dow Jones Indices LLC, a division of S&P Global, Inc., and/or its affiliates. All rights reserved. Redistribution or reproduction in whole or in part are prohibited without written permission of S&P Dow Jones Indices LLC. For more information on any of S&P Dow Jones Indices LLC’s indices please visit www.spdji.com. S&P® is a registered trademark of S&P Global and Dow Jones® is a registered trademark of Dow Jones Trademark Holdings LLC. Neither S&P Dow Jones Indices LLC, Dow Jones Trademark Holdings LLC, their affiliates nor their third party licensors make any representation or warranty, express or implied, as to the ability of any index to accurately represent the asset class or market sector that it purports to represent and neither S&P Dow Jones Indices LLC, Dow Jones Trademark Holdings LLC, their affiliates nor their third party licensors shall have any liability for any errors, omissions, or interruptions of any index or the data included therein.
All investing is subject to risk, including the possible loss of the money you invest. As with any investment strategy, there is no guarantee that investment objectives will be met and investors may lose money. Diversification does not ensure a profit or protect against a loss in a declining market. Past performance is no guarantee of future results.