Moat Stocks: Poised for a Comeback?
November 06, 2020
Read Time 5 MIN
As the markets work through the turmoil that has accompanied this U.S. election season, I’m reminded of a research paper published this spring by Andrew Lane of Morningstar. The paper looked at the Morningstar® Wide Moat Focus IndexSM (the “Index”) and its excess returns relative to the broad equity markets following months with both significant and modest market drawdowns. We highlighted his findings here several months ago. The key takeaway is that the Index has, on average, posted impressive excess returns in the one- and three-year periods following months in which the market had sold-off. However, in looking at the data, they also show that the Index outperforms, on average, following months when the market performed well.
With talk of excess returns, it’s important to address the elephant in the room. Since late June, the Index has underperformed the S&P 500 Index. Underperformance was primarily concentrated in June, July and August, and returns bounced back in line with the S&P 500 in September and October. But, the summer months have certainly left their mark on the Index. Through October, year-to-date total return for the Index was -2.90% versus 2.77% for the S&P 500.
Stock Selection: In Good Times and Bad
Stock selection has historically been the driver of excess returns in good times, and it has also been the driving force behind this short period of underperformance. Though the Index shifted its exposure further away from big tech and into select value opportunities, stock selection within the industrials and information technology sectors—and not the underweight to information technology—contributed the most to the Index’s underperformance through the summer months.
The Index allocated to industrials firm Boeing (BA) in March and June at historically low valuations. As uncertainty around the global pandemic grew, the aerospace and defense firm’s shares slid through the summer months, but Morningstar remains confident that secular forces driving air travel will return in a post-pandemic world. Additionally, regulatory steps have progressed toward receiving an airworthiness directive from the FAA, which Morningstar expects Boeing to receive this quarter. It may take time to realize any potential benefit of the Boeing allocation in the Index, but in the interim Morningstar believes its substantial cash and short-term investment portfolio will allow the firm to weather the storm until the macro environment stabilizes.
Within the tech sector, exposure to Blackbaud (BLKB), Intel (INTC) and Guidewire Software (GWRE) detracted from performance relative the S&P 500.
Blackbaud offers a suite of software solutions for the “social good” community, including nonprofits, foundations, corporations, education institutions, healthcare institutions and individual activists. Morningstar believes Blackbaud is deeply entrenched in the social good community, and its wide economic moat is rooted in high customer switching costs and intangible assets. However, the company remains vulnerable to adverse macroeconomic conditions as its customer base faces continued budget pressure. According to Morningstar, there may be no near-term catalyst, but shares are attractive for patient investors.
Intel reported mixed Q3 results in late October, highlighting several offsetting benefits and detractors brought on by pandemic-accelerated trends. While Intel has benefited from expedited digital transformation boosting cloud and notebook PC demand to support working and learning from home, Morningstar highlights the negative impact to Internet of Things, among other offsetting pressures. With its shares trading at nearly 40% of fair value, Morningstar views the long-term prospects as promising.
Guidewire is a leading software provider for the property and casualty insurance industry that has been transitioning from downloaded software to cloud-based solutions. Its wide economic moat is rooted in customer switching costs as is common in the software industry. Its shift to the software as a service (SaaS) model was driven by the firm’s belief that the pricing opportunity for a SaaS transition is two to three times that of an on-premise installation model, according to Morningstar. Shares remain approximately 15% undervalued relative to Morningstar’s fair value estimate.
Moat Index Outperformance Historically Follows Underperformance
Despite evidence of the Index’s long-term success relative to the S&P 500, periods of underperformance certainly catch one’s attention. Looking at previous periods of underperformance can be informative. The chart below compares the average excess returns of the Index versus the S&P 500 following months in which the Index underperformed and outperformed the S&P 500 to varying degrees. We can see that the Index has generated stronger annualized excess returns, on average, in periods following months of underperformance than outperformance of the S&P 500. The largest average excess returns has come after the Index experienced a month with greater than 2% underperformance. This summer, the Index underperformed the S&P 500 by 1.6% in June, 3.2% in July and 1.1% in August.
Moat Index Outperformance Strongest Following Underperformance
2/28/2007 – 10/31/2020
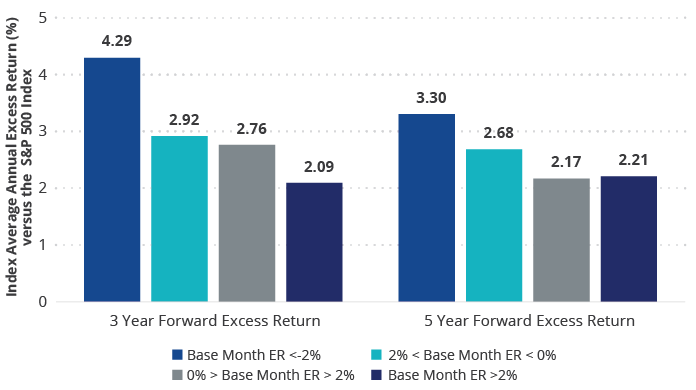
Source: Morningstar. Data as of 10/31/2020. Chart illustrates the excess returns of the Morningstar Wide Moat Focus Index vs. S&P 500 Index in 3- and 5-year periods following months in which the Morningstar Wide Moat Focus Index underperformed or outperformed the S&P 500 Index to various degrees. Performance data quoted represents past performance. Past performance is not a guarantee of future results. Index performance is not illustrative of fund performance. Prior to 4/24/2012, VanEck Vectors Morningstar Wide Moat ETF had no operating history. For fund performance current to the most recent month-end, visit vaneck.com.
VanEck Vectors Morningstar Wide ETF (MOAT) seeks to replicate as closely as possible, before fees and expenses the price and yield performance of the Morningstar Wide Moat Focus Index.
For further reading:
Important Disclosures
The information presented does not involve the rendering of personalized investment, financial, legal, or tax advice. Certain statements contained herein may constitute projections, forecasts and other forward looking statements, which do not reflect actual results, are valid as of the date of this communication and subject to change without notice. Information provided by third party sources are believed to be reliable and have not been independently verified for accuracy or completeness and cannot be guaranteed. The information herein represents the opinion of the author(s), but not necessarily those of VanEck.
This commentary is not intended as a recommendation to buy or to sell any of the sectors or securities mentioned herein. Holdings will vary for the MOAT ETF and its corresponding Index. For a complete list of holdings in the ETF, please click here: https://www.vaneck.com/etf/equity/moat/holdings/.
An investor cannot invest directly in an index. Returns reflect past performance and do not guarantee future results. Results reflect the reinvestment of dividends and capital gains, if any. Certain indices may take into account withholding taxes. Index returns do not represent Fund returns. The Index does not charge management fees or brokerage expenses, nor does the Index lend securities, and no revenues from securities lending were added to the performance shown.
Fair value estimate: the Morningstar analyst's estimate of what a stock is worth.
Price/Fair Value: ratio of a stock's trading price to its fair value estimate.
The Morningstar® Wide Moat Focus IndexSM was created and is maintained by Morningstar, Inc. Morningstar, Inc. does not sponsor, endorse, issue, sell, or promote the VanEck Vectors Morningstar Wide Moat ETF and bears no liability with respect to that ETF or any security. Morningstar® is a registered trademark of Morningstar, Inc. Morningstar® Wide Moat Focus IndexSM is a service mark of Morningstar, Inc.
The Morningstar® Wide Moat Focus IndexSM consists of U.S. companies identified as having sustainable, competitive advantages and whose stocks are attractively priced, according to Morningstar.
Effective June 20, 2016, Morningstar implemented several changes to the Morningstar Wide Moat Focus Index construction rules. Among other changes, the index increased its constituent count from 20 stocks to at least 40 stocks and modified its rebalance and reconstitution methodology. These changes may result in more diversified exposure, lower turnover and longer holding periods for index constituents than under the rules in effect prior to this date.
The S&P 500® Index is a product of S&P Dow Jones Indices LLC and/or its affiliates and has been licensed for use by Van Eck Associates Corporation. Copyright © 2020 S&P Dow Jones Indices LLC, a division of S&P Global, Inc., and/or its affiliates. All rights reserved. Redistribution or reproduction in whole or in part are prohibited without written permission of S&P Dow Jones Indices LLC. For more information on any of S&P Dow Jones Indices LLC’s indices please visit www.spdji.com. S&P® is a registered trademark of S&P Global and Dow Jones® is a registered trademark of Dow Jones Trademark Holdings LLC. Neither S&P Dow Jones Indices LLC, Dow Jones Trademark Holdings LLC, their affiliates nor their third party licensors make any representation or warranty, express or implied, as to the ability of any index to accurately represent the asset class or market sector that it purports to represent and neither S&P Dow Jones Indices LLC, Dow Jones Trademark Holdings LLC, their affiliates nor their third party licensors shall have any liability for any errors, omissions, or interruptions of any index or the data included therein.
An investment in the VanEck Vectors Morningstar Wide Moat ETF (MOAT®) may be subject to risks which include, among others, investing in equity securities, consumer discretionary, financials, health care, industrials and information technology sectors, medium-capitalization companies, market, operational, index tracking, authorized participant concentration, no guarantee of active trading market, trading issues, passive management, fund shares trading, premium/discount risk and liquidity of fund shares, non-diversified, and concentration risks, which may make these investments volatile in price or difficult to trade. Medium-capitalization companies may be subject to elevated risks.
Investing involves substantial risk and high volatility, including possible loss of principal. An investor should consider a Fund's investment objective, risks, charges and expenses carefully before investing. To obtain a prospectus and summary prospectus for VanEck Funds and VanEck Vectors ETFs, which contain this and other information, call 800.826.2333 or visit vaneck.com. Please read the prospectus and summary prospectus for VanEck Funds and VanEck Vectors ETFs carefully before investing.Related Funds
Important Disclosures
The information presented does not involve the rendering of personalized investment, financial, legal, or tax advice. Certain statements contained herein may constitute projections, forecasts and other forward looking statements, which do not reflect actual results, are valid as of the date of this communication and subject to change without notice. Information provided by third party sources are believed to be reliable and have not been independently verified for accuracy or completeness and cannot be guaranteed. The information herein represents the opinion of the author(s), but not necessarily those of VanEck.
This commentary is not intended as a recommendation to buy or to sell any of the sectors or securities mentioned herein. Holdings will vary for the MOAT ETF and its corresponding Index. For a complete list of holdings in the ETF, please click here: https://www.vaneck.com/etf/equity/moat/holdings/.
An investor cannot invest directly in an index. Returns reflect past performance and do not guarantee future results. Results reflect the reinvestment of dividends and capital gains, if any. Certain indices may take into account withholding taxes. Index returns do not represent Fund returns. The Index does not charge management fees or brokerage expenses, nor does the Index lend securities, and no revenues from securities lending were added to the performance shown.
Fair value estimate: the Morningstar analyst's estimate of what a stock is worth.
Price/Fair Value: ratio of a stock's trading price to its fair value estimate.
The Morningstar® Wide Moat Focus IndexSM was created and is maintained by Morningstar, Inc. Morningstar, Inc. does not sponsor, endorse, issue, sell, or promote the VanEck Vectors Morningstar Wide Moat ETF and bears no liability with respect to that ETF or any security. Morningstar® is a registered trademark of Morningstar, Inc. Morningstar® Wide Moat Focus IndexSM is a service mark of Morningstar, Inc.
The Morningstar® Wide Moat Focus IndexSM consists of U.S. companies identified as having sustainable, competitive advantages and whose stocks are attractively priced, according to Morningstar.
Effective June 20, 2016, Morningstar implemented several changes to the Morningstar Wide Moat Focus Index construction rules. Among other changes, the index increased its constituent count from 20 stocks to at least 40 stocks and modified its rebalance and reconstitution methodology. These changes may result in more diversified exposure, lower turnover and longer holding periods for index constituents than under the rules in effect prior to this date.
The S&P 500® Index is a product of S&P Dow Jones Indices LLC and/or its affiliates and has been licensed for use by Van Eck Associates Corporation. Copyright © 2020 S&P Dow Jones Indices LLC, a division of S&P Global, Inc., and/or its affiliates. All rights reserved. Redistribution or reproduction in whole or in part are prohibited without written permission of S&P Dow Jones Indices LLC. For more information on any of S&P Dow Jones Indices LLC’s indices please visit www.spdji.com. S&P® is a registered trademark of S&P Global and Dow Jones® is a registered trademark of Dow Jones Trademark Holdings LLC. Neither S&P Dow Jones Indices LLC, Dow Jones Trademark Holdings LLC, their affiliates nor their third party licensors make any representation or warranty, express or implied, as to the ability of any index to accurately represent the asset class or market sector that it purports to represent and neither S&P Dow Jones Indices LLC, Dow Jones Trademark Holdings LLC, their affiliates nor their third party licensors shall have any liability for any errors, omissions, or interruptions of any index or the data included therein.
An investment in the VanEck Vectors Morningstar Wide Moat ETF (MOAT®) may be subject to risks which include, among others, investing in equity securities, consumer discretionary, financials, health care, industrials and information technology sectors, medium-capitalization companies, market, operational, index tracking, authorized participant concentration, no guarantee of active trading market, trading issues, passive management, fund shares trading, premium/discount risk and liquidity of fund shares, non-diversified, and concentration risks, which may make these investments volatile in price or difficult to trade. Medium-capitalization companies may be subject to elevated risks.
Investing involves substantial risk and high volatility, including possible loss of principal. An investor should consider a Fund's investment objective, risks, charges and expenses carefully before investing. To obtain a prospectus and summary prospectus for VanEck Funds and VanEck Vectors ETFs, which contain this and other information, call 800.826.2333 or visit vaneck.com. Please read the prospectus and summary prospectus for VanEck Funds and VanEck Vectors ETFs carefully before investing.