Welcome to VanEck
Select Investor Type
12 August 2026
Key Takeaways
Gold posted a small gain (+0.95%) for the month, closing at US$4,046.15 on July 31, two days after the U.S. Federal Reserve announced its decision to keep rates unchanged at its July meeting. Gold has continued to hold above $4,000 per ounce as investors continued to assess the outlook for monetary policy and the next Federal Open Market Committee meeting, scheduled for September 16.1
According to the World Gold Council’s Q2 2026 Gold Demand Trends report, total gold demand held steady at 1,269 tonnes, unchanged year over year and up 1% quarter over quarter, with weaker investment demand offset by stronger central bank buying. It was a volatile month for gold mining equities, bouncing back early in July before losing steam as gold pulled back. The MarketVector Global Gold Miners Index (MVGDXTR, total return) was down 1.26% for the month. The “TR” in MVGDXTR denotes a total return index, meaning performance is calculated with dividends reinvested. This index figure is shown on a gross basis: it does not reflect commissions, fees, ongoing charges or other costs an investor would incur, which reduce returns. For illustration, annual charges of 0.50% would have reduced the stated −1.26% monthly return to approximately −1.30%, and would compound to reduce returns further over longer holding periods. An index is unmanaged and it is not possible to invest directly in an index.2
Investing is subject to risk, including the possible loss of principal. Index performance is shown in US dollars (USD); for investors in other currencies the return may increase or decrease as a result of currency fluctuations. Past performance is not a reliable indicator of future results.
One of the most common concerns we hear from investors considering an allocation to gold mining equities is the risk that they will get crushed by rising production costs. This is a valid concern in an environment defined by geopolitical tension, elevated energy prices, and persistent inflation. But we think it is largely overstated. There is something very unique and interesting about the gold mining sector; the very forces investors most fear could pressure gold miners are, in many cases, the same forces that drive gold prices higher.
To understand why miners are better positioned than their cost structures initially suggest, it helps to start with gold itself. Gold has a well-documented historical relationship with inflation. During the inflationary surge of the 1970s, gold appreciated dramatically in real terms. During the post-2008 quantitative easing era and again following COVID-era stimulus, gold responded to the same monetary and fiscal forces that were driving up the cost of everything else.
This matters enormously for miners. Unlike most industrial companies, where rising input costs squeeze margins with no corresponding revenue offset, gold miners benefit from a natural hedge: the very macroeconomic environment that pressures their cost structure, including inflation, currency debasement, and monetary uncertainty has historically pushed their primary revenue driver, the gold price, higher at the same time. This is a structural feature of the asset class that we don’t think is widely recognized.
The current gold bull run has delivered something the 2000–2011 cycle largely failed to: sustained margin expansion. Today's miners have taken a fundamentally different approach by maintaining rigorous cost discipline, driving operational improvements to counter industry-wide cost inflation, and adopting conservative mineral resource strategies anchored to gold prices well below spot. They have also avoided the grade deterioration that plagued earlier cycles. The result is that gold prices have risen far faster than mining costs, pushing margins to historical record levels.
This “natural hedge” we highlight for the gold mining industry is visible today in energy markets. Investors look at elevated oil and diesel prices and reasonably worry about mining operating costs. But it is worth pausing on why energy prices are elevated. A primary driver is geopolitical instability, including conflict in the Middle East, the war in Ukraine, fragmentation of global supply chains and growing resource nationalism. They are precisely the type of conditions under which gold has historically served its most important role: a safe haven asset in times of uncertainty.
Part of the reason energy cost fears are overstated is that many investors overestimate how much of the cost structure is actually fuel-driven. The reality of a typical all-in sustaining cost (AISC) breakdown looks something like this:
All-in sustaining cost (AISC) is an industry measure of what it costs a miner to produce one ounce of gold and keep the mine running at its current level of output. It captures direct mining and processing costs, on-site labor, fuel and energy, consumables, royalties and production taxes, corporate overhead, and the sustaining capital expenditure and mine development needed to maintain existing production. It excludes the cost of building new mines and major expansion projects. AISC is used as the primary cost benchmark for gold mining companies because it is more complete than simple cash costs and allows the profitability of different miners to be compared on a per-ounce basis against the gold price. Definitions are not fully standardized, so AISC may be calculated differently between companies.
Take Newmont’s 2026 direct operating cost breakdown (chart below). Newmont, the largest gold mining company in the world, assumed a Brent price of US$70 per barrel for 2026. It estimates that for every US$10/barrel move in the price of Brent crude, its costs would move +/- US$60 million, which is about US$11 per ounce of gold produced. That is very manageable, particularly at current gold price levels, where operating margins remain exceptionally strong.
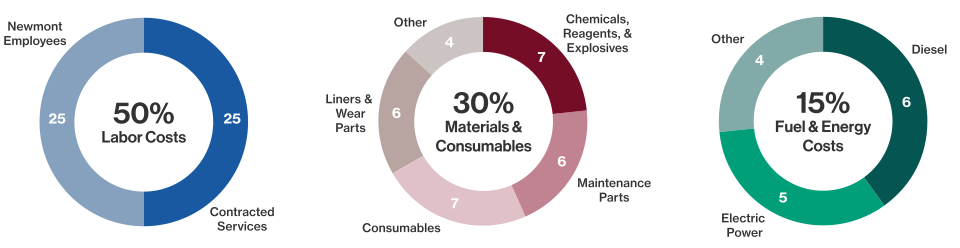
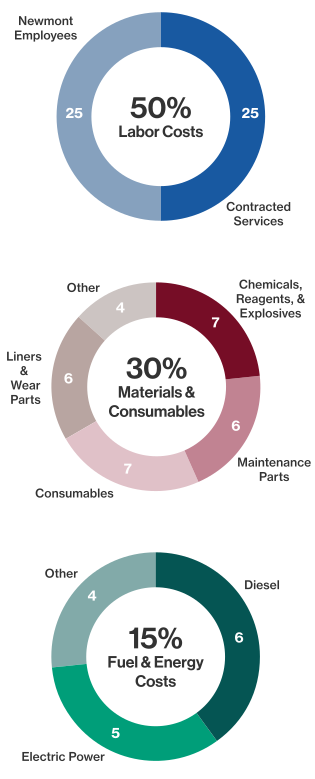
Source: Newmont. Data as of 6/30/2026. Represents results based on 2026 Guidance. ”Other” category of 5% primarily includes freight, technology-related costs, employee administrative costs, rents and operating leases.
The oil price sensitivity is there, but it is not the dominant cost factor. It is one component among several. Many miners meaningfully reduce their fuel exposure through long-term supply contracts, renewable sources of energy, and active hedging programs.
Gold companies’ earnings season kicked off at the end of July. Overall, we estimate that operating results have been mostly in line with expectations so far, and Q2 all-in sustaining costs are on average coming in below the US$2,000 per ounce level. With gold trading around US$4,000 per ounce at present, the sector is generating operating margins of roughly US$2,000 per ounce, among the widest in the industry's history.
Even under a stress scenario in which gold prices remain flat and costs rise 10–15%, the sector still generates substantial free cash flow per ounce. The margin cushion built up at current gold prices is meaningful. Companies do not need gold to keep rising to remain highly profitable. They need gold to remain broadly range-bound, which is a much lower bar.
This resilience matters because it changes what miners can do with their cash. We expect senior and mid-tier companies in the gold space to remain committed to:
This is capital allocation discipline in a strong earnings environment, and it is a meaningful shift from how the industry has historically behaved.
The benefits described in this material must be weighed against material risks. Investors may lose some or all of the amount invested.
Commodity price volatility: Gold mining equities are highly sensitive to the gold price, which can fall sharply and unpredictably. A falling gold price compresses margins disproportionately and can turn profitable operations loss-making.
Sector and issuer concentration: Exposure is concentrated in a single sector and a limited number of issuers, making it more volatile than a diversified equity investment. Individual mine failures, strikes or accidents can materially affect performance.
Currency exposure: Gold and mining revenues are typically denominated in US dollars while investors' costs and mining operating costs may be in other currencies. Where past performance or other figures are shown in US dollars (USD), the return may increase or decrease as a result of currency fluctuations.
Geopolitical and operational risk in mining jurisdictions: Mines operate in jurisdictions exposed to resource nationalism, expropriation, permit withdrawal, tax and royalty changes, political instability, and civil unrest. Operational risks include cost overruns, grade deterioration, water and power constraints, equipment failure, and environmental or safety incidents.
Inflation and input cost risk: The natural hedge described in this material is a historical relationship and is not guaranteed. Costs may rise while the gold price stagnates or falls.
There is no assurance that margins, free cash flow, dividends or buybacks described in this material will be sustained. Past performance is not a reliable indicator of future results.
The concern about cost inflation for gold miners is not unfounded. In our research and evaluation of these companies, we are intensely focused on the cost trends, and during our frequent management meetings, they are always a key topic. However, when viewed in full context, the cost outlook for this industry is not quite as concerning as it may seem at first glance. Gold miners operate with a natural inflation hedge on the revenue side. Their largest cost driver is labor, not fuel. Their energy exposure, while real, is partially hedged and structurally smaller than many assume. And the geopolitical forces driving energy prices higher are among the most reliable catalysts for gold price appreciation.
Today, gold miners are generating the kind of free cash flow that allows them to reward shareholders, service obligations and invest in future production, all without needing a heroic gold price assumption. They are, in many respects, in the strongest financial position the sector has seen in years.
For investors considering an allocation who are worried about cost pressures eroding the opportunity, we would suggest reframing the question. The risk is not that margins collapse under cost pressure. The more relevant question is whether investors are placing too much emphasis on cost pressures without giving equal weight to the sector's strong margins and cash generation.
To receive more Gold Investing insights, sign up to our newsletter.
1 World Gold Council (31.07.2026)
2 MarketVector (31.07.2026)
3 Ranges are illustrative and may vary by asset, jurisdiction and operating profile.
Sources for data/information unless otherwise indicated: Bloomberg and company research, July 2026.
IMPORTANT INFORMATION
This is a marketing communication.
For investors in Switzerland: VanEck Switzerland AG, with registered office in Genferstrasse 21, 8002 Zurich, Switzerland, has been appointed as distributor of VanEck´s products in Switzerland by the Management Company VanEck Asset Management B.V. (“ManCo”). The representative in Switzerland is Zeidler Regulatory Services (Switzerland) AG, Stadthausstrasse 14, CH-8400 Winterthur, Switzerland. Swiss paying agent: Helvetische Bank AG, Seefeldstrasse 215, CH-8008 Zürich.
For investors in the UK: This material is directed exclusively at Professional Clients and Eligible Counterparties and is not intended for Retail Clients. Retail Clients should not rely on the information provided and should seek assistance from an authorised financial intermediary for all investments and advice. This is a marketing communication targeted to FCA regulated financial intermediaries. VanEck Securities UK Limited (FRN: 1002854) is an Appointed Representative of Strata Global Limited (FRN: 563834), which is authorised and regulated by the Financial Conduct Authority (FCA) in the UK, to distribute VanEck´s products to FCA regulated firms such as financial intermediaries and Wealth Managers. The Fund is recognised in the UK under the Overseas Funds Regime but is not a UK-authorised Fund.UK investors should note that complaints in relation to the Fund cannot be referred to the Financial Ombudsman Service, and any related claims for losses will not be covered by the Financial Services Compensation Scheme.
This information originates from VanEck (Europe) GmbH, which is authorized as an EEA investment firm under the Markets in Financial Instruments Directive (“MiFiD”). VanEck (Europe) GmbH has its registered address at Kreuznacher Str. 30, 60486 Frankfurt, Germany, and has been appointed as distributor of VanEck products in Europe by the ManCo, which is incorporated under Dutch law and registered with the Dutch Authority for the Financial Markets (AFM).
This material is only intended for general and preliminary information and does not constitute an investment, legal or tax advice. VanEck (Europe) GmbH and its associated and affiliated companies (together “VanEck”) assume no liability with regards to any investment, divestment or retention decision on the basis of this information. All relevant documentation must be first consulted.
The views and opinions expressed are those of the author(s) but not necessarily those of VanEck. Opinions are current as of the publication date and are subject to change with market conditions. Information provided by third party sources is believed to be reliable and has not been independently verified for accuracy or completeness and cannot be guaranteed.
The MarketVector™ Global Gold Miners Index is the exclusive property of MarketVector Indexes GmbH (a wholly owned subsidiary of Van Eck Associates Corporation), which has contracted with Solactive AG to maintain and calculate the Index. Solactive AG uses its best efforts to ensure that the Index is calculated correctly. Irrespective of its obligations towards MarketVector Indexes GmbH (“MarketVector”), Solactive AG has no obligation to point out errors in the Index to third parties. VanEck’s ETF is not sponsored, endorsed, sold or promoted by MarketVector and MarketVector makes no representation regarding the advisability of investing in the ETF. Effective September 19, 2025 the NYSE Arca Gold Miners Index has been replaced with the MarketVector™ Global Gold Miners Index. It is not possible to invest directly in an index.
Investing is subject to risk, including the possible loss of principal. For any unfamiliar technical terms, please refer to ETF Glossary | VanEck.
No part of this material may be reproduced in any form, or referred to in any other publication, without express written permission of VanEck.
© VanEck (Europe) GmbH ©VanEck Switzerland AG © VanEck Securities UK Limited
This is a marketing communication for professional investors only. Please refer to the UCITS prospectus and to the Key Investor Information Document (KIID) before making any final investment decisions.
This is a marketing communication for professional investors only. Please refer to the UCITS prospectus and to the Key Investor Information Document (KIID) before making any final investment decisions. This information originates from VanEck Securities UK Limited (FRN: 1002854), an Appointed Representative of Strata Global Limited (FRN: 563834) which is authorised and regulated by the Financial Conduct Authority in the UK. The information is intended only to provide general and preliminary information to FCA regulated firms such as Independent Financial Advisors (IFAs) and Wealth Managers. Retail clients should not rely on any of the information provided and should seek assistance from an IFA for all investment guidance and advice. VanEck Securities UK Limited and its associated and affiliated companies (together “VanEck”) assume no liability with regards to any investment, divestment or retention decision taken by the investor on the basis of this information. The views and opinions expressed are those of the author(s) but not necessarily those of VanEck. Opinions are current as of the publication date and are subject to change with market conditions. Certain statements contained herein may constitute projections, forecasts and other forward-looking statements, which do not reflect actual results. Information provided by third party sources is believed to be reliable and have not been independently verified for accuracy or completeness and cannot be guaranteed. Brokerage or transaction fees may apply.
All performance information is based on historical data and does not predict future returns. Investing is subject to risk, including the possible loss of principal.
No part of this material may be reproduced in any form, or referred to in any other publication, without express written permission of VanEck.
© VanEck Securities UK Limited