EM High Yield Bonds Withstand Rising Rates
June 01, 2021
Read Time 2 MIN
Emerging markets high yield corporate bonds have been the brightest spot within emerging markets debt in the past year, despite the increase in U.S. interest rates that began last summer and accelerated at the beginning of 2021.1 This segment of the market may also be relatively more insulated from higher local interest rates and fluctuations in the U.S. dollar, while the global exposure of many of the issuers allows the category to benefit from the spike in expected global growth rates this year. At the same time, emerging markets high yield corporates are one of the few areas where investors can still find yields that are still well above 5%.
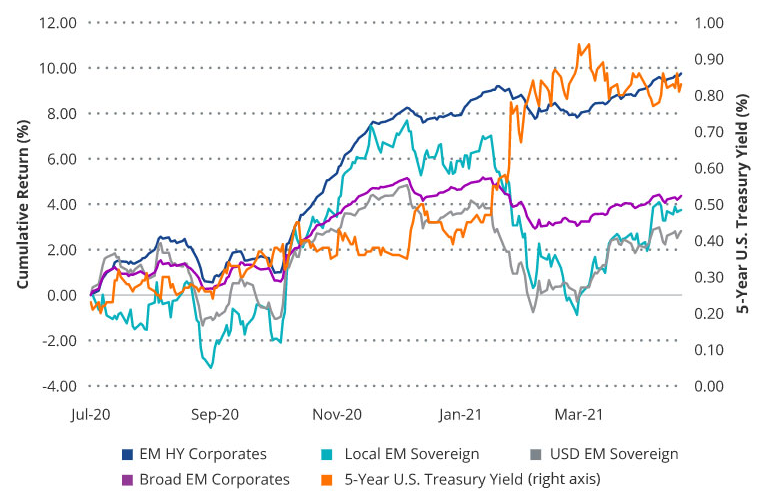
Emerging Markets High Yield Corporates Have Outperformed Amid Rising Rates
| Index | Wtd. Average Yield | Effective Duration | |
| EM HY Corporates | ICE BofA Diversified High Yield US Emerging Markets Corporate Plus Index | 5.41 | 3.6 |
| Local EM Sovereign | JPM GBI-EM Global Diversified Index | 4.81 | 5.2 |
| USD EM Sovereign | JPM EMBI Global Diversified Index | 4.44 | 7.9 |
| Broad EM Corporates | ICE BofA US Emerging Markets Liquid Corporate Plus Index | 3.46 | 5.3 |
Source: ICE Data Indices, J.P. Morgan and Morningstar, as of 5/21/2021. Timeframe for data reflects rise of interest rates.
The lower interest rate sensitivity of emerging markets high yield corporates, compared to other U.S. dollar denominated emerging markets debt sectors, has been a key driver of outperformance versus broad emerging markets corporate debt over the past year as interest rates rose (see index definitions in table above). Emerging markets high yield corporates have a duration of 3.6, compared to 5.3 of broad emerging markets corporates and nearly 8 of USD emerging markets sovereigns. Further, the segment’s duration has remained close to where it was five years ago. The duration of USD emerging markets sovereigns, on the other hand, has extended significantly from about 6.7 five years ago, while the duration of broad emerging markets corporates was about 4.6 five years ago.2
In addition to the shorter duration, emerging markets high yield corporates benefit from a high average spread, which provides a potential cushion against rising rates. Year-to-date through 5/21/21, the average spread has tightened by 41 basis points, nearly offsetting the 47 basis point increase in the 5-Year U.S. Treasury Yield. The upshot, of course, is that spreads are now at historically tight levels. However, emerging markets high yield corporates continue to provide a spread pickup of 135 basis points versus U.S. high yield corporate bonds3. Further, with what we view as expected strong global growth, continued accommodation by central banks and very benign credit conditions, it is difficult to identify a likely catalyst for widening out, particularly if the recent calmer tone in U.S. interest rates continues. In addition, we believe with the current high exposure to Energy (15%) and Basic Industry (16%), emerging markets yield corporates may continue to benefit from the upswing in global commodity prices.
DISCLOSURE
1 Emerging markets high yield corporate bonds represented by ICE BofA Diversified High Yield US Emerging Markets Corporate Plus Index.
2 Source: ICE Data Indices and J.P. Morgan as of 5/23/2016.
3 U.S. high yield is represented by the ICE BofA US High Yield Index.
Source for all data unless otherwise stated: ICE Data Indices. Data as of 5/21/2021.
Please note that VanEck may offer investments products that invest in the asset class(es) discussed herein.
ICE BofA Diversified High Yield US Emerging Markets Corporate Plus Index tracks the performance of US dollar denominated below investment grade emerging markets non-sovereign debt publicly issued in the major domestic and eurobond markets.
ICE BofA US Emerging Markets Liquid Corporate Plus Index tracks the performance of U.S. dollar denominated emerging markets non-sovereign debt publicly issued in the major domestic and eurobond markets.
ICE BofA US High Yield Index tracks the performance of US dollar denominated below investment grade corporate debt publicly issued in the US domestic market.
J.P. Morgan GBI-EM Global Diversified Index tracks emerging markets local government bonds that are accessible by most foreign investors. The weighting scheme provides additional diversification by more evenly distributing weights among the countries in the index. Countries are capped at 10%.
J.P. Morgan EMBI Global Diversified Index tracks USD-denominated emerging markets sovereign bonds. The weighting scheme provides additional diversification by more evenly distributing weights among the countries in the index.
This content is published in the United States for residents of specified countries. Investors are subject to securities and tax regulations within their applicable jurisdictions that are not addressed in this content. Nothing in this content should be considered a solicitation to buy or an offer to sell shares of any investment in any jurisdiction where the offer or solicitation would be unlawful under the securities laws of such jurisdiction, nor is it intended as investment, tax, financial, or legal advice. Investors should seek such professional advice for their particular situation and jurisdiction.
This is not an offer to buy or sell, or a recommendation to buy or sell any of the securities mentioned herein. The information presented does not involve the rendering of personalized investment, financial, legal, or tax advice. Certain statements contained herein may constitute projections, forecasts and other forward looking statements, which do not reflect actual results, are valid as of the date of this communication and subject to change without notice. Information provided by third party sources are believed to be reliable and have not been independently verified for accuracy or completeness and cannot be guaranteed. VanEck does not guarantee the accuracy of third party data. The information herein represents the opinion of the author(s), but not necessarily those of VanEck.
All investing is subject to risk, including the possible loss of the money you invest. Bonds and bond funds will decrease in value as interest rates rise. As with any investment strategy, there is no guarantee that investment objectives will be met and investors may lose money. Diversification does not ensure a profit or protect against a loss in a declining market. Past performance is no guarantee of future results.
Related Funds
DISCLOSURE
1 Emerging markets high yield corporate bonds represented by ICE BofA Diversified High Yield US Emerging Markets Corporate Plus Index.
2 Source: ICE Data Indices and J.P. Morgan as of 5/23/2016.
3 U.S. high yield is represented by the ICE BofA US High Yield Index.
Source for all data unless otherwise stated: ICE Data Indices. Data as of 5/21/2021.
Please note that VanEck may offer investments products that invest in the asset class(es) discussed herein.
ICE BofA Diversified High Yield US Emerging Markets Corporate Plus Index tracks the performance of US dollar denominated below investment grade emerging markets non-sovereign debt publicly issued in the major domestic and eurobond markets.
ICE BofA US Emerging Markets Liquid Corporate Plus Index tracks the performance of U.S. dollar denominated emerging markets non-sovereign debt publicly issued in the major domestic and eurobond markets.
ICE BofA US High Yield Index tracks the performance of US dollar denominated below investment grade corporate debt publicly issued in the US domestic market.
J.P. Morgan GBI-EM Global Diversified Index tracks emerging markets local government bonds that are accessible by most foreign investors. The weighting scheme provides additional diversification by more evenly distributing weights among the countries in the index. Countries are capped at 10%.
J.P. Morgan EMBI Global Diversified Index tracks USD-denominated emerging markets sovereign bonds. The weighting scheme provides additional diversification by more evenly distributing weights among the countries in the index.
This content is published in the United States for residents of specified countries. Investors are subject to securities and tax regulations within their applicable jurisdictions that are not addressed in this content. Nothing in this content should be considered a solicitation to buy or an offer to sell shares of any investment in any jurisdiction where the offer or solicitation would be unlawful under the securities laws of such jurisdiction, nor is it intended as investment, tax, financial, or legal advice. Investors should seek such professional advice for their particular situation and jurisdiction.
This is not an offer to buy or sell, or a recommendation to buy or sell any of the securities mentioned herein. The information presented does not involve the rendering of personalized investment, financial, legal, or tax advice. Certain statements contained herein may constitute projections, forecasts and other forward looking statements, which do not reflect actual results, are valid as of the date of this communication and subject to change without notice. Information provided by third party sources are believed to be reliable and have not been independently verified for accuracy or completeness and cannot be guaranteed. VanEck does not guarantee the accuracy of third party data. The information herein represents the opinion of the author(s), but not necessarily those of VanEck.
All investing is subject to risk, including the possible loss of the money you invest. Bonds and bond funds will decrease in value as interest rates rise. As with any investment strategy, there is no guarantee that investment objectives will be met and investors may lose money. Diversification does not ensure a profit or protect against a loss in a declining market. Past performance is no guarantee of future results.