EMBX: EM Bonds Persistently Resilient
July 16, 2026
Read Time 8 MIN
Key Takeaways:
- A calmer global risk environment is allowing country-specific fundamentals to drive returns. EM, with its mix of high real rates, exporters, and importers, stands to benefit.
- Most EM central banks are operating within their inflation target ranges, while key DM central banks have yet to reach their own targets.
- CGBs have outperformed U.S. Treasuries through geopolitical stress, as CNY appreciation continues to account for returns that carry alone does not explain.
EMBX: EM Bonds Persistently Resilient
The VanEck Emerging Markets Bond ETF (EMBX) was up 0.13% in June, compared to 0.46% for its benchmark, and -0.64% for the Global Agg and 0.33% for U.S. Treasuries. Year to date, EMBX is up 3.61%, compared to 2.43% for its benchmark, and -0.47% for the Global Agg and 0.02% for U.S. Treasuries. Peru local (overweight), Bolivia USD (overweight), and Poland local (underweight) contributed the most to outperformance. India local (not owning) was a loser in June, but a top year to date outperformer for EMBX. Local currency exposure continues to decline and is now at 41.5%, carry is 6.19%, yield to worst is 6.88%, and duration increased to 6.13.
Average Annual Total Returns* (%)
| Quarter End As of 06/30/2026 | 1 MO | 3 MO | YTD | 1 YR | 3 YR | 5 YR | 10 YR | LIFE 07/09/12 |
| EMBX (NAV) | 0.13 | 4.54 | 3.61 | 11.58 | 10.00 | 4.55 | 5.14 | 3.70 |
| EMBX (Market Price) | -0.03 | 3.82 | 3.61 | 11.46 | 9.96 | 4.53 | 5.13 | 3.69 |
| 50% GBI-EM/50% EMBI | 0.46 | 4.25 | 2.43 | 9.83 | 8.85 | 2.40 | 3.25 | 2.76 |
EMBX Gross Expense Ratio – 0.76%
*Returns less than one year are not annualized.
The performance data quoted represents past performance. Past performance is not a guarantee of future results. Investment return and principal value of an investment will fluctuate so that an investor's shares, when redeemed, may be worth more or less than their original cost. Performance may be lower or higher than performance data quoted. Please call 800.826.2333 or visit vaneck.com for performance current to the most recent month ended.
Prior to 10/06/2025, the Fund operated as the VanEck Emerging Markets Bond mutual fund; performance shown before that date is that fund’s NAV performance (Class I, unadjusted for today’s ETF expenses).
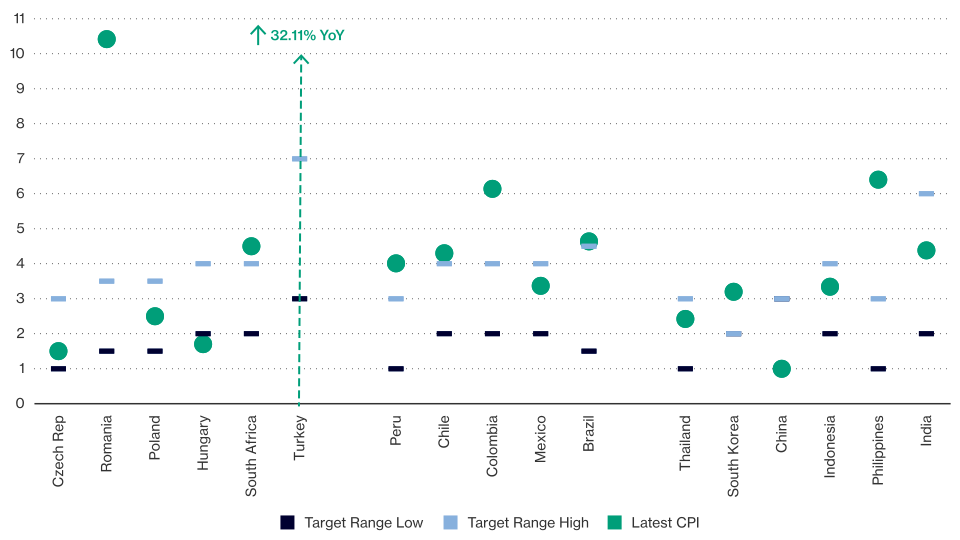
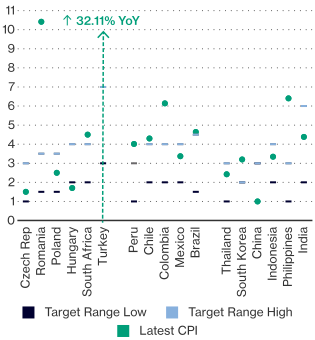
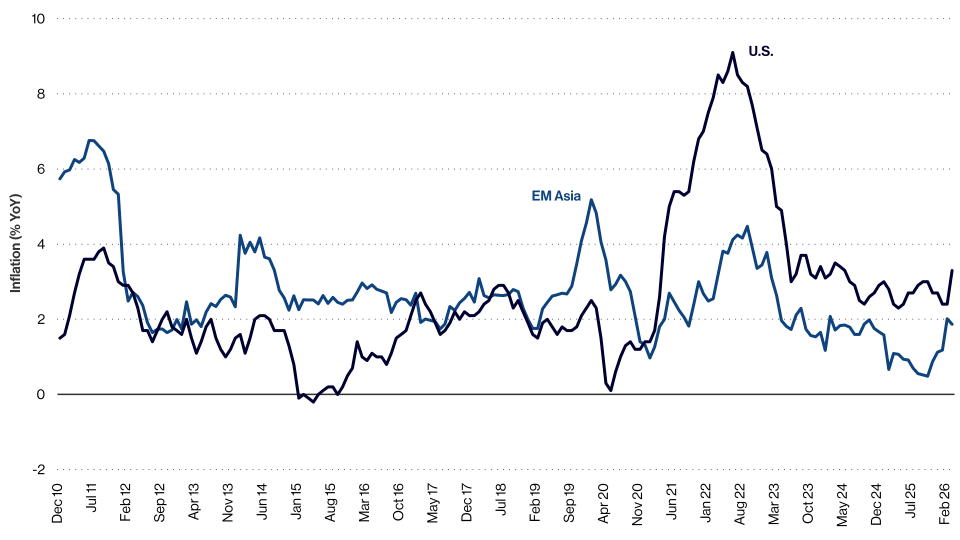
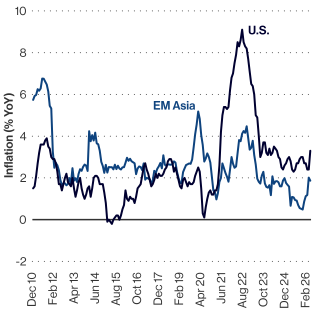
The reprieve in the global risk environment naturally allows country-specific drivers to shine through; which is good for emerging markets (EM) with plenty of high-real-rate environments and a mix of exporters and importers. Exhibit 1 shows key EMs’ latest CPI prints versus their inflation target ranges. There are a lot of outliers, but most EMs are within their target ranges. The first takeaway is that this continues to be a remarkable ongoing phenomenon in EM, given that the latest U.S. PCE print was 3.3% and the Fed’s target is 2%. Yet again EM looks pretty orthodox relative to a key developed markets (DM). The second takeaway is the idiosyncrasy. Hungary’s headline inflation has been below the target range for the second month in a row, and the market’s pricing of 71 basis points (bps) of rate cuts in 12 months does not look unreasonable. This is a key reason why Hungary’s 10-year local yield (5.03%) has remained comfortably below Poland’s since early May, cementing Hungary’s status as a top performer (U.S. Dollar unhedged) in the J.P. Morgan’s GBI-EM Index. (Hungary remains one of EMBX’s top YTD performers.) Exhibit 2 shows a longer-term history of U.S. and “Asia” (see footnotes) inflation, the key point being that the “leading” EM – Asia – has recently consistently outperformed DM on inflation. This is thanks to decades of economic policy orthodoxy (largely), and many other factors, which we’ve written about in various white papers. Other EMs can follow in this path, many are.
Exhibit 1 – Many EM Inflation Prints Within Target Ranges
EM Headline Inflation (% year-on-year) vs Inflation Target (%)
Source: VanEck Research; Bloomberg LP. Data as of June 2026.
Exhibit 2 – Asia Inflation Now Persistently Lower Than U.S.
Regional Inflation in EM vs. U.S., % year-on-year
Source: VanEck Research: Bloomberg LP. Data as of May 2026.
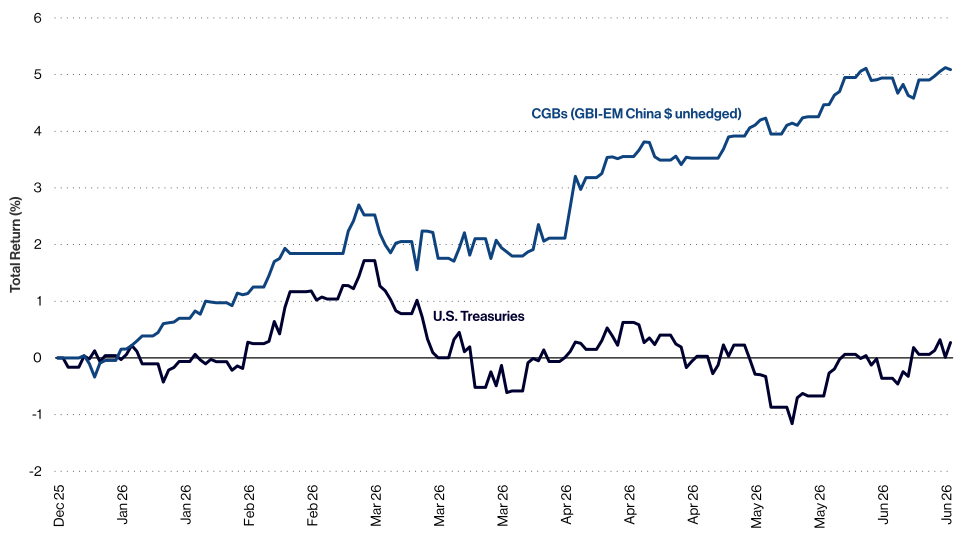
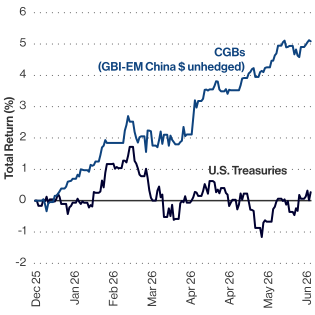
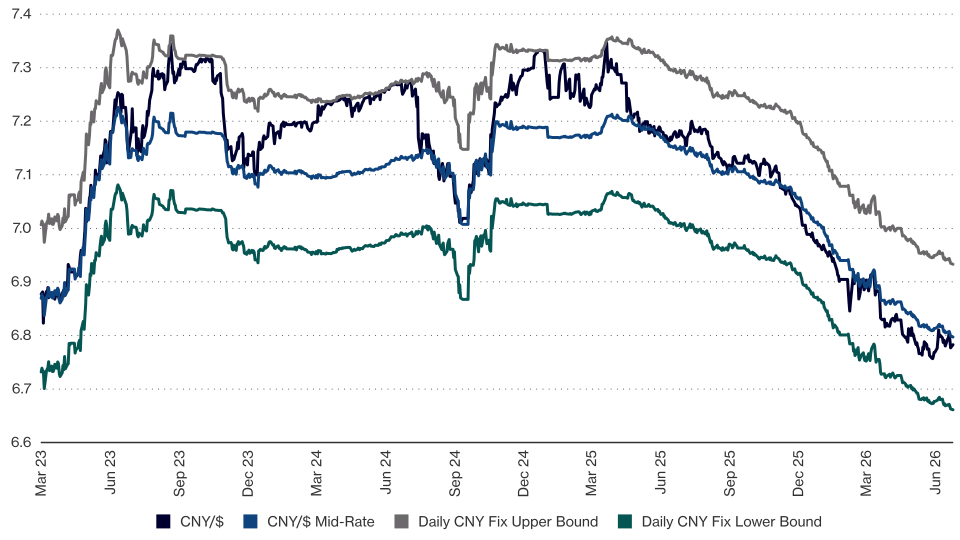
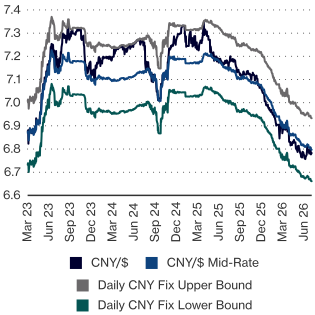
China has yet again emerged as a source of market stability if not more – China’s currency keeps strengthening and Chinese Government Bonds (CGBs) are up around 5% YTD, while U.S. Treasuries are down. Think about that. The Iran war is arguably one of the most consequential geopolitical and economic challenge markets have faced since the end of the second world war. And CGBs proved to be a safe asset, yet again. Recall that it was China that restarted the global economy after the global financial crisis with its fiscal stimulus. Note that this performance was generated with very low carry. Nominal interest rates are around 1.70% (10y). This is important to emphasize as it gets forgotten by even sophisticated investors. The FX and the interest rate are the same thing. Accumulated currency undervaluation (as measured by, for example, REER) is the same thing as a cheap interest rate, according to covered interest parity. For the past 6+ years, sell-side economists have lamented the low carry (but not real rate) in Asian local markets, and predicted low returns for Asian local-currency bonds. It didn’t happen. This is due to the still accumulating cheapness of the FX. The CNY appreciation in particular looks relentless – the daily fix has been moved to a stronger 6.7/U.S. dollar handle recently and the spot exchange rate spent most of the year on the stronger side of the fix (wars and other global noise notwithstanding – see Exhibit 3 below).
Exhibit 3 – CGBs Act Like Risk-Free Asset, Treasuries Not so Much
USTs vs CGBs during Iran War (total return, %)
Source: VanEck Research; Bloomberg LP. Data as of June 2026.
Recommended subscription
Exhibit 4 - Chinese Renminbi Keeps Strengthening
Source: VanEck Research; Bloomberg LP. Data as of July 2026.
Exposure Types and Significant Changes
The changes to our top positions are summarized below. Our largest positions in June were Mexico, Indonesia, Malaysia, China, and South Africa:
- We increased our local currency exposure in Mexico and Indonesia. Indonesia’s valuations improved after the sell off and the authorities are actively trying to change investors’ perception about the reform agenda – including pre-emptive rate hikes and measures to attract inflows, which strengthened the policy test score for the country. As a major oil importer, Indonesia is also a major beneficiary of the Middle East de-escalation and lower oil prices, which improved its technical test score against the backdrop of stretched short positioning. Mexico’s local duration was expected to benefit from the hawkish Fed’s impact on the U.S. duration, which boosted the technical test score for the country.
- We also increased our hard currency sovereign exposure in Saudi Arabia and Jordan, and hard currency corporate exposure in Singapore and Hong Kong. The Fed’s more hawkish stance improved the outlook for duration in Saudi Arabia and Jordan. In terms of our investment process, this improved the technical test scores for these countries. Our corporate additions reflected the property market recovery, which strengthened the economic test scores in both geographies.
- Finally on hard currency, we increased our hard currency sovereign exposure in Bolivia and Senegal. Bolivia’s decision to unify exchange rates and make the FX mechanism more flexible strengthened the policy test score for the country as this improves the country’s chances of getting an IMF deal. Senegal’s bonds cheapened a lot, but the IMF talks continue and the government said it was not seeking debt restructuring. This improved the policy test score for the country.
- We reduced our local currency exposure in Brazil and South Africa. The Brazilian central bank cut the policy rate in June, contradicting its own assessment of inflation risks in the economy, and might do it again in August. President Lula’s odds of getting re-elected are improving, and there are clear signs of more fiscal strain in the runup to the elections. All these factors worsened the policy test score for the country. South Africa’s central bank might be forced to tighten more in response to higher inflation pressures in the aftermath of the Iran war – against the backdrop of less attractive valuations. This also worsens the policy test score for the country.
- We also reduced our local currency exposure in Colombia and Peru. We took profits in Colombia following the presidential elections and the victory of the right-wing candidate Abelardo de la Espriella. The focus now shifts to a credible reform/fiscal adjustment program – until then the policy test score for the country will remain subdued. We were driven by the same set of reasons in Peru, where the market-friendly election outcome is now fully priced in.
- Finally, we reduced our hard currency sovereign exposure in Gabon, Angola, and Ecuador, and hard currency corporate exposure in Turkey. Gabon, Ecuador, and Angola are oil exporters, which will not benefit from the Middle East de-escalation – the latter worsened the technical test score for them. Gabon’s precarious fiscal position is an extra risk here, worsening the policy test score. The Turkish company would be affected by the weak pricing environment for electricity generation both in Q1 and Q2.
EMBX | VanEck Emerging Markets Bond ETF
To receive more Emerging Markets Bonds insights, sign up in our subscription center.

Important Disclosures
There is no guarantee that these conditions will persist or that the fund will achieve similar results in the future.
This is not an offer to buy or sell, or a recommendation to buy or sell any of the securities, financial instruments or digital assets mentioned herein. The information presented does not involve the rendering of personalized investment, financial, legal, tax advice, or any call to action. Certain statements contained herein may constitute projections, forecasts and other forward-looking statements, which do not reflect actual results, are for illustrative purposes only, are valid as of the date of this communication, and are subject to change without notice. Actual future performance of any assets or industries mentioned are unknown. Information provided by third party sources are believed to be reliable and have not been independently verified for accuracy or completeness and cannot be guaranteed. VanEck does not guarantee the accuracy of third party data. The information herein represents the opinion of the author(s), but not necessarily those of VanEck or its other employees.
Duration measures a bond’s sensitivity to interest rate changes that reflects the change in a bond’s price given a change in yield. This duration measure is appropriate for bonds with embedded options. Carry is the benefit or cost for owning an asset. Yield to worst is a measure of the lowest possible yield that can be received on a bond with an early retirement provision. Averages are market weighted. The yields presented do not represent the performance of the Fund. These statistics do not take into account fees and expenses associated with investments of the Fund.
30-Day SEC Yield is a standard yield calculation developed by the Securities and Exchange Commission that allows for fairer comparisons among funds. It is based on the most recent 30-day period. This yield figure reflects the interest earned during the period after deducting the Fund’s expenses for the period. It does not reflect the yield an investor would have received if they had held the Fund over the last twelve months assuming the most recent NAV.
All indices are unmanaged and include the reinvestment of all dividends, but do not reflect the payment of transaction costs, advisory fees or expenses that are associated with an investment in the Fund. Certain indices may take into account withholding taxes. An index’s performance is not illustrative of the Fund’s performance. Indices are not securities in which investments can be made.
The Fund’s benchmark index (50% GBI-EM/50% EMBI) is a blended index consisting of 50% J.P. Morgan Government Bond Index-Emerging Markets (GBI-EM) Global Diversified and 50% J.P. Morgan Emerging Markets Bond Index (EMBI). The J.P. Morgan GBI-EM Global Diversified tracks local currency bonds issued by Emerging Markets governments. The J.P. Morgan EMBI Global Diversified tracks returns for actively traded external debt instruments in emerging markets, and is also J.P. Morgan’s most liquid U.S. dollar emerging markets debt benchmark.
The Bloomberg Global Aggregate Index measures the performance of global investment grade fixed income securities.
The FTSE 10-Year US Treasuries Index measures the return of the 10-year U.S. Treasury.
An investment in the VanEck Emerging Markets Bond ETF may be subject to risks which include, among others, risks related to active management, credit, credit-linked notes, currency management strategies, derivatives, emerging market issuers, ESG investing, foreign currency, foreign securities, hedging, high portfolio turnover, high yield securities, interest rate, market, non-diversified, operational, restricted securities, investing in other funds, sovereign bond, special risk considerations of investing in African, Asian, and Latin American issuers, authorized participant concentration, no guarantee of active trading market, trading issues, fund shares trading, premium/discount and liquidity of fund shares, and cash transactions risks, all of which may adversely affect the Fund. Emerging market issuers and foreign securities may be subject to securities markets, political and economic, investment and repatriation restrictions, different rules and regulations, less publicly available financial information, foreign currency and exchange rates, operational and settlement, and corporate and securities laws risks.
Investing involves substantial risk and high volatility, including possible loss of principal. An investor should consider the investment objective, risks, charges and expenses of a Fund carefully before investing. To obtain a prospectus and summary prospectus, which contain this and other information, call 800.826.2333 or visit vaneck.com. Please read the prospectus and summary prospectus carefully before investing.
© Van Eck Securities Corporation, Distributor, a wholly-owned subsidiary of Van Eck Associates Corporation.
Related Funds
Important Disclosures
There is no guarantee that these conditions will persist or that the fund will achieve similar results in the future.
This is not an offer to buy or sell, or a recommendation to buy or sell any of the securities, financial instruments or digital assets mentioned herein. The information presented does not involve the rendering of personalized investment, financial, legal, tax advice, or any call to action. Certain statements contained herein may constitute projections, forecasts and other forward-looking statements, which do not reflect actual results, are for illustrative purposes only, are valid as of the date of this communication, and are subject to change without notice. Actual future performance of any assets or industries mentioned are unknown. Information provided by third party sources are believed to be reliable and have not been independently verified for accuracy or completeness and cannot be guaranteed. VanEck does not guarantee the accuracy of third party data. The information herein represents the opinion of the author(s), but not necessarily those of VanEck or its other employees.
Duration measures a bond’s sensitivity to interest rate changes that reflects the change in a bond’s price given a change in yield. This duration measure is appropriate for bonds with embedded options. Carry is the benefit or cost for owning an asset. Yield to worst is a measure of the lowest possible yield that can be received on a bond with an early retirement provision. Averages are market weighted. The yields presented do not represent the performance of the Fund. These statistics do not take into account fees and expenses associated with investments of the Fund.
30-Day SEC Yield is a standard yield calculation developed by the Securities and Exchange Commission that allows for fairer comparisons among funds. It is based on the most recent 30-day period. This yield figure reflects the interest earned during the period after deducting the Fund’s expenses for the period. It does not reflect the yield an investor would have received if they had held the Fund over the last twelve months assuming the most recent NAV.
All indices are unmanaged and include the reinvestment of all dividends, but do not reflect the payment of transaction costs, advisory fees or expenses that are associated with an investment in the Fund. Certain indices may take into account withholding taxes. An index’s performance is not illustrative of the Fund’s performance. Indices are not securities in which investments can be made.
The Fund’s benchmark index (50% GBI-EM/50% EMBI) is a blended index consisting of 50% J.P. Morgan Government Bond Index-Emerging Markets (GBI-EM) Global Diversified and 50% J.P. Morgan Emerging Markets Bond Index (EMBI). The J.P. Morgan GBI-EM Global Diversified tracks local currency bonds issued by Emerging Markets governments. The J.P. Morgan EMBI Global Diversified tracks returns for actively traded external debt instruments in emerging markets, and is also J.P. Morgan’s most liquid U.S. dollar emerging markets debt benchmark.
The Bloomberg Global Aggregate Index measures the performance of global investment grade fixed income securities.
The FTSE 10-Year US Treasuries Index measures the return of the 10-year U.S. Treasury.
An investment in the VanEck Emerging Markets Bond ETF may be subject to risks which include, among others, risks related to active management, credit, credit-linked notes, currency management strategies, derivatives, emerging market issuers, ESG investing, foreign currency, foreign securities, hedging, high portfolio turnover, high yield securities, interest rate, market, non-diversified, operational, restricted securities, investing in other funds, sovereign bond, special risk considerations of investing in African, Asian, and Latin American issuers, authorized participant concentration, no guarantee of active trading market, trading issues, fund shares trading, premium/discount and liquidity of fund shares, and cash transactions risks, all of which may adversely affect the Fund. Emerging market issuers and foreign securities may be subject to securities markets, political and economic, investment and repatriation restrictions, different rules and regulations, less publicly available financial information, foreign currency and exchange rates, operational and settlement, and corporate and securities laws risks.
Investing involves substantial risk and high volatility, including possible loss of principal. An investor should consider the investment objective, risks, charges and expenses of a Fund carefully before investing. To obtain a prospectus and summary prospectus, which contain this and other information, call 800.826.2333 or visit vaneck.com. Please read the prospectus and summary prospectus carefully before investing.
© Van Eck Securities Corporation, Distributor, a wholly-owned subsidiary of Van Eck Associates Corporation.