Rate Sell Off Reinforces the Case for EM Bonds
November 14, 2024
Read Time 10+ MIN
EMBX | VanEck Emerging Markets Bond ETF
The VanEck Emerging Markets Bond Fund was down 2.66% in October, compared to -3.17% for its benchmark. Year to date, the fund is up 5.55%, compared to up 3.41%, for its benchmark, the 50% J.P. Morgan Government Bond Index-Emerging Markets Global Diversified (GBI-EM) and 50% J.P. Morgan Emerging Markets Bond Index (EMBI), and compared to down -0.13%, -0.04% for the Global Agg and 10-year Treasuries, respectively. For the trailing 5-year period, the fund’s cumulative return is 21.0%, compared to -1.0% for its benchmark (and-9.9% and -9.8% for the Global Agg and 10-year Treasuries, respectively). The decades-old story of emerging market bonds (EM) outperforming developed markets (DM) continues. During October, the fund ended its brief flirtation with Mexican local-currency government bonds and Colombian local-currency bonds. We allocated risk to Brazil and Chile local currency bonds, among others. We continue to like curated local currency, especially higher-beta, and have maintained our low duration into the September-October rates selloff. In USD, IG seems a pure US-rates trade (so we are averse), while HY sovereigns remain our hunting ground. Carry is 8.3%, YTW is 9.6%, duration is 5.5 and local makes up around 60% of exposure.
Average Annual Total Returns* (%) (In USD)
| As of October 31, 2024 | |||||||||
| 1 Mth | 3 Mth | YTD | 1 Yr | 3 Yrs | 5 Yrs | 10 Yrs | |||
| Class A: NAV (Inception 07/09/12) | -2.60 | 3.02 | 5.17 | 15.62 | 1.83 | 3.56 | 1.66 | ||
| Class A: Maximum 5.75% load | -8.20 | -2.90 | -0.88 | 8.97 | -0.16 | 2.34 | 1.06 | ||
| Class I: NAV (Inception 07/09/12) | -2.66 | 3.06 | 5.55 | 15.90 | 2.16 | 3.89 | 1.97 | ||
| Class Y: NAV (Inception 07/09/12) | -2.75 | 2.97 | 5.43 | 15.73 | 2.07 | 3.82 | 1.89 | ||
| 50% GBI-EM/50% EMBI | -3.17 | 2.04 | 3.41 | 13.40 | -0.71 | -0.18 | 1.49 | ||
| As of September 30, 2024 | |||||||||
| 1 Mth | 3 Mth | YTD | 1 Yr | 3 Yrs | 5 Yrs | 10 Yrs | |||
| Class A: NAV (Inception 07/09/12) | 3.19 | 7.73 | 7.97 | 17.00 | 2.71 | 4.17 | 1.88 | ||
| Class A: Maximum 5.75% load | -2.74 | 1.54 | 1.77 | 10.27 | 0.70 | 2.94 | 1.28 | ||
| Class I: NAV (Inception 07/09/12) | 3.26 | 7.84 | 8.44 | 17.58 | 3.07 | 4.52 | 2.20 | ||
| Class Y: NAV (Inception 07/09/12) | 3.35 | 7.98 | 8.41 | 17.52 | 2.96 | 4.46 | 2.14 | ||
| 50% GBI-EM/50% EMBI | 2.62 | 7.57 | 6.80 | 16.02 | 0.15 | 0.78 | 1.98 | ||
* Returns less than one year are not annualized.
Expenses: Class A: Gross 2.08%, Net 1.21%; Class I: Gross 1.34%, Net 0.86%; Class Y: Gross 1.35%, Net 0.96%. Expenses are capped contractually until 05/01/25 at 1.20% for Class A, 0.85% for Class I, 0.95% for Class Y. Caps excluding acquired fund fees and expenses, interest, trading, dividends, and interest payments of securities sold short, taxes, and extraordinary expenses.
The performance data quoted represents past performance. Past performance is not a guarantee of future results. Investment return and principal value of an investment will fluctuate so that an investor’s shares, when redeemed, may be worth more or less than their original cost. Performance may be lower or higher than performance data quoted. Please call 800.826.2333 or visit vaneck.com for performance current to the most recent month ended.
The “Net Asset Value” (NAV) of a Fund is determined at the close of each business day, and represents the dollar value of one share of the fund; it is calculated by taking the total assets of the fund, subtracting total liabilities, and dividing by the total number of shares outstanding. The NAV is not necessarily the same as the ETF’s intraday trading value. Investors should not expect to buy or sell shares at NAV.
Rate Rally Reinforces the Case for EM Bonds
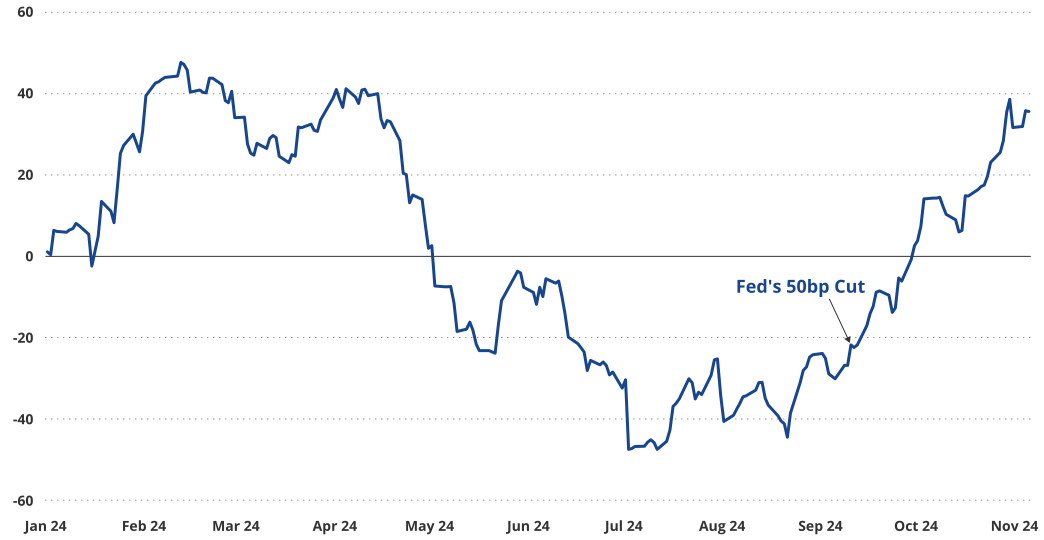
Data > US politics, for rates. Every economic data point released since the Fed’s 50 basis points (bps) policy rate cut on September 18 has been stronger than expected, so bearish for rates. Perhaps the only “bullish” development for rates was a mini-“peace dividend” in the form of supposedly contained/managed conflict between Israel and Iran, that saw a big drop in oil prices in October. And that seems priced and possibly premature, as such a “pause” seems dictated by the US election, which once over is no longer a constraint, logically. Keep in mind other actors such as Yemen’s Houthis, which survived Operation Prosperity Garden (as the Eisenhower carrier group had to exit the theater), none of which is affected by the “ceasefire” story. Also, Russia increasingly has “maximalist” objectives given its strong on-the-ground position and its sense that negotiation is pointless, so expecting peace simply due to a new US Executive seems overly hopeful. The world’s wars are all expanding and appear built-in to the next few years’ (not months’) future, while headlines of imminent ceasefires continue to get taken seriously. War is inflationary. And war busts through fiscal restraints, too (for those expecting a fiscal re-do under a Republican sweep scenario). That’s all old news. But as we’ve also learned, war (in its broader definition to include economic warfare) can undermine demand for some assets (US Treasuries) and boost demand for their opposites like bonds issued by EM governments with sustainable fiscal policy, independent central banks and no sanctions risk (and of course, gold).
Exhibit 1 – US Economy Surprises To Upside After Fed 50 bp Cut
Source: Bloomberg, LP. Data as of November 2024.
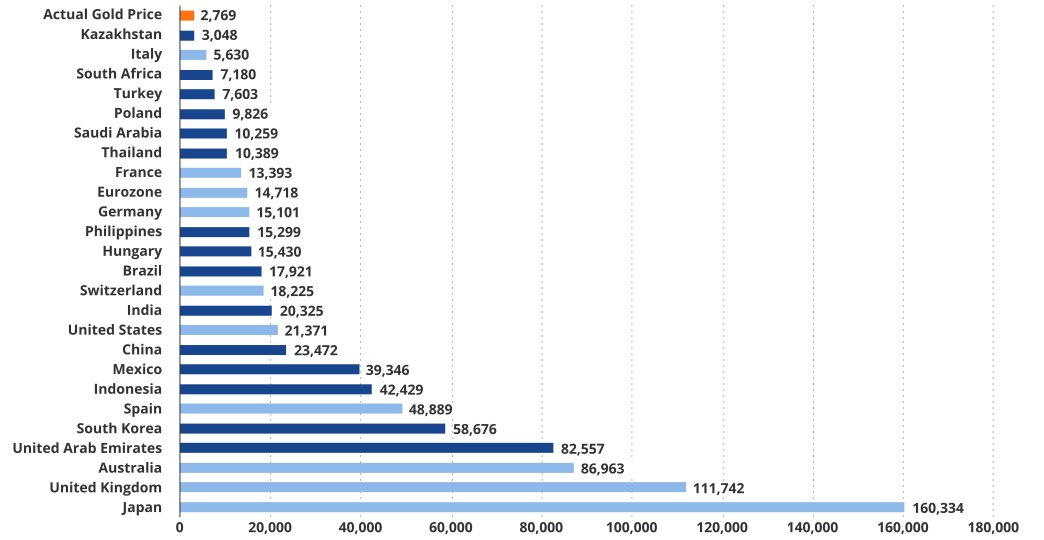
The rally in gold as rates began their October selloff is arguably the most important message of the last few months, auguring poorly for DM and the US dollar, but the market doesn’t yet look at it that way. Gold is seen as unusual and isn’t yet linked to central banks’ search for a wider range of safe assets including EM bonds; if anything, gold is connected to fiscal concerns (our “fiscal dominance” thesis). The IMF is somewhat alone (along with us) in thinking that this – central bank purchases of EM bonds – is important and has cited Singapore and Korea as early examples of EM bonds gaining reserve-status. But, to too many market professionals, this idea is either too complicated, too far off, or too uncertain. And it’s all packaged as if we’re supposed to expect a “headline” on “BRICS” and a perfect new currency. As we’ve been arguing, there will be no headlines on EM bonds’ slow graduation to reserve status, it will be a long-term process. Fair enough so far, especially given all the attention on BRICs in the west lately. But our point is that these are upside risks to EM bonds with already-high real and/or nominal carry, so what’s the issue? Seems to us the issue is one of courage and knowledge, as usual. We experience this in meetings. Which is fine, because markets have a solution for that, often involving chasing something at the wrong near-term moment. Sigh. For the past 5 years, the fund’s cumulative return is +21.0%, compared to -1.0% for its EM benchmark (and down -9.9% and down -9.8% for the Agg and Treasuries, respectively). Steady headlines like those are more likely than headlines of “EM local currency bonds dominate all DM bonds today”. We updated the exhibit below – gold reserves/M0 for some big central banks, and the message is clear – EMs have a lot of gold relative to M0, DMs have very little gold relative to M0. Look at Japan and the UK on this chart if you think this doesn’t matter. If you’d like the chart explained in more detail (we think it is so profoundly simple it might be hard to understand), give us a call!
Exhibit 2 – EMs (dark blue) Have High Gold Relative to M0, DMs (light blue) Have Low Gold Relative to M0
Source: VanEck Research; Bloomberg, LP. Data as of October 2024.
Recommended subscription
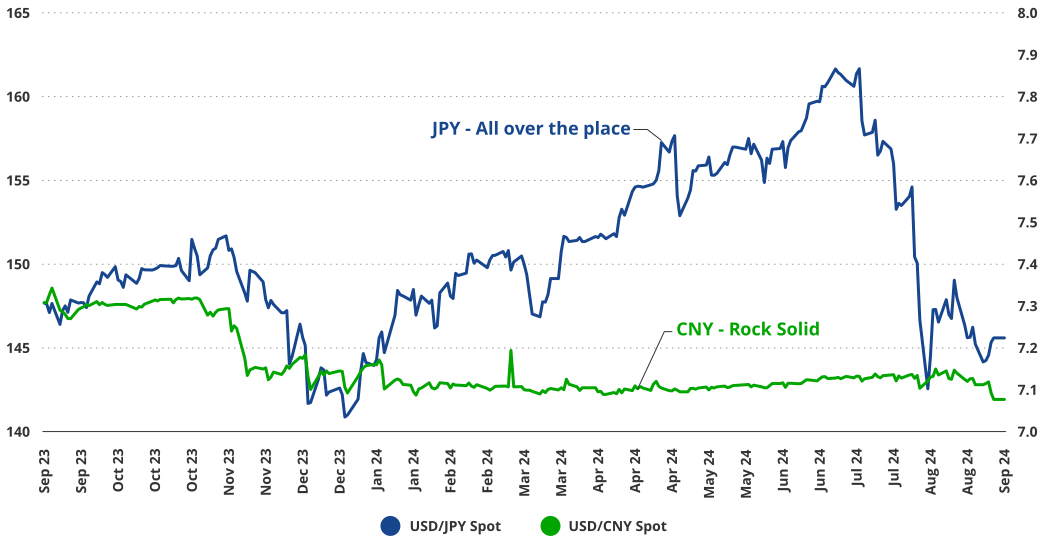
China > US politics, for EM local currency. We haven’t written much on US politics in this monthly and we aren’t going to. First, we had an election game plan, which were our rate (and Mexico) views expressed in the fund (and in writing) this year; those were largely (though unintentionally) contrarian, perhaps interestingly, perhaps not. The most useless thing in the world at this late stage could be an election investing plan, in our view…way too over-determined, but we’re just editorializing. Second, our election game plan was 90% a studious avoidance of drawing confident lines from politics to EM asset prices. Our primary framework was a) follow the data (as we do again, above) and b) downplay the table-pounding confidence that “candidate X means ‘this’ for global asset prices”. (Mexico is an exception, more on that below.) China is a positive example for EM resilience, though, and a meaningful one. We wrote in previous pieces about the incredible stability of CNY, especially in the face of financial ripples from Japan’s (to remind, a highly indebted DM which experimented with money policy) currency wobbles. Currencies are the primary transmission mechanism for economies, and the one from China was stable. So monetary policy is stabilizing, and such despite the extremely low interest-rate differential with the US (which worried us enough to graph it as a risk to our views in previous quarterlies).
Exhibit 3 – CNY Insulated EM From DM Japan’s Volatility
Source: VanEck Research; Bloomberg, LP. Data as of September 2024.
What about Chinese fiscal policy? The key event for China, in our opinion, is that we are now in the fiscal realm! We think the story of the fiscal realm will follow the story of the two prior realms we’ve already been through – the structural and the monetary realms. In both cases, there was never a “bazooka” moment. There was “reflexivity” in the form of greater policy support as market reactions and economic outcomes warranted – policies kept getting activated until they pointed to a need for policy support in the final realm, the fiscal. Anyway, our point is that if the structural and monetary realms are activated, entering the realm of fiscal policy means real final demand injected into an economy that has already prepared the ground. Just don’t wait for a “headline” telling you so (or sell when you see it). One important basic note. The reason we are excited about Chinese bonds in the portfolio is precisely because China did not guarantee its property sector (and thus prevent the bonds from collapsing), and did not transfer risk to the government and ultimately undermine China. China allowed their bonds to collapse, making credit quality post-restructuring a completely different game, as well. This is good policy. During the global financial crisis and Eurozone crisis, DMs used policy to support asset prices and therefore injected greater moral hazard into policy.
By the way, there’s a bit of a debate on China’s debt levels, with the IMF including some debt as “central government”, but with prominent folks such as Michael Pettis and Brad Stetser arguing that much of it is mis-classified and is therefore much lower. The latter viewpoint is closer to our own. We only note this for your navigation purposes, we won’t dissect that issue now. Anyway, China’s new borrowing/spending plans are gel-ing and the currency and rates are stable, which is powerful evidence. In fact, now might be a good moment to mention that our base-case expectation is that China slowly becomes the center of international finance over the next decade. Just some context, as “money demand” is one of the least-understood economic phenomena of its importance. (Note: “China” itself was the fund’s 2nd-best outperformer YTD, despite an underweight allocation, but that is direct Chinese exposure to a small selection of curated distressed property and other bonds, which is great but not the more general “China” we mean in this overall discussion.)
US politics > Mexico; Brazil > US politics. Mexico is one of the fund’s top performers versus its benchmark this month and year, as the fund had no or low exposure to its local-currency bonds (Mbonos), which are this year’s market dog. After the country’s presidential elections, a very long market puked, centering concerns on direct election of judges. Our process shows Mexico to be cheap on Step 1 (real rates versus fundamentals), but was rejected in Step 2 of the process (where we test bonds for non-systematic risks). In fact, we briefly changed our judgement on Step 2, thinking the market was oversold, but alas we stopped ourselves out, quickly and thankfully. We are still avoiding Mexico’s local market. Migration battles with the US could dominate headlines. Limits on immigration are a bigger threat to inflation in the US than are tariffs, to our eye. And, Mexico’s status as a “near-shoring” candidate is challenged by changes to its judiciary. This will take time, in our view. Finally, Mbono rates are highly correlated with US rates, and you know our views there. This is much less so for other EMs. Brazil is, like Mexico, very cheap on Step 1 of our investment process, with market rates around 13%, a policy rate of 10.75%, and inflation around 4.5%. But Brazil is more China-facing and swings to its own tune. That tune is of an economy that is basically strong on every front (especially external accounts), but has high debt that is always just on the verge of either being addressed or of blowing up. Our jaundiced eyes (30 years of covering Brazil) have even given us a simple rule of buying when fiscal concerns are peaking. Simple, but it often works. This rule gets reinforced by a strong independent monetary authority that just reversed course and hiked interest rates! You don’t get a stronger messenger or friend than a country’s own central bank. If it wasn’t obvious, this juxtaposition of US-linked Mexico and EM-linked Brazil is another example of a globe characterized by an unstable DM combined with a strong China and EM, and we want exposure to the good story.
Exposure Types and Significant Changes
The changes to our top positions are summarized below. Our largest positions in October were Brazil, China, South Africa, Indonesia, and Poland:
- We increased our local currency exposure in Poland, Turkey, Hungary, and Indonesia, and our hard currency corporate exposure in Turkey. The Polish central bank remains hawkish and investor positioning relatively light. The country should also be expected to benefit from a potential post-election ceasefire in Ukraine. Turkey’s policy U-turn is progressing well, earning it another sovereign rating upgrade (from S&P). Hungary shows signs of fiscal stabilization, while the central bank had paused its easing cycle. Indonesia’s new cabinet lineup sent an orthodox policy signal to the market and the central bank prudently left the policy rate on hold before the U.S. presidential elections. In terms of our investment process, this improved the policy test score for these countries.
- We also increased our local currency exposure in Brazil, Chile, and Uruguay. Brazil’s central bank is tightening its policy stance to address sticky inflation expectations and uncertainty about spending cuts in 2025 and beyond. The failure of the social security referendum in Uruguay removed significant fiscal risks. These developments improved the policy test score in both countries. Chile is expected to benefit from China’s policy stimulus and growth rebound, which should be copper-positive. In terms of our investment process, this improves the technical test score for the country.
- Finally, we increased our hard currency sovereign exposure in Sri Lanka and Kazakhstan, and hard currency corporate exposure in China and Hong Kong. China stepped up comprehensive policy efforts to prop up the economy, and especially consumption and real estate, improving the policy test score for the country. Kazakhstan’s assets should benefit from the nuclear revival, which strengthen the economic and technical test scores for the country. Sri Lanka’s new president sent better policy signals after his election, defying gloomy expectations, and the new government had endorsed the debt restructuring deal, complying with the IMF targets.
- We reduced our local currency exposure in Mexico, and Colombia. Mexico’s domestic developments and policy signals are completely overshadowed by the U.S. presidential elections, worsening the technical test score for the country. Colombia was hit by another wave of negative fiscal headlines associated with the constitutional reform bill to increase regional budget transfers. This weakened the policy test score for the country.
- We also reduced our hard currency sovereign exposure in Qatar and Bolivia, and local currency exposure in Malaysia and Thailand. We took profits in Malaysia and Thailand after the respective currencies’ mega-rally and with rising concerns that stronger growth in the U.S. can boost the U.S. Dollar, while local rates can get hit by duration concerns, which worsened the technical test score for both countries. Duration risks were behind our decision to reduce exposure in Qatar, whereas Bolivia might suffer from a lack of strong positive catalysts after the recent rally.
- Finally, we reduced our hard currency corporate exposure in Israel and hard currency sovereign exposure in Suriname. Israel is uniquely exposed to geopolitical risks, which are expected to stay elevated in the run up to the U.S. presidential elections, worsening the policy test score for the country. Surinam’s political noise will get louder and fiscal risks higher as the country gets closer to the elections. And it remains to be seen whether fiscal discipline can be maintained after the elections. These developments worsened the policy test score for the country.
To receive more Emerging Markets Bonds insights, sign up in our subscription center.

DISCLOSURES
This is not an offer to buy or sell, or a recommendation to buy or sell any of the securities, financial instruments or digital assets mentioned herein. The information presented does not involve the rendering of personalized investment, financial, legal, tax advice, or any call to action. Certain statements contained herein may constitute projections, forecasts and other forward-looking statements, which do not reflect actual results, are for illustrative purposes only, are valid as of the date of this communication, and are subject to change without notice. Actual future performance of any assets or industries mentioned are unknown. Information provided by third party sources are believed to be reliable and have not been independently verified for accuracy or completeness and cannot be guaranteed. VanEck does not guarantee the accuracy of third party data. The information herein represents the opinion of the author(s), but not necessarily those of VanEck or its other employees.
Duration measures a bond's sensitivity to interest rate changes that reflects the change in a bond's price given a change in yield. This duration measure is appropriate for bonds with embedded options. Carry is the benefit or cost for owning an asset. Yield to worst is a measure of the lowest possible yield that can be received on a bond with an early retirement provision. Averages are market weighted. The yields presented do not represent the performance of the Fund. These statistics do not take into account fees and expenses associated with investments of the Fund.
All indices are unmanaged and include the reinvestment of all dividends, but do not reflect the payment of transaction costs, advisory fees or expenses that are associated with an investment in the Fund. Certain indices may take into account withholding taxes. An index's performance is not illustrative of the Fund's performance. Indices are not securities in which investments can be made.
The Fund's benchmark index (50% GBI-EM/50% EMBI) is a blended index consisting of 50% J.P. Morgan Government Bond Index-Emerging Markets (GBI-EM) Global Diversified and 50% J.P. Morgan Emerging Markets Bond Index (EMBI). The J.P. Morgan GBI-EM Global Diversified tracks local currency bonds issued by Emerging Markets governments. The J.P. Morgan EMBI Global Diversified tracks returns for actively traded external debt instruments in emerging markets, and is also J.P. Morgan's most liquid U.S. dollar emerging markets debt benchmark.
The Bloomberg Global Aggregate Index measures the performance of global investment grade fixed income securities.
The FTSE Treasury Benchmark 10 year measures the return of the 10 year U.S. Treasury.
ICE BofA Global Broad Market Index tracks the performance of investment grade debt publicly issued in the major domestic and eurobond markets, including sovereign, quasi-government, corporate, securitized and collateralized securities.
Information has been obtained from sources believed to be reliable but J.P. Morgan does not warrant its completeness or accuracy. The Index is used with permission. The index may not be copied, used or distributed without J.P. Morgan's written approval. Copyright 2024, J.P. Morgan Chase & Co. All rights reserved.
You can lose money by investing in the Fund. Any investment in the Fund should be part of an overall investment program, not a complete program. The Fund is subject to risks which may include, but are not limited to, risks associated with active management, credit, credit-linked notes, currency management strategies, derivatives, emerging market issuers, energy sector, ESG investing strategy, foreign currency, foreign securities, hedging, high portfolio turnover, high yield securities, interest rate, market, non-diversified, operational, restricted securities, investing in other funds, sovereign bond, and special risks considerations of investing in African, Asian and Latin American issuers, all of which may adversely affect the Fund. Emerging market issuers and foreign securities may be subject to securities markets, political and economic, investment and repatriation restrictions, different rules and regulations, less publicly available financial information, foreign currency and exchange rates, operational and settlement, and corporate and securities laws risks. Derivatives may involve certain costs and risks such as liquidity, interest rate, and the risk that a position could not be closed when most advantageous.
ESG integration is the practice of incorporating material environmental, social and governance (ESG) information or insights alongside traditional measures into the investment decision process to improve long term financial outcomes of portfolios. Unless otherwise stated within an active investment strategy's investment objective, inclusion of this statement does not imply that an active investment strategy has an ESG-aligned investment objective, but rather describes how ESG information may be integrated into the overall investment process.
Investing involves substantial risk and high volatility, including possible loss of principal. An investor should consider the investment objective, risks, charges and expenses of a Fund carefully before investing. To obtain a prospectus and summary prospectus, which contain this and other information, call 800.826.2333 or visit vaneck.com. Please read the prospectus and summary prospectus carefully before investing.
No part of this material may be reproduced in any form, or referred to in any other publication, without express written permission of Van Eck Securities Corporation.
© 2026 Van Eck Securities Corporation, Distributor, a wholly-owned subsidiary of Van Eck Associates Corporation.
Related Funds
DISCLOSURES
This is not an offer to buy or sell, or a recommendation to buy or sell any of the securities, financial instruments or digital assets mentioned herein. The information presented does not involve the rendering of personalized investment, financial, legal, tax advice, or any call to action. Certain statements contained herein may constitute projections, forecasts and other forward-looking statements, which do not reflect actual results, are for illustrative purposes only, are valid as of the date of this communication, and are subject to change without notice. Actual future performance of any assets or industries mentioned are unknown. Information provided by third party sources are believed to be reliable and have not been independently verified for accuracy or completeness and cannot be guaranteed. VanEck does not guarantee the accuracy of third party data. The information herein represents the opinion of the author(s), but not necessarily those of VanEck or its other employees.
Duration measures a bond's sensitivity to interest rate changes that reflects the change in a bond's price given a change in yield. This duration measure is appropriate for bonds with embedded options. Carry is the benefit or cost for owning an asset. Yield to worst is a measure of the lowest possible yield that can be received on a bond with an early retirement provision. Averages are market weighted. The yields presented do not represent the performance of the Fund. These statistics do not take into account fees and expenses associated with investments of the Fund.
All indices are unmanaged and include the reinvestment of all dividends, but do not reflect the payment of transaction costs, advisory fees or expenses that are associated with an investment in the Fund. Certain indices may take into account withholding taxes. An index's performance is not illustrative of the Fund's performance. Indices are not securities in which investments can be made.
The Fund's benchmark index (50% GBI-EM/50% EMBI) is a blended index consisting of 50% J.P. Morgan Government Bond Index-Emerging Markets (GBI-EM) Global Diversified and 50% J.P. Morgan Emerging Markets Bond Index (EMBI). The J.P. Morgan GBI-EM Global Diversified tracks local currency bonds issued by Emerging Markets governments. The J.P. Morgan EMBI Global Diversified tracks returns for actively traded external debt instruments in emerging markets, and is also J.P. Morgan's most liquid U.S. dollar emerging markets debt benchmark.
The Bloomberg Global Aggregate Index measures the performance of global investment grade fixed income securities.
The FTSE Treasury Benchmark 10 year measures the return of the 10 year U.S. Treasury.
ICE BofA Global Broad Market Index tracks the performance of investment grade debt publicly issued in the major domestic and eurobond markets, including sovereign, quasi-government, corporate, securitized and collateralized securities.
Information has been obtained from sources believed to be reliable but J.P. Morgan does not warrant its completeness or accuracy. The Index is used with permission. The index may not be copied, used or distributed without J.P. Morgan's written approval. Copyright 2024, J.P. Morgan Chase & Co. All rights reserved.
You can lose money by investing in the Fund. Any investment in the Fund should be part of an overall investment program, not a complete program. The Fund is subject to risks which may include, but are not limited to, risks associated with active management, credit, credit-linked notes, currency management strategies, derivatives, emerging market issuers, energy sector, ESG investing strategy, foreign currency, foreign securities, hedging, high portfolio turnover, high yield securities, interest rate, market, non-diversified, operational, restricted securities, investing in other funds, sovereign bond, and special risks considerations of investing in African, Asian and Latin American issuers, all of which may adversely affect the Fund. Emerging market issuers and foreign securities may be subject to securities markets, political and economic, investment and repatriation restrictions, different rules and regulations, less publicly available financial information, foreign currency and exchange rates, operational and settlement, and corporate and securities laws risks. Derivatives may involve certain costs and risks such as liquidity, interest rate, and the risk that a position could not be closed when most advantageous.
ESG integration is the practice of incorporating material environmental, social and governance (ESG) information or insights alongside traditional measures into the investment decision process to improve long term financial outcomes of portfolios. Unless otherwise stated within an active investment strategy's investment objective, inclusion of this statement does not imply that an active investment strategy has an ESG-aligned investment objective, but rather describes how ESG information may be integrated into the overall investment process.
Investing involves substantial risk and high volatility, including possible loss of principal. An investor should consider the investment objective, risks, charges and expenses of a Fund carefully before investing. To obtain a prospectus and summary prospectus, which contain this and other information, call 800.826.2333 or visit vaneck.com. Please read the prospectus and summary prospectus carefully before investing.
No part of this material may be reproduced in any form, or referred to in any other publication, without express written permission of Van Eck Securities Corporation.
© 2026 Van Eck Securities Corporation, Distributor, a wholly-owned subsidiary of Van Eck Associates Corporation.