Why EM Bonds Have Outperformed Treasuries — and the Structural Case Behind It
September 11, 2026
Read Time 10 MIN
Key Takeaways:
- EM bonds, gold, and Chinese government bonds outperformed US Treasuries, raising real questions about what "safe" means in today's market.
- EM bonds have lower debt levels and independent central banks working in their favor. We believe this structural advantage has supported EM bond performance over the past decade..
- EMBX increased its local currency exposure across South Africa, Thailand, Hungary, Poland, Brazil, and Mexico, supported by a combination of easing inflation, attractive valuations and credible central bank policy
- EMBX offers an attractive yield-to-worst of 7.99%
Emerging markets bonds and US Treasuries are not comparable in risk: unlike Treasuries, EM debt carries credit, sovereign, currency, and emerging-market risk, and past outperformance does not indicate future results.
Why EM Bonds Have Outperformed Treasuries — and the Structural Case Behind It
The VanEck Emerging Markets Bond ETF (EMBX) returned 0.76% in August, compared to 0.89% for its benchmark, the 50% J.P. Morgan Government Bond Index - Emerging Markets Global Diversified (GBI-EM) and 50% J.P. Morgan Emerging Markets Bond Index (EMBI), and +0.34% for the Global Agg and +0.15% for US Treasuries. Year to date, EMBX is up 4.17%, compared to up 2.76% for its benchmark, and down -0.96% for the Global Agg and –1.55% for US Treasuries. South Korea local (overweight), Colombia local (overweight), and USD Congo (overweight) were the largest positive contributors. Indonesia local (no exposure) detracted the most in August, though this has been YTD positive. Local currency exposure is currently at 42.06%, carry is 6.43%, yield to worst (YTW) is 7.99% and duration decreased to 5.4. Our headline local exposure is significantly the result of avoiding large benchmark weights and importers, India and Indonesia, not an opinion on "local", as usual.
VanEck Emerging Markets Bond ETF (EMBX) Performance
Average Annual Total Returns* (%)
| Month End As of 08/31/2026 | 1 MO | 3 MO | YTD | 1 YR | 3 YR | 5 YR | 10 YR | LIFE 07/09/12 |
| EMBX (NAV) | 0.76 | 0.67 | 4.17 | 9.28 | 10.59 | 4.67 | 5.16 | 3.70 |
| EMBX (Market Price) | 0.40 | 0.55 | 4.22 | 9.21 | 10.56 | 4.66 | 5.15 | 3.69 |
| 50% GBI-EM/50% EMBI | 0.90 | 0.79 | 2.77 | 7.86 | 8.87 | 2.29 | 3.07 | 2.75 |
Average Annual Total Returns* (%)
| Quarter End As of 06/30/2026 | 1 MO | 3 MO | YTD | 1 YR | 3 YR | 5 YR | 10 YR | LIFE 07/09/12 |
| EMBX (NAV) | 0.13 | 4.54 | 3.61 | 11.58 | 10.00 | 4.55 | 5.14 | 3.70 |
| EMBX (Market Price) | -0.03 | 3.82 | 3.61 | 11.46 | 9.96 | 4.53 | 5.13 | 3.69 |
| 50% GBI-EM/50% EMBI | 0.46 | 4.25 | 2.43 | 9.83 | 8.85 | 2.40 | 3.25 | 2.76 |
* Returns less than one year are not annualized.
EMBX Gross Expense Ratio - 0.76%
The performance data quoted represents past performance. Past performance is not a guarantee of future results. Investment return and principal value of an investment will fluctuate so that an investor's shares, when redeemed, may be worth more or less than their original cost. Performance may be lower or higher than performance data quoted. Please call 800.826.2333 or visit vaneck.com for performance current to the most recent month ended.
Prior to 10/06/2025, the Fund operated as the VanEck Emerging Markets Bond mutual fund; performance shown before that date is that fund's NAV performance (Class I, unadjusted for today's ETF expenses).
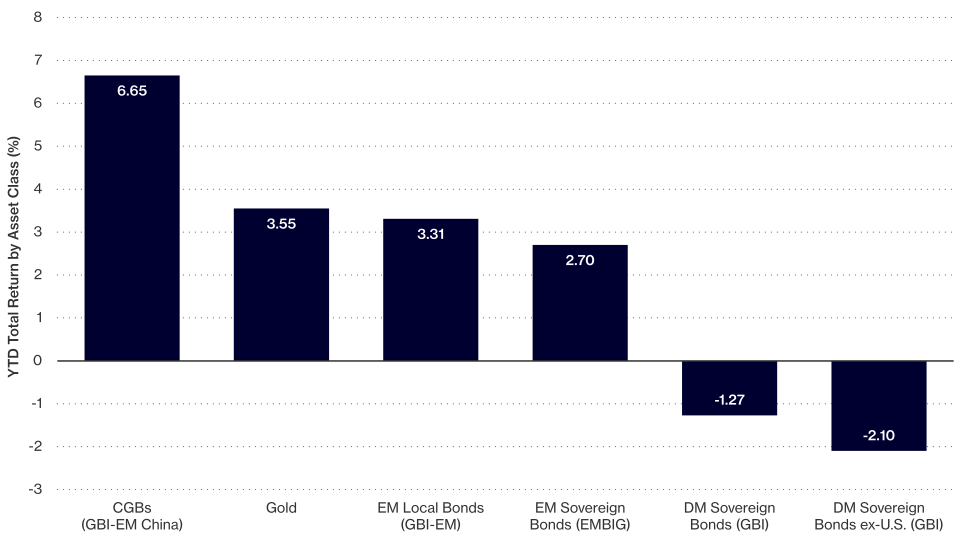
The ugly ducklings — asset classes such as EM bonds and gold — have been quacking even louder in August. They've been quacking for over a decade, arguably, but it was especially loud in August. EM bonds, gold, even Chinese government bonds are up decisively (Exhibit 1). Meanwhile the bird the farm always admired, US Treasuries, is down 1.55% year to date, against 4.17% for the ducklings. Five hundred and seventy-two basis points, and the sign is on the wrong side for the asset that is supposed to be the anchor of the system.
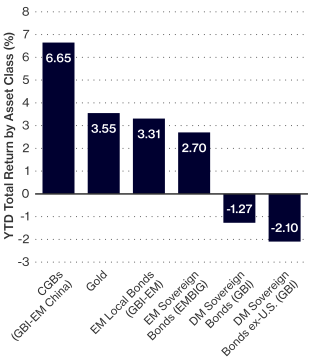
We've been tracking this story for years with you, so you'll get our point — in our view, these pressures are becoming increasingly difficult to ignore. The chart below barely earns its place; at this stage the story tells itself. It shows EM local currency bonds, gold, and Chinese government bonds performing well in a year when the assets built to absorb risk did not.
Exhibit 1 – EM Bonds, Gold, and China Win/Treasuries Lose
Source: Bloomberg. Data as of September 2026.
Andersen's point was that the ducklings were always swans. Our argument since the global financial crisis has been that EMs generally have lower debt and DMs higher, and that many flows from (and is reflected in) this initial condition. The ugly ducklings were always swans, it just takes time for the farm to realize. I'm sure you sense it on many levels. On a personal level, having grown up as a youth and adult in some "emerging markets", I was struck by the swans being called ugly ducklings by my compatriots, a classic of colonialism. You might notice the same in discussions on China — is China really shining all-of-a-sudden, or are our blinders being removed? Thank goodness markets exist. Are central banks that end up enabling a fiscal authority and using the income-inequality-magnifying "portfolio balance channel" (i.e., ginning up markets) ending badly, new news? Thank goodness for currency markets. EM bonds have been performing like swans for over a decade (see our white papers on the asset class) but are still called ugly ducklings.
Our framing is intentional. Much of what we observe in markets is an unveiling or dawning, more than actual news. Japan and the UK's debt, its currency implications, and thus its implications for the Eurodollar system were always there, as we've discussed with our dear readers over many years. Just as the low debt and independent central banks of many EMs were. It's normal for it to unfold this way — how many G-10 sell-side economists (your author is a 'recovered' one) talked about loss of USD reserve status or gold, other than in the past year or so after it was forced on them by global central bank action?
Your author spent many wonderful (seriously) hours debating his G-10 economist colleagues. My argument was that all of their charts were wrong, because they assume or imply that FX=1. Think about it; think of every chart you were taught with, they all assume an FX whose value is 1. Unless, of course, you don't assume FX=1, which is our more complicated world, which is a world in which "fiscal dominance" is not only not a fringe scenario, but also looks like the logical endpoint. In all those hours, the only counter I ever received was that this is unlikely, or distant. Still think so?
Recommended subscription
Exposure Types and Significant Changes
The changes to our top positions are summarized below. Our largest positions in August were South Africa, Mexico, China, Poland and Brazil:
- We increased our local currency exposure in South Africa and Thailand. South Africa’s valuations look more attractive, just as inflation is getting back under control and the budget is benefiting from commodity prices. In terms of our investment process, this strengthened the technical and economic test scores for the country. Thailand’s budget and external accounts benefit from energy relief, whereas exports (especially electronics) remained resilient. Low inflation means no pressure on the central bank to hike any time soon. These factors improved the economic and policy test scores for Thailand.
- We also increased our local currency exposure in Hungary and Poland. Poland can benefit from the Eurozone association if the Fed will not hike in September. Low inflation, attractive valuations and the credible central bank provide a supportive backdrop, as regards economic, technical, and policy test scores. Hungary’s exceptionally low inflation and the euro-adoption path should support further policy easing, improving the country’s policy test score.
- Finally, we increased our local currency exposure in Brazil and Mexico. The change in Mexico reflected price appreciation, whereas the underlying driver in Brazil is the upcoming presidential election, aided by softening growth and the fading energy shock. The opposition candidate’s polls are improving – and with them the market hope that Brazil’s fiscal issues can finally be addressed. In terms of our investment process, this improved the policy test score for the country.
- We reduced our local currency exposure in Uganda and the Philippines. The Philippine central bank is taking pro-active steps to bring inflation lower, so we used this moment to take partial profits, as the policy test score is becoming less supportive. Taking profits against the backdrop of less compelling valuations was the key driver in Uganda as well.
- We also reduced our sovereign hard currency exposure in Tunisia. The bond staged a nice rally in the summer, and we decided to take profits on the position.
- Finally, we reduced our hard currency sovereign exposure in Israel. The decision reflected two factors. First, there is still no clear path toward the resolution of the Middle East crisis. Second, “risk-free” duration is under pressure, and EM Graduates like Israel might be exposed due to relatively tight spreads. In terms of our investment process, this worsened the policy and technical test scores for the country.
EMBX | VanEck Emerging Markets Bond ETF
To receive more Emerging Markets Bonds insights, sign up in our subscription center.

Important Disclosures
There is no guarantee that these conditions will persist or that the fund will achieve similar results in the future.
This is not an offer to buy or sell, or a recommendation to buy or sell any of the securities, financial instruments or digital assets mentioned herein. The information presented does not involve the rendering of personalized investment, financial, legal, tax advice, or any call to action. Certain statements contained herein may constitute projections, forecasts and other forward-looking statements, which do not reflect actual results, are for illustrative purposes only, are valid as of the date of this communication, and are subject to change without notice. Actual future performance of any assets or industries mentioned are unknown. Information provided by third party sources are believed to be reliable and have not been independently verified for accuracy or completeness and cannot be guaranteed. VanEck does not guarantee the accuracy of third party data. The information herein represents the opinion of the author(s), but not necessarily those of VanEck or its other employees.
Duration measures a bond’s sensitivity to interest rate changes that reflects the change in a bond’s price given a change in yield. This duration measure is appropriate for bonds with embedded options. Carry is the benefit or cost for owning an asset. Yield to worst is a measure of the lowest possible yield that can be received on a bond with an early retirement provision. Averages are market weighted. The yields presented do not represent the performance of the Fund. These statistics do not take into account fees and expenses associated with investments of the Fund.
30-Day SEC Yield is a standard yield calculation developed by the Securities and Exchange Commission that allows for fairer comparisons among funds. It is based on the most recent 30-day period. This yield figure reflects the interest earned during the period after deducting the Fund’s expenses for the period. It does not reflect the yield an investor would have received if they had held the Fund over the last twelve months assuming the most recent NAV.
All indices are unmanaged and include the reinvestment of all dividends, but do not reflect the payment of transaction costs, advisory fees or expenses that are associated with an investment in the Fund. Certain indices may take into account withholding taxes. An index’s performance is not illustrative of the Fund’s performance. Indices are not securities in which investments can be made.
The Fund’s benchmark index (50% GBI-EM/50% EMBI) is a blended index consisting of 50% J.P. Morgan Government Bond Index-Emerging Markets (GBI-EM) Global Diversified and 50% J.P. Morgan Emerging Markets Bond Index (EMBI). The J.P. Morgan GBI-EM Global Diversified tracks local currency bonds issued by Emerging Markets governments. The J.P. Morgan EMBI Global Diversified tracks returns for actively traded external debt instruments in emerging markets, and is also J.P. Morgan’s most liquid U.S. dollar emerging markets debt benchmark.
The Bloomberg Global Aggregate Index measures the performance of global investment grade fixed income securities.
The FTSE 10-Year US Treasuries Index measures the return of the 10-year U.S. Treasury.
An investment in the VanEck Emerging Markets Bond ETF may be subject to risks which include, among others, risks related to active management, credit, credit-linked notes, currency management strategies, derivatives, emerging market issuers, ESG investing, foreign currency, foreign securities, hedging, high portfolio turnover, high yield securities, interest rate, market, non-diversified, operational, restricted securities, investing in other funds, sovereign bond, special risk considerations of investing in African, Asian, and Latin American issuers, authorized participant concentration, no guarantee of active trading market, trading issues, fund shares trading, premium/discount and liquidity of fund shares, and cash transactions risks, all of which may adversely affect the Fund. Emerging market issuers and foreign securities may be subject to securities markets, political and economic, investment and repatriation restrictions, different rules and regulations, less publicly available financial information, foreign currency and exchange rates, operational and settlement, and corporate and securities laws risks.
Investing involves substantial risk and high volatility, including possible loss of principal. An investor should consider the investment objective, risks, charges and expenses of a Fund carefully before investing. To obtain a prospectus and summary prospectus, which contain this and other information, call 800.826.2333 or visit vaneck.com. Please read the prospectus and summary prospectus carefully before investing.
© Van Eck Securities Corporation, Distributor, a wholly-owned subsidiary of Van Eck Associates Corporation.
Related Funds
Important Disclosures
There is no guarantee that these conditions will persist or that the fund will achieve similar results in the future.
This is not an offer to buy or sell, or a recommendation to buy or sell any of the securities, financial instruments or digital assets mentioned herein. The information presented does not involve the rendering of personalized investment, financial, legal, tax advice, or any call to action. Certain statements contained herein may constitute projections, forecasts and other forward-looking statements, which do not reflect actual results, are for illustrative purposes only, are valid as of the date of this communication, and are subject to change without notice. Actual future performance of any assets or industries mentioned are unknown. Information provided by third party sources are believed to be reliable and have not been independently verified for accuracy or completeness and cannot be guaranteed. VanEck does not guarantee the accuracy of third party data. The information herein represents the opinion of the author(s), but not necessarily those of VanEck or its other employees.
Duration measures a bond’s sensitivity to interest rate changes that reflects the change in a bond’s price given a change in yield. This duration measure is appropriate for bonds with embedded options. Carry is the benefit or cost for owning an asset. Yield to worst is a measure of the lowest possible yield that can be received on a bond with an early retirement provision. Averages are market weighted. The yields presented do not represent the performance of the Fund. These statistics do not take into account fees and expenses associated with investments of the Fund.
30-Day SEC Yield is a standard yield calculation developed by the Securities and Exchange Commission that allows for fairer comparisons among funds. It is based on the most recent 30-day period. This yield figure reflects the interest earned during the period after deducting the Fund’s expenses for the period. It does not reflect the yield an investor would have received if they had held the Fund over the last twelve months assuming the most recent NAV.
All indices are unmanaged and include the reinvestment of all dividends, but do not reflect the payment of transaction costs, advisory fees or expenses that are associated with an investment in the Fund. Certain indices may take into account withholding taxes. An index’s performance is not illustrative of the Fund’s performance. Indices are not securities in which investments can be made.
The Fund’s benchmark index (50% GBI-EM/50% EMBI) is a blended index consisting of 50% J.P. Morgan Government Bond Index-Emerging Markets (GBI-EM) Global Diversified and 50% J.P. Morgan Emerging Markets Bond Index (EMBI). The J.P. Morgan GBI-EM Global Diversified tracks local currency bonds issued by Emerging Markets governments. The J.P. Morgan EMBI Global Diversified tracks returns for actively traded external debt instruments in emerging markets, and is also J.P. Morgan’s most liquid U.S. dollar emerging markets debt benchmark.
The Bloomberg Global Aggregate Index measures the performance of global investment grade fixed income securities.
The FTSE 10-Year US Treasuries Index measures the return of the 10-year U.S. Treasury.
An investment in the VanEck Emerging Markets Bond ETF may be subject to risks which include, among others, risks related to active management, credit, credit-linked notes, currency management strategies, derivatives, emerging market issuers, ESG investing, foreign currency, foreign securities, hedging, high portfolio turnover, high yield securities, interest rate, market, non-diversified, operational, restricted securities, investing in other funds, sovereign bond, special risk considerations of investing in African, Asian, and Latin American issuers, authorized participant concentration, no guarantee of active trading market, trading issues, fund shares trading, premium/discount and liquidity of fund shares, and cash transactions risks, all of which may adversely affect the Fund. Emerging market issuers and foreign securities may be subject to securities markets, political and economic, investment and repatriation restrictions, different rules and regulations, less publicly available financial information, foreign currency and exchange rates, operational and settlement, and corporate and securities laws risks.
Investing involves substantial risk and high volatility, including possible loss of principal. An investor should consider the investment objective, risks, charges and expenses of a Fund carefully before investing. To obtain a prospectus and summary prospectus, which contain this and other information, call 800.826.2333 or visit vaneck.com. Please read the prospectus and summary prospectus carefully before investing.
© Van Eck Securities Corporation, Distributor, a wholly-owned subsidiary of Van Eck Associates Corporation.