AI Took the Spotlight. India Took the Hit.
November 19, 2026
Read Time 7 min
Key Takeaways
- US-quality compounding, with relatively low correlation to US equities. India’s leading companies compound like US peers, but on drivers of their own, so its returns are relatively less correlated to US equities than broad EM.
- Cheap, with catalysts lining up. The MSCI India PEG ratio has fallen sharply from its 2024 peak and is near its long-run average, while earnings growth is accelerating. Catalysts, including proposed reversal of 2024 capital gains tax policy for foreign investors, could get the market moving.
- The global AI trade is showing more uncertainty and risk. Crowding into AI helped leave India unloved and cheap. With investors heavy in AI and light in India, some of that money could find its way back, as Angus and JP argue here.
Views are those of the authors as of publication date, are subject to change, and are not a forecast or guarantee of future results. Forward-looking statements involve risk and may not occur. Investing in India involves substantial risks, including loss of principal. Not investment advice. See Important Disclosure below.
India is a rare story: a relatively simple, relatively low-correlated with US equities, case for compounding shareholder value, supported by reform, demographics, digitization and consistently high returns on equity.
India doesn’t move in a straight line (see chart below), but a bad patch is rarely a collapse. Usually the index drifts sideways while companies keep compounding real shareholder value, and the multiple absorbs the hit. Historically, those patches have given way to a powerful resumption of the trend, and I believe we are at that inflection point now. I’m not calling a trade. I see this as the potential end of India’s underperformance and the start of a period of improved returns, both absolute and relative.
India Isn’t Just Cheap
I’m skeptical of “buy it, it’s cheap” pitches. Most of the time, things look cheap because they deserve to, usually because earnings estimates are too high. India looks cheap, but not for that reason.
Earnings aren’t India’s problem. Sentiment is, and it has fallen to very low levels. On a two-week trip in September, almost everyone told me the macro was bad, and they meant it. I couldn’t find evidence of that. I saw the opposite and came home convinced the economy was running hotter than consensus. Earnings season then delivered a material upside surprise, just as several positive catalysts emerged. Hence this note.
Long-Term PEG Ratio Compared to MSCI India Performance
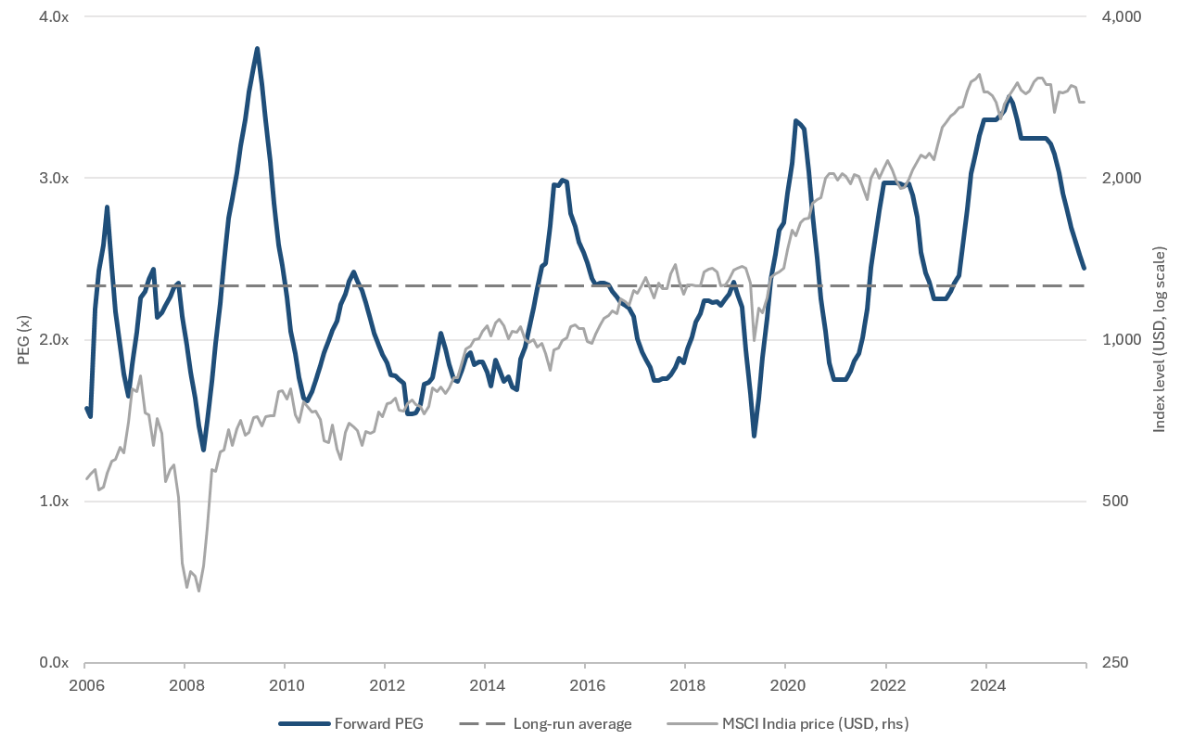
Source: Bloomberg, MSCI. MSCI India Index. PEG = next-12-month P/E divided by consensus next-12-month vs last-12-month EPS growth; 12-month average. Growth floored at 5%.
How India Got Left Behind, and Why It Matters for Your Portfolio
India rallied strongly for three or four years through 2024 and became expensive. It then missed the AI trade. Oil and tariff shocks followed, and the rupee weakened, feeding a negative loop made worse by the 2024 capital gains tax change. Even as valuations fell and results stayed strong, global and EM investors remained heavily overweight AI, the US, Korea and Taiwan.
That is now turning, and quickly. The AI trade is getting riskier just as real catalysts emerge on top of India’s cheap valuations.
Recommended subscription
The Catalysts Are Landing
Six weeks ago, I couldn’t point to a catalyst that had landed. Now I can point to several:
- Tax: SEBI has backed scrapping capital gains tax for foreign investors.
- Growth: October GST receipts rose 22.9% year on year, about three times GDP growth, and greenfield capex keeps climbing.1
- Positioning: the AI trade looks shaky, and investors are heavily exposed there and underweight India.
- Macro: the rupee has stabilized, oil is weaker and US tariff pressure is easing.
- Momentum: starting to turn.
Tax: The Nearest Catalyst
I think of this as a self-inflicted currency loop. Since 2024, India has taxed foreign investors on rupee gains with no allowance for currency moves. Buy at 83 rupees to the dollar, sell at 96, and you can owe tax on a gain while holding a dollar loss. So foreigners sell, the rupee falls, the hurdle rises, and they sell again. In every year since 2008 in which foreigners were net sellers, the rupee fell between 5% and 23%.2
Now there is a fix, and it has precedent. In June, the government exempted foreign bond investors to support the rupee. On November 2, Reuters reported that SEBI backs the same treatment for long-term equity gains. This could mean sign-off in weeks, not months. When it comes, there is the potential of flows and the rupee to turn sharply.
As of publication date of this content, the proposed capital gains tax exemption for foreign investors has not been enacted. Reports that SEBI supports the change reflect a recommendation only. Passage requires government action, and the timing and terms are uncertain, and the change may be delayed, modified, or not adopted.
What the Data Says
Since the market peaked two years ago, earnings at India’s 500 largest companies are up roughly 15%. Over two years, the MSCI India Index is down 14.6%, and the P/E has fallen from 26 to 20.3 This is a familiar Indian bad patch: the price marks time, the multiple absorbs the pain, and the compounding carries on.
Those profits have compounded at nearly 29% a year since 2020.4 On the MSCI India Index, the PEG ratio has fallen sharply from its 2024 peak and is near its long-run average, while earnings growth is accelerating.
Valuations suggest India potentially has limited room to fall. Earnings suggest the recovery doesn’t require heroic assumptions.
Positioning Is Upside Down
Foreigners have pulled a record $27 billion out of Indian stocks this year, and their ownership is at a fifteen-year low. India is about 8.5% of world output at purchasing-power parity but only 1.3% of the MSCI All Country World Index.5 This might signal that selling pressure is largely exhausted.
So where does the money go when it leaves the AI trade? India is one of very few places, in EM or globally, where valuation, catalysts and under-exposure line up at once. “I don’t own India because it has no AI” is exactly why I think investors should own it.
What Would Being Wrong Look Like?
As I’ve laid out, I see India as the clear beneficiary of everything going on, and I believe the conditions for outperformance are building. This isn’t a trade. It could be a turning point.
The risks are clear. First, the government could delay or dilute the tax change, though tax is no longer the only catalyst. Second, a liquidity event driven by US or European fiscal stress could send the dollar sharply higher, pressuring the rupee and delaying foreign flows. The offset is that with foreign ownership at a fifteen-year low, there is little left to sell.
I’m not calling the exact bottom. Cheap markets rise when they start rising, and under-held ones get noticed when they start hurting underweight portfolios. Once India turns, it could feed on itself: flows lift the rupee, the rupee lifts dollar returns, and returns pull in more flows. Waiting for confirmation could risk missing much of the move.
How to Act on It
Conviction is one thing. Implementation is another, and India is hard to own well. Indexes, and most of the ETFs that track them, capture the opportunity inefficiently, because much of the growth now comes from newer, technology-driven small and mid-caps that traditional benchmarks barely hold. That’s why we launched the VanEck India Select ETF (INDZ) this year. INDZ uses a systematic process, rebalanced twice a year, to target the highest-quality companies across all market capitalizations and capture return drivers not yet reflected in traditional benchmarks, while avoiding incumbents facing disruption.
INDZ | VanEck India Select ETF

Index Definitions
The MSCI India Index is designed to measure the performance of the large and mid-cap segments of the Indian equity market.
The BSE 500 Index is designed to be a broad representation of the Indian market. It consists of 500 companies listed on BSE Limited and covers all major industries in the Indian economy.
The MSCI All Country World Index (ACWI) captures large and mid-cap representation across developed and emerging market countries.
Sources:
1: Government of India provisional GST data, released Nov. 1, 2026; Ministry of Finance Monthly Economic Review, Oct. 2026 (7.35% real GDP growth estimate, Q2 FY27)
2-5: Bloomberg/VE Research as of 10/31/2026
IMPORTANT DISCLOSURES
VanEck only serves professional clients in countries where the funds are registered or where funds can be sold in accordance with local private placement rules.
This is not an offer to buy or sell, or a recommendation to buy or sell any of the securities, financial instruments or digital assets mentioned herein. The information presented does not involve the rendering of personalized investment, financial, legal, tax advice, or any call to action. Certain statements contained herein may constitute projections, forecasts and other forward-looking statements, which do not reflect actual results, are for illustrative purposes only, are valid as of the date of this communication, and are subject to change without notice. Actual future performance of any assets or industries mentioned are unknown. Information provided by third party sources are believed to be reliable and have not been independently verified for accuracy or completeness and cannot be guaranteed. VanEck does not guarantee the accuracy of third party data. The information herein represents the opinion of the author(s), but not necessarily those of VanEck or its other employees.
An investment in the Fund may be subject to risks which include, among others, special risk considerations of investing in Indian issuers, active management, materials sector, health care sector, consumer discretionary sector, convertible securities, depository receipts, emerging market issuers, equity securities, financials sector, foreign currency, foreign securities, high portfolio turnover, industrial sector, market, new fund, non-diversified, operational, preferred securities, small-, medium- and large-capitalization companies, authorized participant concentration, no guarantee of active trading market, trading issues, fund shares trading, premium/discount risk and liquidity of fund shares, and cash transactions risks, all of which may adversely affect the Fund. Emerging market issuers and foreign securities may be subject to securities markets, political and economic, investment and repatriation restrictions, different rules and regulations, less publicly available financial information, foreign currency and exchange rates, operational and settlement, and corporate and securities laws risks. Small-, medium- and large-capitalization companies may be subject to elevated risks.
The S&P 500 Index is a product of S&P Dow Jones Indices LLC and/or its affiliates and has been licensed for use by Van Eck Associates Corporation. Copyright © 2026 S&P Dow Jones Indices LLC, a division of S&P Global, Inc., and/or its affiliates. All rights reserved. Redistribution or reproduction in whole or in part are prohibited without written permission of S&P Dow Jones Indices LLC. For more information on any of S&P Dow Jones Indices LLC’s indices please visit https://www.spglobal.com/spdji/en/. S&P®is a registered trademark of S&P Global and Dow Jones®is a registered trademark of Dow Jones Trademark Holdings LLC. Neither S&P Dow Jones Indices LLC, Dow Jones Trademark Holdings LLC, their affiliates nor their third party licensors make any representation or warranty, express or implied, as to the ability of any index to accurately represent the asset class or market sector that it purports to represent and neither S&P Dow Jones Indices LLC, Dow Jones Trademark Holdings LLC, their affiliates nor their third party licensors shall have any liability for any errors, omissions, or interruptions of any index or the data included therein.
The S&P 500®Index consists of 500 widely held common stocks covering industrial, utility, financial and transportation sector; as an Index, it is unmanaged and is not a security in which investments can be made.
The MSCI India IMI Index is designed to measure the performance of the large, mid and small cap segments of the Indian market.
Index returns are not Fund returns and do not reflect any management fees or brokerage expenses. Certain indices may take into account withholding taxes. Investors can not invest directly in the Index. Returns for actual Fund investors may differ from what is shown because of differences in timing, the amount invested and fees and expenses. Index returns assume that dividends have been reinvested.
Investing involves substantial risk and high volatility, including possible loss of principal. An investor should consider the investment objective, risks, charges and expenses of the Fund carefully before investing. To obtain a prospectus and summary prospectus , which contains this and other information, call 800.826.2333 or visit vaneck.com/etfs . Please read the prospectus and summary prospectus carefully before investing.
VanEck mutual funds and ETFs are distributed by Van Eck Securities Corporation, Distributor, a wholly owned subsidiary of Van Eck Associates Corporation.
666 Third Avenue | New York, NY 10017
© 2026 VanEck. VanEck®, VanEck Access the opportunities®, and the stylized VanEck design®are trademarks of Van Eck Associates Corporation.
Related Funds
Index Definitions
The MSCI India Index is designed to measure the performance of the large and mid-cap segments of the Indian equity market.
The BSE 500 Index is designed to be a broad representation of the Indian market. It consists of 500 companies listed on BSE Limited and covers all major industries in the Indian economy.
The MSCI All Country World Index (ACWI) captures large and mid-cap representation across developed and emerging market countries.
Sources:
1: Government of India provisional GST data, released Nov. 1, 2026; Ministry of Finance Monthly Economic Review, Oct. 2026 (7.35% real GDP growth estimate, Q2 FY27)
2-5: Bloomberg/VE Research as of 10/31/2026
IMPORTANT DISCLOSURES
VanEck only serves professional clients in countries where the funds are registered or where funds can be sold in accordance with local private placement rules.
This is not an offer to buy or sell, or a recommendation to buy or sell any of the securities, financial instruments or digital assets mentioned herein. The information presented does not involve the rendering of personalized investment, financial, legal, tax advice, or any call to action. Certain statements contained herein may constitute projections, forecasts and other forward-looking statements, which do not reflect actual results, are for illustrative purposes only, are valid as of the date of this communication, and are subject to change without notice. Actual future performance of any assets or industries mentioned are unknown. Information provided by third party sources are believed to be reliable and have not been independently verified for accuracy or completeness and cannot be guaranteed. VanEck does not guarantee the accuracy of third party data. The information herein represents the opinion of the author(s), but not necessarily those of VanEck or its other employees.
An investment in the Fund may be subject to risks which include, among others, special risk considerations of investing in Indian issuers, active management, materials sector, health care sector, consumer discretionary sector, convertible securities, depository receipts, emerging market issuers, equity securities, financials sector, foreign currency, foreign securities, high portfolio turnover, industrial sector, market, new fund, non-diversified, operational, preferred securities, small-, medium- and large-capitalization companies, authorized participant concentration, no guarantee of active trading market, trading issues, fund shares trading, premium/discount risk and liquidity of fund shares, and cash transactions risks, all of which may adversely affect the Fund. Emerging market issuers and foreign securities may be subject to securities markets, political and economic, investment and repatriation restrictions, different rules and regulations, less publicly available financial information, foreign currency and exchange rates, operational and settlement, and corporate and securities laws risks. Small-, medium- and large-capitalization companies may be subject to elevated risks.
The S&P 500 Index is a product of S&P Dow Jones Indices LLC and/or its affiliates and has been licensed for use by Van Eck Associates Corporation. Copyright © 2026 S&P Dow Jones Indices LLC, a division of S&P Global, Inc., and/or its affiliates. All rights reserved. Redistribution or reproduction in whole or in part are prohibited without written permission of S&P Dow Jones Indices LLC. For more information on any of S&P Dow Jones Indices LLC’s indices please visit https://www.spglobal.com/spdji/en/. S&P®is a registered trademark of S&P Global and Dow Jones®is a registered trademark of Dow Jones Trademark Holdings LLC. Neither S&P Dow Jones Indices LLC, Dow Jones Trademark Holdings LLC, their affiliates nor their third party licensors make any representation or warranty, express or implied, as to the ability of any index to accurately represent the asset class or market sector that it purports to represent and neither S&P Dow Jones Indices LLC, Dow Jones Trademark Holdings LLC, their affiliates nor their third party licensors shall have any liability for any errors, omissions, or interruptions of any index or the data included therein.
The S&P 500®Index consists of 500 widely held common stocks covering industrial, utility, financial and transportation sector; as an Index, it is unmanaged and is not a security in which investments can be made.
The MSCI India IMI Index is designed to measure the performance of the large, mid and small cap segments of the Indian market.
Index returns are not Fund returns and do not reflect any management fees or brokerage expenses. Certain indices may take into account withholding taxes. Investors can not invest directly in the Index. Returns for actual Fund investors may differ from what is shown because of differences in timing, the amount invested and fees and expenses. Index returns assume that dividends have been reinvested.
Investing involves substantial risk and high volatility, including possible loss of principal. An investor should consider the investment objective, risks, charges and expenses of the Fund carefully before investing. To obtain a prospectus and summary prospectus , which contains this and other information, call 800.826.2333 or visit vaneck.com/etfs . Please read the prospectus and summary prospectus carefully before investing.
VanEck mutual funds and ETFs are distributed by Van Eck Securities Corporation, Distributor, a wholly owned subsidiary of Van Eck Associates Corporation.
666 Third Avenue | New York, NY 10017
© 2026 VanEck. VanEck®, VanEck Access the opportunities®, and the stylized VanEck design®are trademarks of Van Eck Associates Corporation.