Can Wells Fargo, Boeing and Biogen Add Value?
October 08, 2020
Read Time 7 MIN
Webinar Replay: Making Sense of Rising US Equity Valuations - Watch Now.
I’ve written frequently about market valuation in recent months, and for good reason. It’s no secret that a small number of stocks have accounted for a disproportionate amount of the market’s return. More and more U.S. stock investors are facing a difficult decision: do you stay on benchmark and seek little or no alpha, or do you underweight mega-cap, big tech stocks in favor of other potential opportunities in the market?
The risk of allocating to off-benchmark exposure has rewarded far fewer than it has punished over time, particularly in large cap U.S. stocks where the market is arguably most efficient. S&P Dow Jones Indices recently released their SPIVA® (S&P Indices Versus Active) results for Q2 2020 and found that for the trailing five years, far more actively managed U.S. large cap funds underperformed the S&P 500 Index than outperformed. Through June 30, 2020, 78% of funds underperformed for the five-year trailing period, 71% underperformed for the three-year trailing period, and 63% of funds underperformed for the one-year trailing period. That last stat is notable because well over half of active large cap funds failed to outperform the S&P 500 Index in a period that included significant market volatility, an environment where active management supposedly has the upper hand.
For the one-, three-, and five-year period cited in the SPIVA report, the Morningstar® Wide Moat Focus IndexSM (the “Index”) outperformed the S&P 500 Index, though there has been underperformance in the last three months driven by stock selection in several sectors, most notably industrials and tech.
Average Annualized Return (%)
As of June 30, 2020
| 1 Year | 3 Year | 5 Year | |
| Morningstar Wide Moat Focus Index | 10.49 | 11.78 | 13.47 |
| S&P 500 Index | 7.51 | 10.73 | 10.72 |
As of September 30, 2020
| 3 Month | 1 Year | 3 Year | 5 Year | |
| Morningstar Wide Moat Focus Index | 4.64 | 10.73 | 12.67 | 16.60 |
| S&P 500 Index | 8.93 | 15.15 | 12.28 | 14.14 |
Source: Morningstar. Returns for periods over one year have been annualized. Past performance is no guarantee of future results. An investor cannot invest directly in an index.
Impact of Moats and Valuations
Despite near-term headwinds, Morningstar’s valuation-driven investment philosophy has delivered outperformance versus the broad market since its inception in February 2007. Morningstar strategist, Andrew Lane, recently published a paper examining the impact of the Index’s three primary methodology features: economic moats, equal weighting and valuations. Over its history, each of these three features has incrementally improved the Index’s annualized outperformance.
First, and not uncommon in the market, the Index applies an equal-weighted approach, which allows each Index constituent to contribute to its total return as opposed to those indexes that favor larger, more liquid companies. Next, and more difficult to replicate, is Morningstar’s proprietary economic moat ratings and fair value assessments. Companies that receive Morningstar’s wide economic moat rating are members of an exclusive club that possess competitive advantages that Morningstar believes will allow them to maintain returns on invested capital in excess of their weighted average cost of capital for 20 or more years into the future.
However, Morningstar doesn’t necessarily view economic moat ratings as predictive of performance. Because wide moat companies are widely sought by investors, they tend to trade at higher multiples and are often difficult to find “on sale,” as Lane puts it. This is where Morningstar’s valuation framework comes in: the Index targets those wide moat companies trading at attractive valuations. This combination of equal weighting, wide economic moat ratings and attractive valuations is what has driven excess returns throughout the Index’s history.
Long-Term Outperformance vs Broad U.S. Market Driven by Moats, Valuations and Equal Weighting
Annualized Total Return 2/14/2007 – 9/30/2020
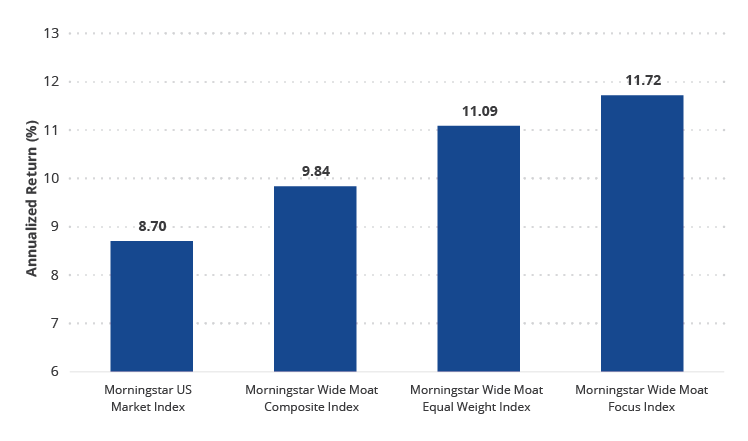
Source: Morningstar. Morningstar Wide Moat Focus Index inception date is 2/14/2007. Morningstar US Market Index represents 97% of US stock market capitalization. Morningstar Wide Moat Composite Index is a market-capitalization weighted index of all US wide moat companies. Morningstar Wide Moat Equal Weight Index is an equal-weighted index of all US wide moat companies. An investor cannot invest directly in an index.
Lane also assessed relative risk and risk-adjusted returns of the Morningstar Wide Moat Focus Index in the paper. To read the full report, click here.
Top Valuation Opportunities
With valuations top of mind, it’s worth highlighting a few of the most undervalued stocks in the Index. If Morningstar’s conviction is rewarded by way of the market realizing its current mispricing and stock prices rising toward fair value, the Index will benefit.
Wells Fargo & Co. (WFC): 48% Discount to Fair Value
Wells Fargo is a great example of a long-time index constituent that hasn’t been removed or seen its position scaled back in years. It was added in June 2016 and has remained since. This points to the persistent relative attractiveness of its market price relative to its Morningstar-assigned fair value. It is also one of the more commonly cited companies in questions we receive here at VanEck from investors and prospective investors. The bank has been subject to years of negative headlines, but according to Morningstar, it remains one of the top deposit gatherers in the U.S. The bank has easily out-earned its cost of equity for decades and continues to do so today, and Morningstar considers its wide moat rating to be stable.
Wells Fargo earns its wide moat rating based on cost advantages and switching costs. Morningstar cites the bank’s size and leading market share in many business units in which it competes. It has the largest retail branch network in the U.S., aiding its deposit gathering success. Its cost advantages stem from a low-cost deposit base, excellent operating efficiency and conservative underwriting. Notably, Wells Fargo fared better than many of its peers during the global financial crisis.
As of October 2, 2020, Wells Fargo was trading at a 48% discount to its $46 per share fair value estimate, assigned by Morningstar. This is despite a decrease in the bank’s fair value from $50 per share in mid July 2020, following earnings results and factoring a 50% chance of a Biden victory in November and implementation of his proposed tax plan. Morningstar believes the bank will face short- and mid-term headwinds by way of long-term low interest rates, fee income pressures, and potential increases in pandemic-driven credit losses. However, it also believes the bank will focus heavily on cutting expenses in 2021 and 2022, warranting its fair value assessment.
Boeing Co. (BA): 37% Discount to Fair Value
Boeing has also generated its fair share of headlines in recent months. It was a notable addition to the Index in March when it was trading at an all-time low of approximately 70% discount to its Morningstar fair value estimate. The aerospace and defense firm saw its Index weight increased in June because it remained attractively priced at the time.
As of October 2, 2020, Boeing traded at a 37% discount to its $264 per share Morningstar fair value estimate. Its fair value reflects an assumption by Morningstar that Boeing will receive an updated airworthiness directive from the FAA for its 737 MAX model early in the fourth quarter of 2020. The harder variable to predict is the impact the global pandemic will have on commercial airlines. Morningstar believes severe near-term decline in revenue will be followed by a sharp rebound in air traffic after a COVID-19 vaccine is available and well-distributed by mid-2021.
Due to the grounding of the 737 MAX, a demand backlog exists. Morningstar believes an industry shift toward narrow body aircrafts (737 MAX is a narrow body aircraft) will increase in the near term as wide-body aircraft demand recovers more slowly because of their use in longer haul trips, which will require a reliable vaccine before returning to pre-pandemic levels.
Biogen Inc. (BIIB): 29% Discount to Fair Value
Biogen has been an Index constituent since December 2015, though its weighting has scaled down and back up at various times based on changing valuation dynamics. Its current discount isn’t its lowest historically, but it is currently quite undervalued according to Morningstar.
Biogen earns a wide moat rating from its specialty-market-focused portfolio and novel, neurology-focused pipeline. Its leadership in multiple sclerosis (MS) and neurodegenerative diseases paired with its oncology collaboration with Roche have driven returns on invested capital above its cost of capital, and Morningstar forecasts they will remain well above for at least another 10 years.
Biogen’s fair value estimate was decreased in June from $413 per share to $389 per share, reflecting Morningstar’s Tecfidera (MS treatment) forecast paired with increases to expected generic competition following industry litigation. Much of Biogen’s fair value estimate is predicated on pipeline approvals in various segments, some of which are currently expected to be delayed based on recent coronavirus-related treatment delays.
VanEck Vectors Morningstar Wide ETF (MOAT) seeks to replicate as closely as possible, before fees and expenses the price and yield performance of the Morningstar Wide Moat Focus Index.
For further reading:
Important Disclosures
The information presented does not involve the rendering of personalized investment, financial, legal, or tax advice. Certain statements contained herein may constitute projections, forecasts and other forward looking statements, which do not reflect actual results, are valid as of the date of this communication and subject to change without notice. Information provided by third party sources are believed to be reliable and have not been independently verified for accuracy or completeness and cannot be guaranteed. The information herein represents the opinion of the author(s), but not necessarily those of VanEck.
This commentary is not intended as a recommendation to buy or to sell any of the sectors or securities mentioned herein. Holdings will vary for the MOAT ETF and its corresponding Index. For a complete list of holdings in the ETF, please click here: https://www.vaneck.com/etf/equity/moat/holdings/.
An investor cannot invest directly in an index. Returns reflect past performance and do not guarantee future results. Results reflect the reinvestment of dividends and capital gains, if any. Certain indices may take into account withholding taxes. Index returns do not represent Fund returns. The Index does not charge management fees or brokerage expenses, nor does the Index lend securities, and no revenues from securities lending were added to the performance shown.
Fair value estimate: the Morningstar analyst's estimate of what a stock is worth.
Price/Fair Value: ratio of a stock's trading price to its fair value estimate.
The Morningstar® Wide Moat Focus IndexSM was created and is maintained by Morningstar, Inc. Morningstar, Inc. does not sponsor, endorse, issue, sell, or promote the VanEck Vectors Morningstar Wide Moat ETF and bears no liability with respect to that ETF or any security. Morningstar® is a registered trademark of Morningstar, Inc. Morningstar® Wide Moat Focus IndexSM is a service mark of Morningstar, Inc.
The Morningstar® Wide Moat Focus IndexSM consists of U.S. companies identified as having sustainable, competitive advantages and whose stocks are attractively priced, according to Morningstar.
Effective June 20, 2016, Morningstar implemented several changes to the Morningstar Wide Moat Focus Index construction rules. Among other changes, the index increased its constituent count from 20 stocks to at least 40 stocks and modified its rebalance and reconstitution methodology. These changes may result in more diversified exposure, lower turnover and longer holding periods for index constituents than under the rules in effect prior to this date.
The S&P 500® Index is a product of S&P Dow Jones Indices LLC and/or its affiliates and has been licensed for use by Van Eck Associates Corporation. Copyright © 2020 S&P Dow Jones Indices LLC, a division of S&P Global, Inc., and/or its affiliates. All rights reserved. Redistribution or reproduction in whole or in part are prohibited without written permission of S&P Dow Jones Indices LLC. For more information on any of S&P Dow Jones Indices LLC’s indices please visit www.spdji.com. S&P® is a registered trademark of S&P Global and Dow Jones® is a registered trademark of Dow Jones Trademark Holdings LLC. Neither S&P Dow Jones Indices LLC, Dow Jones Trademark Holdings LLC, their affiliates nor their third party licensors make any representation or warranty, express or implied, as to the ability of any index to accurately represent the asset class or market sector that it purports to represent and neither S&P Dow Jones Indices LLC, Dow Jones Trademark Holdings LLC, their affiliates nor their third party licensors shall have any liability for any errors, omissions, or interruptions of any index or the data included therein.
An investment in the VanEck Vectors Morningstar Wide Moat ETF (MOAT®) may be subject to risks which include, among others, investing in equity securities, consumer discretionary, financials, health care, industrials and information technology sectors, medium-capitalization companies, market, operational, index tracking, authorized participant concentration, no guarantee of active trading market, trading issues, passive management, fund shares trading, premium/discount risk and liquidity of fund shares, non-diversified, and concentration risks, which may make these investments volatile in price or difficult to trade. Medium-capitalization companies may be subject to elevated risks.
Investing involves substantial risk and high volatility, including possible loss of principal. An investor should consider a Fund's investment objective, risks, charges and expenses carefully before investing. To obtain a prospectus and summary prospectus for VanEck Funds and VanEck Vectors ETFs, which contain this and other information, call 800.826.2333 or visit vaneck.com. Please read the prospectus and summary prospectus for VanEck Funds and VanEck Vectors ETFs carefully before investing.
Related Funds
Important Disclosures
The information presented does not involve the rendering of personalized investment, financial, legal, or tax advice. Certain statements contained herein may constitute projections, forecasts and other forward looking statements, which do not reflect actual results, are valid as of the date of this communication and subject to change without notice. Information provided by third party sources are believed to be reliable and have not been independently verified for accuracy or completeness and cannot be guaranteed. The information herein represents the opinion of the author(s), but not necessarily those of VanEck.
This commentary is not intended as a recommendation to buy or to sell any of the sectors or securities mentioned herein. Holdings will vary for the MOAT ETF and its corresponding Index. For a complete list of holdings in the ETF, please click here: https://www.vaneck.com/etf/equity/moat/holdings/.
An investor cannot invest directly in an index. Returns reflect past performance and do not guarantee future results. Results reflect the reinvestment of dividends and capital gains, if any. Certain indices may take into account withholding taxes. Index returns do not represent Fund returns. The Index does not charge management fees or brokerage expenses, nor does the Index lend securities, and no revenues from securities lending were added to the performance shown.
Fair value estimate: the Morningstar analyst's estimate of what a stock is worth.
Price/Fair Value: ratio of a stock's trading price to its fair value estimate.
The Morningstar® Wide Moat Focus IndexSM was created and is maintained by Morningstar, Inc. Morningstar, Inc. does not sponsor, endorse, issue, sell, or promote the VanEck Vectors Morningstar Wide Moat ETF and bears no liability with respect to that ETF or any security. Morningstar® is a registered trademark of Morningstar, Inc. Morningstar® Wide Moat Focus IndexSM is a service mark of Morningstar, Inc.
The Morningstar® Wide Moat Focus IndexSM consists of U.S. companies identified as having sustainable, competitive advantages and whose stocks are attractively priced, according to Morningstar.
Effective June 20, 2016, Morningstar implemented several changes to the Morningstar Wide Moat Focus Index construction rules. Among other changes, the index increased its constituent count from 20 stocks to at least 40 stocks and modified its rebalance and reconstitution methodology. These changes may result in more diversified exposure, lower turnover and longer holding periods for index constituents than under the rules in effect prior to this date.
The S&P 500® Index is a product of S&P Dow Jones Indices LLC and/or its affiliates and has been licensed for use by Van Eck Associates Corporation. Copyright © 2020 S&P Dow Jones Indices LLC, a division of S&P Global, Inc., and/or its affiliates. All rights reserved. Redistribution or reproduction in whole or in part are prohibited without written permission of S&P Dow Jones Indices LLC. For more information on any of S&P Dow Jones Indices LLC’s indices please visit www.spdji.com. S&P® is a registered trademark of S&P Global and Dow Jones® is a registered trademark of Dow Jones Trademark Holdings LLC. Neither S&P Dow Jones Indices LLC, Dow Jones Trademark Holdings LLC, their affiliates nor their third party licensors make any representation or warranty, express or implied, as to the ability of any index to accurately represent the asset class or market sector that it purports to represent and neither S&P Dow Jones Indices LLC, Dow Jones Trademark Holdings LLC, their affiliates nor their third party licensors shall have any liability for any errors, omissions, or interruptions of any index or the data included therein.
An investment in the VanEck Vectors Morningstar Wide Moat ETF (MOAT®) may be subject to risks which include, among others, investing in equity securities, consumer discretionary, financials, health care, industrials and information technology sectors, medium-capitalization companies, market, operational, index tracking, authorized participant concentration, no guarantee of active trading market, trading issues, passive management, fund shares trading, premium/discount risk and liquidity of fund shares, non-diversified, and concentration risks, which may make these investments volatile in price or difficult to trade. Medium-capitalization companies may be subject to elevated risks.
Investing involves substantial risk and high volatility, including possible loss of principal. An investor should consider a Fund's investment objective, risks, charges and expenses carefully before investing. To obtain a prospectus and summary prospectus for VanEck Funds and VanEck Vectors ETFs, which contain this and other information, call 800.826.2333 or visit vaneck.com. Please read the prospectus and summary prospectus for VanEck Funds and VanEck Vectors ETFs carefully before investing.