The World Has Changed. Portfolio Construction Should Too.
August 05, 2026
Read Time 6 MIN
Key Takeaways:
- AI leadership is unstable — own the picks and shovels, not the models
- The debasement trade isn't dead; fiscal reality outlasts any Fed chair
- Stocks and bonds now move together — real assets are the new diversifier
The World Has Changed. Portfolio Construction Should Too.
The Winners Keep Changing
Last year, AI leadership was largely defined by model performance and was owned by those with the deepest pockets. OpenAI and other U.S. technology companies were the leaders.
Today, the landscape looks very different.
- Cost matters. Competition is no longer based solely on performance.
- Open-source models have become credible alternatives.
- China has emerged as a serious competitor.
Exhibit 1 ranks AI models on a brutally hard benchmark where even the best score only 64.5/100. But the real story is how crowded the leaderboard has become, with models from Anthropic, Google, DeepSeek, Kimi, OpenAI, and others all clustered within striking distance of each other. What was once a two-horse race exploded into a global sprint, with new frontier models dropping every few weeks rather than every few years.
Exhibit 1: The AI Leaderboard Is Crowded
Best Overall (Humanity’s Last Exam)


Source: Vellum.ai. As of July 1, 2026.
They will likely continue to change. That should make investors humble.
The key question is no longer whether AI will transform the economy. The question is whether technological leadership can remain stable long enough for those investments to generate attractive returns.
Exhibit 2 demonstrates the unsustainable path of capex from the hyperscalers.
Exhibit 2: The CAPEX Path From Hyperscalers is Unsustainable
A generational transfer in free cash flow is taking place
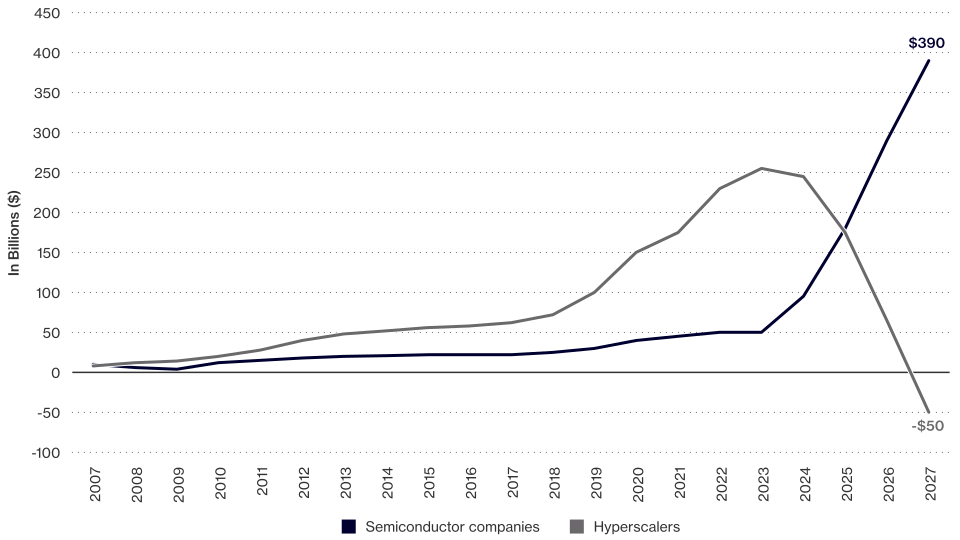
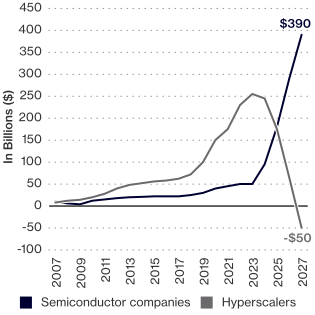
Source: BofA Research Investment Committee. Hyperscalers = AMZN, GOOGL, META, MSFT, ORCL. Semiconductor companies = NVDA, MU, AVGO & AMAT.
Then China's Kimi K3 dropped on July 17 and made it worse. If Beijing can compete at a fraction of the cost, the massive capex starts looking less like investment and more like exposure.
Wall Street is finally pushing back.
Exhibit 3: The Market Has Undergone a Significant Correction
Relative performance since 15-Jul-2026 (%)


Source: Bloomberg. These are not recommendations to buy or to sell any security.
Violent corrections are part of the game with disruptive technology. They reset expectations, shake out the weak hands, and allow more attractive entry points for those that are underexposed.
Follow the Physical Bottlenecks
While the technology winners continue to change, the physical requirements do not.
Every AI model runs on electricity, every data center demands power, and none of it moves without copper, steel, semiconductors, and the infrastructure to connect them.
Exhibit 4: Electricity Demand Is Accelerating
Global data centre electricity consumption, by equipment, Base Case, 2020–2030

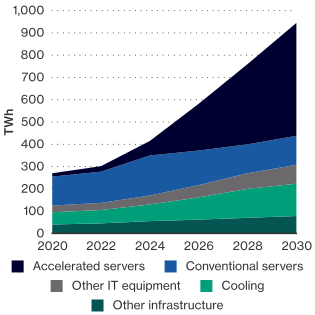
Source: IEA. Everything beyond 2024 is a projection.
The physical requirements are not optional.
Ignore the Noise. Focus on the Environment.
The capex cycle and the fiscal cycle are the same story. Markets are focused on what the Fed might do in the future. Simplify the problem. Focus on what the Fed can do over the long term.
Federal Reserve Chairman Kevin Warsh has made it clear that the Fed has "no tolerance for persistently elevated inflation." Markets believe him. Gold has fallen sharply since his nomination as investors priced in a structurally tighter monetary policy environment.
Exhibit 5: While Gold Has Fallen, The Debasement Trade Is Not Dead
Gold price ($/oz) since the Warsh nomination


Source: VanEck. Bloomberg. As of July 2026
The logical question: Is the debasement theme dead?
We don’t think so.
The long-term investment case for gold has never depended on one Fed Chair.
It depends on fiscal reality.
The United States did not arrive here because of AI.
Nor because of Iran.
Decades of deficit spending and rising public debt put us on this path.
AI infrastructure spending, higher defense spending and geopolitical uncertainty do not change that path.
They accelerate it.
The more demands placed on already stretched public balance sheets, the greater the long-term risk that monetary policy is eventually asked to do what fiscal policy could not.
That is why we continue to believe the long-term debasement thesis remains intact.
Just Diversify
Persistently elevated inflation and an AI-driven capital spending cycle are rewriting the rules of portfolio construction. Typically, stocks and bonds moved in opposite directions. Now they don't - stocks and bonds are positively correlated.
Exhibit 6: Stocks and Bonds are Now Positively Correlated

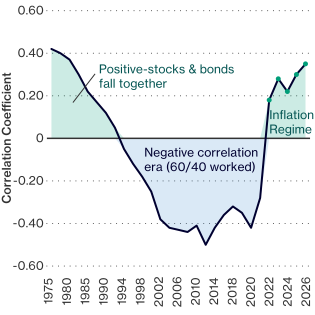
Source: VanEck, as of July 31, 2026. Rolling 5-year correlations based on monthly data.
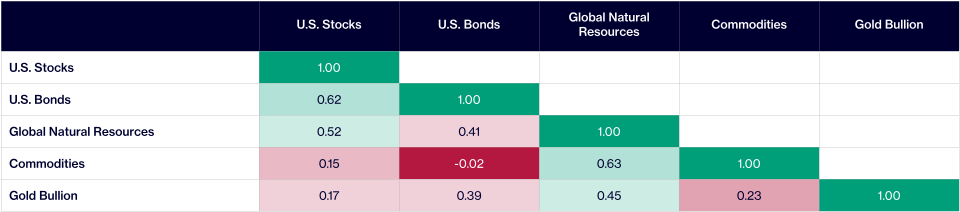
Real assets offer a differentiated risk profile that has benefited from the increased demand for the building blocks of the economy (commodities) and scarcity to protect against inflation.
Exhibit 7 demonstrates the low correlations between stocks and bonds to different real assets.
Exhibit 7: Real Assets Have Low Correlations to Stocks and Bonds
Correlation matrix — real assets vs stocks & bonds
Source: VanEck. Bloomberg. As of June 30, 2026.
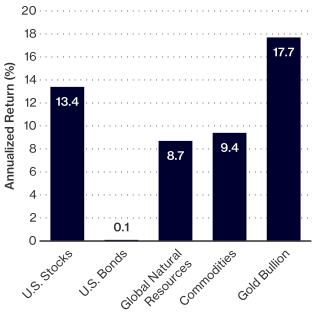
Over the past five years, real assets have also been among the strongest-performing asset classes.
Exhibit 8: Real Assets Have Been Among the Best Performers over the Last 5 Years
5-Year Annualized Returns

Source: VanEck. Bloomberg. As of June 30, 2026. Past performance is no guarantee of future results.
Recommended subscription
Our Playbook
- Maintain diversified equity exposure to participate in long-term growth.
- Overweight technology in a diversified way across the AI ecosystem rather than betting on single winners.
- Allocate to real assets. They benefit from the physical infrastructure AI requires while protecting against inflation and rising fiscal pressure.
Enjoy the rest of the summer.
Standardized Performance
| Strategy | Inception | 1M | 3M | YTD | 1Y | 3Y | 5Y | Since Incep. |
| Wealth Builder Plus Conservative Strategy | ||||||||
| Net | 7/1/2024 | -0.09 | 4.55 | 4.10 | 9.08 | -- | -- | 8.88 |
| Gross | 7/1/2024 | -0.09 | 4.55 | 4.10 | 9.08 | -- | -- | 8.88 |
| 20% ACWI/80% ICE US Broad Market Index | 0.03 | 3.35 | 2.69 | 7.34 | -- | -- | 7.60 | |
| Wealth Builder Plus Moderate Strategy | ||||||||
| Net | 7/1/2024 | -0.60 | 10.17 | 8.94 | 17.54 | -- | -- | 15.01 |
| Gross | 7/1/2024 | -0.60 | 10.17 | 8.94 | 17.54 | -- | -- | 15.01 |
| 60% ACWI/40% ICE US Broad Market Index | -0.43 | 8.80 | 6.55 | 14.58 | -- | -- | 12.94 | |
| Wealth Builder Plus Aggressive Strategy | ||||||||
| Net | 7/1/2024 | -0.72 | 13.11 | 11.56 | 22.29 | -- | -- | 18.34 |
| Gross | 7/1/2024 | -0.72 | 13.11 | 11.56 | 22.29 | -- | -- | 18.34 |
| 80% ACWI/20% ICE US Broad Market Index | -0.67 | 11.60 | 8.49 | 18.29 | -- | -- | 15.58 | |
| Thematic Disruption Strategy | ||||||||
| Net | 12/24/2021 | -0.62 | 31.65 | 25.42 | 39.66 | 26.19 | -- | 10.85 |
| Gross | 12/24/2021 | -0.61 | 31.68 | 25.49 | 39.80 | 26.40 | -- | 11.16 |
| MSCI ACWI IMI Growth Index | -0.74 | 19.78 | 11.65 | 24.89 | 21.38 | -- | 10.69 | |
| Real Assets Strategy | ||||||||
| Net | 07/01/2020 | -4.48 | -3.44 | 12.72 | 29.02 | 20.14 | 13.15 | 17.44 |
| Gross | 07/01/2020 | -4.48 | -3.44 | 12.72 | 29.02 | 20.25 | 13.44 | 17.78 |
| Bloomberg Commodity Index | -8.54 | -8.08 | 14.36 | 25.46 | 11.69 | 9.37 | 14.71 | |
| Real Assets Plus Strategy | ||||||||
| Net | 4/16/2024 | -4.98 | -3.79 | 10.64 | 24.48 | -- | -- | 20.61 |
| Select Opportunities Strategy | ||||||||
| Net | 12/20/2024 | -2.04 | 22.40 | 18.99 | 35.47 | -- | -- | 30.38 |
| Income Builder Strategy | ||||||||
| Net | 12/1/2005 | -0.31 | 0.62 | 1.44 | -- | -- | -- | 1.30 |
| Gross | 12/1/2005 | -0.31 | 0.62 | 1.44 | -- | -- | -- | 1.30 |
| ICE BofA US Broad Market Index | 0.25 | 0.71 | 0.77 | -- | -- | -- | 0.48 | |
The performance data quoted represents past performance. Past performance is not a guarantee of future results. Performance may be lower or higher than performance data quoted. Performance figures presented herein are preliminary and may differ slightly from final performance figures. Net and gross performance may be substantially similar when VanEck does not overlay a fee. Please contact us at [email protected] for additional information.
Source: VanEck. As of 6/30/2026. Returns greater than 1 year are annualized.
To receive more Model Portfolio insights, sign up in our subscription center.


Important Disclosures
This is not an offer to buy or sell, or a recommendation to buy or sell any of the securities, financial instruments or digital assets mentioned herein. The information presented does not involve the rendering of personalized investment, financial, legal, tax advice, or any call to action. Certain statements contained herein may constitute projections, forecasts and other forward-looking statements, which do not reflect actual results, are for illustrative purposes only, are valid as of the date of this communication, and are subject to change without notice. Actual future performance of any assets or industries mentioned are unknown. Information provided by third party sources are believed to be reliable and have not been independently verified for accuracy or completeness and cannot be guaranteed. VanEck does not guarantee the accuracy of third party data. The information herein represents the opinion of the author(s), but not necessarily those of VanEck or its other employees.
Any projections, market outlooks or estimates in this material are forward-looking statements and are based upon certain assumptions that are solely the opinion of VanEck. Any projections, outlooks or assumptions should not be construed to be indicative of the actual events which will occur. Further, any information regarding portfolio composition, portfolio composition methodology, investment process or limits, or valuation methods of evaluating companies and markets are intended as guidelines which may be modified or changed by VanEck at any time in its sole discretion without notice.
The models are not mutual funds or other types of securities and will not be registered with the Securities and Exchange Commission as investment companies under the Investment Company Act of 1940, as amended, and no units or shares of the models will be registered under the Securities Act of 1933, as amended, nor will they be registered with any state securities regulator. Accordingly, the models are not subject to compliance with the requirements of such acts.
The portfolio holdings presented represent securities held as of the period indicated and may not be representative of current or future investments. Such data may vary for each client in the strategy due to, but not limited to, asset size, market conditions, client guidelines and the diversity of portfolio holdings. Portfolio holdings are subject to change without notice and are being provided for illustrative purposes only. Nothing contained herein should be construed as (i) an offer to buy any security or (ii) a recommendation as to the advisability of investing in, purchasing or selling any security. This material is being provided for illustrative purposes only. Past performance is no guarantee of future results.
An investment in the strategies may be subject to risks which include, among others, equity securities, market, volatility, futures contract, investments related to bitcoin and bitcoin futures, derivatives, social media analytics, information technology, communication services, consumer discretionary, software and internet software, financials and semiconductor industries, emerging market securities, counterparty, foreign securities, foreign currency, non-U.S. issuers, investment capacity, target exposure and rebalancing, small- and medium-capitalization companies, borrowing and leverage, indirect investment, credit, interest rate, illiquidity, investing in other investment companies, management, non-diversified, operational, portfolio turnover, regulatory, repurchase agreements, tax, cash transactions, authorized participant concentration, no guarantee of active trading market, trading issues, fund shares trading, premium/discount and liquidity of fund shares, U.S. government securities, debt securities, municipal securities, securitized/asset-backed securities, and sovereign bond risks, all of which could significantly and adversely affect the strategies.
Digital asset investments are subject to significant risk and may not be suitable for all investors. Digital asset prices are highly volatile, and the value of digital assets, can rise or fall dramatically and quickly. If their value goes down, there's no guarantee that it will rise again. As a result, there is a significant risk of loss of your entire principal investment.
All investing is subject to risk, including the possible loss of the money you invest. As with any investment strategy, there is no guarantee that investment objectives will be met and investors may lose money. Diversification does not ensure a profit or protect against a loss in a declining market. Past performance is no guarantee of future performance.
Model Portfolio information is designed to be used by financial advisors solely as an educational resource, along with other potential resources advisors may consider, in providing services to their end clients. VanEck's Model Portfolios and related content are for information only and are not intended to provide, and should not be relied on for, tax, legal, accounting, investment or financial planning advice by VanEck, nor should any VanEck Model Portfolio information be considered or relied upon as investment advice or as a recommendation from VanEck, including regarding the use or suitability of any VanEck Model Portfolio, any particular security or any particular strategy. In providing VanEck Model Portfolio information, VanEck is not acting and has not agreed to act in an investment advisory, fiduciary or quasi-fiduciary capacity to any advisor or end client, and has no responsibility in connection therewith, and is not providing individualized investment advice to any advisor or end client, including based on or tailored to the circumstance of any advisor or end client. The Model Portfolio information is provided "as is," without warranty of any kind, express or implied. VanEck is not responsible for determining the securities to be purchased, held and/or sold for any advisor or end client accounts, nor is VanEck responsible for determining the suitability or appropriateness of a Model Portfolio or any securities included therein for any third party, including end clients. Advisors are solely responsible for making investment recommendations and/or decisions with respect to an end client, and should consider the end client's individual financial circumstances, investment time frame, risk tolerance level and investment goals in determining the appropriateness of a particular investment or strategy, without input from VanEck. VanEck does not have investment discretion and does not place trade orders for any end client accounts. Information and other marketing materials provided to you by VanEck concerning a Model Portfolio — including allocations, performance and other characteristics — may not be indicative of an end client's actual experience from investing in one or more of the funds included in a Model Portfolio. Using an asset allocation strategy does not ensure a profit or protect against loss, and diversification does not eliminate the risk of experiencing investment losses. There is no assurance that investing in accordance with a Model Portfolio's allocations will provide positive performance over any period. Any content or information included in or related to a VanEck Model Portfolio, including descriptions, allocations, data, fund details and disclosures are subject to change and may not be altered by an advisor or other third party in any way.
The S&P 500 Index is a product of S&P Dow Jones Indices LLC and/or its affiliates and has been licensed for use by Van Eck Associates Corporation. Copyright © 2024 S&P Dow Jones Indices LLC, a division of S&P Global, Inc., and/or its affiliates. All rights reserved. Redistribution or reproduction in whole or in part are prohibited without written permission of S&P Dow Jones Indices LLC. For more information on any of S&P Dow Jones Indices LLC's indices please visit https://www.spglobal.com/spdji/en/. S&P® is a registered trademark of S&P Global and Dow Jones® is a registered trademark of Dow Jones Trademark Holdings LLC. Neither S&P Dow Jones Indices LLC, Dow Jones Trademark Holdings LLC, their affiliates nor their third party licensors make any representation or warranty, express or implied, as to the ability of any index to accurately represent the asset class or market sector that it purports to represent and neither S&P Dow Jones Indices LLC, Dow Jones Trademark Holdings LLC, their affiliates nor their third party licensors shall have any liability for any errors, omissions, or interruptions of any index or the data included therein.
The S&P 500® Index consists of 500 widely held common stocks covering industrial, utility, financial and transportation sector; as an Index, it is unmanaged and is not a security in which investments can be made.
The UBS US Reshoring Index consists of a static basket of 39 US-listed common stocks covering the industrial, construction, materials and electrical-equipment sectors representing the US AI and reshoring theme; as an Index, it is unmanaged and is not a security in which investments can be made.
The Bloomberg Strait of Hormuz Tanker Vessel Crossings Index (TRHBTKCD Index) is based on AIS-based vessel tracking with a roughly 30-minute refresh and a rolling 24-hour window; as an Index, it is unmanaged and is not a security in which investments can be made.
GIPS Disclosures
Van Eck Associates Corporation ("VanEck") is an independent investment adviser registered under the Investment Advisers Act of 1940. VanEck, which commenced operations 1985 (predecessor company in 1955), provides investment advisory services to registered investment companies, other pooled investment vehicles, separate institutional clients, and private investment accounts.
VanEck claims compliance with the Global Investment Performance Standards (GIPS®) and has prepared and presented this report in compliance with the GIPS standards. VanEck has been independently verified for the periods January 1, 2006 through March 31, 2026. The verification reports are available upon request. A firm that claims compliance with the GIPS standards must establish policies and procedures for complying with all the applicable requirements of the GIPS standards. Verification provides assurance on whether the firm's policies and procedures related to composite and pooled fund maintenance, as well as the calculation, presentation, and distribution of performance, have been designed in compliance with the GIPS standards and have been implemented on a firm-wide basis. Verification does not provide assurance on the accuracy of any specific performance report. The Wealth Builder Models (Proprietary) composite's inception date is July 1, 2024 and the creation date is July 1, 2024. GIPS® is a registered trademark of CFA Institute. CFA Institute does not endorse or promote this organization, nor does it warrant the accuracy or quality of the content contained herein.
Wealth Builder Plus Moderate (Proprietary) is a diversified, risk-balanced portfolio of U.S. listed ETFs that gains exposure to key asset classes. These include, U.S., developed international and emerging market equities, U.S. investment grade, high yield and emerging market debt, and commodity futures, gold bullion and natural resource equities. Additionally, the strategy may gain exposure, through U.S. listed ETFs, to more differentiated assets, such as digital assets and high yield alternatives. The strategy will re-balance periodically to maintain diversification and its overall risk profile. The Wealth Builder Plus Moderate (Proprietary) risk level is moderate. 100% of composite assets are proprietary.
60% ACWI 40% US Broad Market Index (6040MOD) is a blended index of 60% MSCI ACWI and 40% ICE BofA US Broad Market Index. MSCI All Country World Index (MXWD) is a free float-adjusted market capitalization index designed to measure the combined equity market performance of developed and emerging markets countries. ICE BofA US Broad Market Index (US00) tracks the performance of US dollar denominated investment grade debt publicly issued and settled in the US domestic market, including US Treasury, quasi-government, corporate, securitized and collateralized securities.
Wealth Builder Plus Conservative (Proprietary) is a diversified, risk-balanced portfolio of U.S. listed ETFs that gains exposure to key asset classes. These include, U.S., developed international and emerging market equities, U.S. investment grade, high yield and emerging market debt, and commodity futures, gold bullion and natural resource equities. Additionally, the strategy may gain exposure, through U.S. listed ETFs, to more differentiated assets, such as digital assets and high yield alternatives. The strategy will re-balance periodically to maintain diversification and its overall risk profile. The Wealth Builder Plus Conservative (Proprietary) risk level is conservative. 100% of composite assets are proprietary.
20% ACWI 80% US Broad Market Index (2080CON) is a blended index of 20% MSCI ACWI and 80% ICE BofA US Broad Market Index. MSCI All Country World Index (MXWD) is a free float-adjusted market capitalization index designed to measure the combined equity market performance of developed and emerging markets countries. ICE BofA US Broad Market Index (US00) tracks the performance of US dollar denominated investment grade debt publicly issued and settled in the US domestic market, including US Treasury, quasi-government, corporate, securitized and collateralized securities.
Wealth Builder Plus Aggressive (Proprietary) is a diversified, risk-balanced portfolio of U.S. listed ETFs that gains exposure to key asset classes. These include, U.S., developed international and emerging market equities, U.S. investment grade, high yield and emerging market debt, and commodity futures, gold bullion and natural resource equities. Additionally, the strategy may gain exposure, through U.S. listed ETFs, to more differentiated assets, such as digital assets and high yield alternatives. The strategy will re-balance periodically to maintain diversification and its overall risk profile. The Wealth Builder Plus Aggressive (Proprietary) risk level is aggressive. 100% of composite assets are proprietary.
80% ACWI 20% US Broad Market Index (8020AGG) is a blended index of 80% MSCI ACWI and 20% ICE BofA US Broad Market Index. MSCI All Country World Index (MXWD) is a free float-adjusted market capitalization index designed to measure the combined equity market performance of developed and emerging markets countries. ICE BofA US Broad Market Index (US00) tracks the performance of US dollar denominated investment grade debt publicly issued and settled in the US domestic market, including US Treasury, quasi-government, corporate, securitized and collateralized securities.
The Thematic Disruption Strategy (Proprietary) composite is focused on disruptive, innovative and forward thinking themes across a wide array of industries, including technology, finance, healthcare, energy and retail. This strategy is adaptive and take advantage of economic opportunities as a result of novel and transformative discoveries. The portfolio construction process will simultaneously allow for overweighting the most financially lucrative innovations and managing risk vis a vis the correlations and volatilities of the ETFs in the investible universe. The Strategy utilizes the Russell 1000 Growth Total Return Index as a performance benchmark. 100% of composite assets are proprietary.
The MSCI ACWI IMI Growth Index is designed to capture large, mid, and small-cap securities exhibiting overall growth style characteristics across both Developed Markets (DM) and Emerging Markets (EM) countries. The growth investment style characteristics for index construction are defined using five variables: long-term forward earnings per share (EPS) growth rate, short-term forward EPS growth rate, current internal growth rate, long-term historical EPS growth trend, and long-term historical sales per share growth trend.
Real Assets (Proprietary) seeks long-term total return. In pursuing long-term total return, the composite seeks to maximize real returns while seeking to reduce downside risk during sustained market declines by allocating primarily to exchange-traded products that provides exposure to real assets, which include commodities, real estate, natural resources, and infrastructure. The composite seeks to reduce downside risk by using a rules based approach to determine when to allocate a portion or all of the composite's assets to cash and cash equivalents. 100% of composite assets are proprietary.
Bloomberg Commodity Index (BCOMTR) (the "index") and comprises exchange-traded future contracts on more than 20 commodities which are weighted to account for economic significance and market liquidity.
VanEck Income Builder Composite seeks enhanced returns relative to traditional core fixed income, while maintaining a comparable risk profile. The strategy will pursue this objective by: incorporating thematic sources of yield and total return; applying quantitatively informed portfolio construction focused on diversification and hedging; and embedding comprehensive risk management throughout the investment process.
The ICE BofA US Broad Market Index (US00) tracks the performance of US dollar denominated investment grade debt publicly issued and settled in the US domestic market, including US Treasury, quasi-government, corporate, securitized and collateralized securities.
The S&P 500 Index is a product of S&P Dow Jones Indices LLC and/or its affiliates and has been licensed for use by Van Eck Associates Corporation. Copyright © 2024 S&P Dow Jones Indices LLC, a division of S&P Global, Inc., and/or its affiliates. All rights reserved. Redistribution or reproduction in whole or in part are prohibited without written permission of S&P Dow Jones Indices LLC. For more information on any of S&P Dow Jones Indices LLC's indices please visit https://www.spglobal.com/spdji/en/. S&P® is a registered trademark of S&P Global and Dow Jones® is a registered trademark of Dow Jones Trademark Holdings LLC. Neither S&P Dow Jones Indices LLC, Dow Jones Trademark Holdings LLC, their affiliates nor their third party licensors make any representation or warranty, express or implied, as to the ability of any index to accurately represent the asset class or market sector that it purports to represent and neither S&P Dow Jones Indices LLC, Dow Jones Trademark Holdings LLC, their affiliates nor their third party licensors shall have any liability for any errors, omissions, or interruptions of any index or the data included therein.
The S&P 500® Index consists of 500 widely held common stocks covering industrial, utility, financial and transportation sector; as an Index, it is unmanaged and is not a security in which investments can be made.
The Bloomberg Aggregate Bond Index is a broad benchmark for the investment-grade, fixed-rate taxable bond market, including Treasuries, corporate, mortgage-backed, asset-backed, and government-related securities. It is a market capitalization-weighted index used by investors, bond traders, mutual funds, and ETFs to measure the performance of the U.S. dollar-denominated investment-grade bond market.
The composite returns represent the total returns of all fully discretionary portfolios within the strategies' mandate. The returns of the portfolio are time-weighted, based on trade date accounting. VanEck's policy is to accrue interest income and recognize dividend income and short dividend expense as reported on ex-dividend date. Interest income is recognized when received. Interest, dividends, and capital gains accrued on foreign securities are reported net of non-reclaimable foreign withholding taxes. Portfolio valuations are based on market values and expressed in US Dollars.
Composite returns are shown gross and net of management fees while including the reinvestment of all income. Brokerage and transaction expenses such as exchange, duty, and commission fees are deducted from trade amounts to determine net transaction costs/proceeds which are reflected in both gross and net returns. Net of fee performance is calculated by deducting actual management fees and in some instances, performance based fees charged to each account.
The composite returns represent past performance and are not reliable indicators of future results which may vary. The composite and comparative index returns can be found on the following page. Additional information regarding policies for valuing investments, calculating performance and preparing GIPS Reports are all available upon request.
Van Eck Associates Corporation (the "Adviser") has agreed to waive fees and/or pay Fund expenses to the extent necessary to prevent the operating expenses of the Fund (excluding acquired fund fees and expenses, trading expenses, taxes and extraordinary expenses). The expense limitation is expected to continue until the Fund's Board of Trustees acts to discontinue all or a portion of such expense limitation. A complete list of composite and limited distribution pooled fund descriptions and list of broad distribution pooled funds is available upon request.
Total Firm AUM include all discretionary and non-discretionary assets under management of VanEck, including all fee-paying accounts and accounts managed outside the Firm (e.g. by sub-advisers) where VanEck has allocation and selection authority. Firm proprietary accounts are included in the definition of firm assets. The three-year annualized standard deviation, gross of fees, found on the following page, measures the variability of the composite and the benchmark returns over the preceding 36 month period.
The significant cash flow policy has been suspended for this composite since its inception.
© Van Eck Associates Corporation.
Intelligently-designed exposure across asset classes for diversified portfolios
Important Disclosures
This is not an offer to buy or sell, or a recommendation to buy or sell any of the securities, financial instruments or digital assets mentioned herein. The information presented does not involve the rendering of personalized investment, financial, legal, tax advice, or any call to action. Certain statements contained herein may constitute projections, forecasts and other forward-looking statements, which do not reflect actual results, are for illustrative purposes only, are valid as of the date of this communication, and are subject to change without notice. Actual future performance of any assets or industries mentioned are unknown. Information provided by third party sources are believed to be reliable and have not been independently verified for accuracy or completeness and cannot be guaranteed. VanEck does not guarantee the accuracy of third party data. The information herein represents the opinion of the author(s), but not necessarily those of VanEck or its other employees.
Any projections, market outlooks or estimates in this material are forward-looking statements and are based upon certain assumptions that are solely the opinion of VanEck. Any projections, outlooks or assumptions should not be construed to be indicative of the actual events which will occur. Further, any information regarding portfolio composition, portfolio composition methodology, investment process or limits, or valuation methods of evaluating companies and markets are intended as guidelines which may be modified or changed by VanEck at any time in its sole discretion without notice.
The models are not mutual funds or other types of securities and will not be registered with the Securities and Exchange Commission as investment companies under the Investment Company Act of 1940, as amended, and no units or shares of the models will be registered under the Securities Act of 1933, as amended, nor will they be registered with any state securities regulator. Accordingly, the models are not subject to compliance with the requirements of such acts.
The portfolio holdings presented represent securities held as of the period indicated and may not be representative of current or future investments. Such data may vary for each client in the strategy due to, but not limited to, asset size, market conditions, client guidelines and the diversity of portfolio holdings. Portfolio holdings are subject to change without notice and are being provided for illustrative purposes only. Nothing contained herein should be construed as (i) an offer to buy any security or (ii) a recommendation as to the advisability of investing in, purchasing or selling any security. This material is being provided for illustrative purposes only. Past performance is no guarantee of future results.
An investment in the strategies may be subject to risks which include, among others, equity securities, market, volatility, futures contract, investments related to bitcoin and bitcoin futures, derivatives, social media analytics, information technology, communication services, consumer discretionary, software and internet software, financials and semiconductor industries, emerging market securities, counterparty, foreign securities, foreign currency, non-U.S. issuers, investment capacity, target exposure and rebalancing, small- and medium-capitalization companies, borrowing and leverage, indirect investment, credit, interest rate, illiquidity, investing in other investment companies, management, non-diversified, operational, portfolio turnover, regulatory, repurchase agreements, tax, cash transactions, authorized participant concentration, no guarantee of active trading market, trading issues, fund shares trading, premium/discount and liquidity of fund shares, U.S. government securities, debt securities, municipal securities, securitized/asset-backed securities, and sovereign bond risks, all of which could significantly and adversely affect the strategies.
Digital asset investments are subject to significant risk and may not be suitable for all investors. Digital asset prices are highly volatile, and the value of digital assets, can rise or fall dramatically and quickly. If their value goes down, there's no guarantee that it will rise again. As a result, there is a significant risk of loss of your entire principal investment.
All investing is subject to risk, including the possible loss of the money you invest. As with any investment strategy, there is no guarantee that investment objectives will be met and investors may lose money. Diversification does not ensure a profit or protect against a loss in a declining market. Past performance is no guarantee of future performance.
Model Portfolio information is designed to be used by financial advisors solely as an educational resource, along with other potential resources advisors may consider, in providing services to their end clients. VanEck's Model Portfolios and related content are for information only and are not intended to provide, and should not be relied on for, tax, legal, accounting, investment or financial planning advice by VanEck, nor should any VanEck Model Portfolio information be considered or relied upon as investment advice or as a recommendation from VanEck, including regarding the use or suitability of any VanEck Model Portfolio, any particular security or any particular strategy. In providing VanEck Model Portfolio information, VanEck is not acting and has not agreed to act in an investment advisory, fiduciary or quasi-fiduciary capacity to any advisor or end client, and has no responsibility in connection therewith, and is not providing individualized investment advice to any advisor or end client, including based on or tailored to the circumstance of any advisor or end client. The Model Portfolio information is provided "as is," without warranty of any kind, express or implied. VanEck is not responsible for determining the securities to be purchased, held and/or sold for any advisor or end client accounts, nor is VanEck responsible for determining the suitability or appropriateness of a Model Portfolio or any securities included therein for any third party, including end clients. Advisors are solely responsible for making investment recommendations and/or decisions with respect to an end client, and should consider the end client's individual financial circumstances, investment time frame, risk tolerance level and investment goals in determining the appropriateness of a particular investment or strategy, without input from VanEck. VanEck does not have investment discretion and does not place trade orders for any end client accounts. Information and other marketing materials provided to you by VanEck concerning a Model Portfolio — including allocations, performance and other characteristics — may not be indicative of an end client's actual experience from investing in one or more of the funds included in a Model Portfolio. Using an asset allocation strategy does not ensure a profit or protect against loss, and diversification does not eliminate the risk of experiencing investment losses. There is no assurance that investing in accordance with a Model Portfolio's allocations will provide positive performance over any period. Any content or information included in or related to a VanEck Model Portfolio, including descriptions, allocations, data, fund details and disclosures are subject to change and may not be altered by an advisor or other third party in any way.
The S&P 500 Index is a product of S&P Dow Jones Indices LLC and/or its affiliates and has been licensed for use by Van Eck Associates Corporation. Copyright © 2024 S&P Dow Jones Indices LLC, a division of S&P Global, Inc., and/or its affiliates. All rights reserved. Redistribution or reproduction in whole or in part are prohibited without written permission of S&P Dow Jones Indices LLC. For more information on any of S&P Dow Jones Indices LLC's indices please visit https://www.spglobal.com/spdji/en/. S&P® is a registered trademark of S&P Global and Dow Jones® is a registered trademark of Dow Jones Trademark Holdings LLC. Neither S&P Dow Jones Indices LLC, Dow Jones Trademark Holdings LLC, their affiliates nor their third party licensors make any representation or warranty, express or implied, as to the ability of any index to accurately represent the asset class or market sector that it purports to represent and neither S&P Dow Jones Indices LLC, Dow Jones Trademark Holdings LLC, their affiliates nor their third party licensors shall have any liability for any errors, omissions, or interruptions of any index or the data included therein.
The S&P 500® Index consists of 500 widely held common stocks covering industrial, utility, financial and transportation sector; as an Index, it is unmanaged and is not a security in which investments can be made.
The UBS US Reshoring Index consists of a static basket of 39 US-listed common stocks covering the industrial, construction, materials and electrical-equipment sectors representing the US AI and reshoring theme; as an Index, it is unmanaged and is not a security in which investments can be made.
The Bloomberg Strait of Hormuz Tanker Vessel Crossings Index (TRHBTKCD Index) is based on AIS-based vessel tracking with a roughly 30-minute refresh and a rolling 24-hour window; as an Index, it is unmanaged and is not a security in which investments can be made.
GIPS Disclosures
Van Eck Associates Corporation ("VanEck") is an independent investment adviser registered under the Investment Advisers Act of 1940. VanEck, which commenced operations 1985 (predecessor company in 1955), provides investment advisory services to registered investment companies, other pooled investment vehicles, separate institutional clients, and private investment accounts.
VanEck claims compliance with the Global Investment Performance Standards (GIPS®) and has prepared and presented this report in compliance with the GIPS standards. VanEck has been independently verified for the periods January 1, 2006 through March 31, 2026. The verification reports are available upon request. A firm that claims compliance with the GIPS standards must establish policies and procedures for complying with all the applicable requirements of the GIPS standards. Verification provides assurance on whether the firm's policies and procedures related to composite and pooled fund maintenance, as well as the calculation, presentation, and distribution of performance, have been designed in compliance with the GIPS standards and have been implemented on a firm-wide basis. Verification does not provide assurance on the accuracy of any specific performance report. The Wealth Builder Models (Proprietary) composite's inception date is July 1, 2024 and the creation date is July 1, 2024. GIPS® is a registered trademark of CFA Institute. CFA Institute does not endorse or promote this organization, nor does it warrant the accuracy or quality of the content contained herein.
Wealth Builder Plus Moderate (Proprietary) is a diversified, risk-balanced portfolio of U.S. listed ETFs that gains exposure to key asset classes. These include, U.S., developed international and emerging market equities, U.S. investment grade, high yield and emerging market debt, and commodity futures, gold bullion and natural resource equities. Additionally, the strategy may gain exposure, through U.S. listed ETFs, to more differentiated assets, such as digital assets and high yield alternatives. The strategy will re-balance periodically to maintain diversification and its overall risk profile. The Wealth Builder Plus Moderate (Proprietary) risk level is moderate. 100% of composite assets are proprietary.
60% ACWI 40% US Broad Market Index (6040MOD) is a blended index of 60% MSCI ACWI and 40% ICE BofA US Broad Market Index. MSCI All Country World Index (MXWD) is a free float-adjusted market capitalization index designed to measure the combined equity market performance of developed and emerging markets countries. ICE BofA US Broad Market Index (US00) tracks the performance of US dollar denominated investment grade debt publicly issued and settled in the US domestic market, including US Treasury, quasi-government, corporate, securitized and collateralized securities.
Wealth Builder Plus Conservative (Proprietary) is a diversified, risk-balanced portfolio of U.S. listed ETFs that gains exposure to key asset classes. These include, U.S., developed international and emerging market equities, U.S. investment grade, high yield and emerging market debt, and commodity futures, gold bullion and natural resource equities. Additionally, the strategy may gain exposure, through U.S. listed ETFs, to more differentiated assets, such as digital assets and high yield alternatives. The strategy will re-balance periodically to maintain diversification and its overall risk profile. The Wealth Builder Plus Conservative (Proprietary) risk level is conservative. 100% of composite assets are proprietary.
20% ACWI 80% US Broad Market Index (2080CON) is a blended index of 20% MSCI ACWI and 80% ICE BofA US Broad Market Index. MSCI All Country World Index (MXWD) is a free float-adjusted market capitalization index designed to measure the combined equity market performance of developed and emerging markets countries. ICE BofA US Broad Market Index (US00) tracks the performance of US dollar denominated investment grade debt publicly issued and settled in the US domestic market, including US Treasury, quasi-government, corporate, securitized and collateralized securities.
Wealth Builder Plus Aggressive (Proprietary) is a diversified, risk-balanced portfolio of U.S. listed ETFs that gains exposure to key asset classes. These include, U.S., developed international and emerging market equities, U.S. investment grade, high yield and emerging market debt, and commodity futures, gold bullion and natural resource equities. Additionally, the strategy may gain exposure, through U.S. listed ETFs, to more differentiated assets, such as digital assets and high yield alternatives. The strategy will re-balance periodically to maintain diversification and its overall risk profile. The Wealth Builder Plus Aggressive (Proprietary) risk level is aggressive. 100% of composite assets are proprietary.
80% ACWI 20% US Broad Market Index (8020AGG) is a blended index of 80% MSCI ACWI and 20% ICE BofA US Broad Market Index. MSCI All Country World Index (MXWD) is a free float-adjusted market capitalization index designed to measure the combined equity market performance of developed and emerging markets countries. ICE BofA US Broad Market Index (US00) tracks the performance of US dollar denominated investment grade debt publicly issued and settled in the US domestic market, including US Treasury, quasi-government, corporate, securitized and collateralized securities.
The Thematic Disruption Strategy (Proprietary) composite is focused on disruptive, innovative and forward thinking themes across a wide array of industries, including technology, finance, healthcare, energy and retail. This strategy is adaptive and take advantage of economic opportunities as a result of novel and transformative discoveries. The portfolio construction process will simultaneously allow for overweighting the most financially lucrative innovations and managing risk vis a vis the correlations and volatilities of the ETFs in the investible universe. The Strategy utilizes the Russell 1000 Growth Total Return Index as a performance benchmark. 100% of composite assets are proprietary.
The MSCI ACWI IMI Growth Index is designed to capture large, mid, and small-cap securities exhibiting overall growth style characteristics across both Developed Markets (DM) and Emerging Markets (EM) countries. The growth investment style characteristics for index construction are defined using five variables: long-term forward earnings per share (EPS) growth rate, short-term forward EPS growth rate, current internal growth rate, long-term historical EPS growth trend, and long-term historical sales per share growth trend.
Real Assets (Proprietary) seeks long-term total return. In pursuing long-term total return, the composite seeks to maximize real returns while seeking to reduce downside risk during sustained market declines by allocating primarily to exchange-traded products that provides exposure to real assets, which include commodities, real estate, natural resources, and infrastructure. The composite seeks to reduce downside risk by using a rules based approach to determine when to allocate a portion or all of the composite's assets to cash and cash equivalents. 100% of composite assets are proprietary.
Bloomberg Commodity Index (BCOMTR) (the "index") and comprises exchange-traded future contracts on more than 20 commodities which are weighted to account for economic significance and market liquidity.
VanEck Income Builder Composite seeks enhanced returns relative to traditional core fixed income, while maintaining a comparable risk profile. The strategy will pursue this objective by: incorporating thematic sources of yield and total return; applying quantitatively informed portfolio construction focused on diversification and hedging; and embedding comprehensive risk management throughout the investment process.
The ICE BofA US Broad Market Index (US00) tracks the performance of US dollar denominated investment grade debt publicly issued and settled in the US domestic market, including US Treasury, quasi-government, corporate, securitized and collateralized securities.
The S&P 500 Index is a product of S&P Dow Jones Indices LLC and/or its affiliates and has been licensed for use by Van Eck Associates Corporation. Copyright © 2024 S&P Dow Jones Indices LLC, a division of S&P Global, Inc., and/or its affiliates. All rights reserved. Redistribution or reproduction in whole or in part are prohibited without written permission of S&P Dow Jones Indices LLC. For more information on any of S&P Dow Jones Indices LLC's indices please visit https://www.spglobal.com/spdji/en/. S&P® is a registered trademark of S&P Global and Dow Jones® is a registered trademark of Dow Jones Trademark Holdings LLC. Neither S&P Dow Jones Indices LLC, Dow Jones Trademark Holdings LLC, their affiliates nor their third party licensors make any representation or warranty, express or implied, as to the ability of any index to accurately represent the asset class or market sector that it purports to represent and neither S&P Dow Jones Indices LLC, Dow Jones Trademark Holdings LLC, their affiliates nor their third party licensors shall have any liability for any errors, omissions, or interruptions of any index or the data included therein.
The S&P 500® Index consists of 500 widely held common stocks covering industrial, utility, financial and transportation sector; as an Index, it is unmanaged and is not a security in which investments can be made.
The Bloomberg Aggregate Bond Index is a broad benchmark for the investment-grade, fixed-rate taxable bond market, including Treasuries, corporate, mortgage-backed, asset-backed, and government-related securities. It is a market capitalization-weighted index used by investors, bond traders, mutual funds, and ETFs to measure the performance of the U.S. dollar-denominated investment-grade bond market.
The composite returns represent the total returns of all fully discretionary portfolios within the strategies' mandate. The returns of the portfolio are time-weighted, based on trade date accounting. VanEck's policy is to accrue interest income and recognize dividend income and short dividend expense as reported on ex-dividend date. Interest income is recognized when received. Interest, dividends, and capital gains accrued on foreign securities are reported net of non-reclaimable foreign withholding taxes. Portfolio valuations are based on market values and expressed in US Dollars.
Composite returns are shown gross and net of management fees while including the reinvestment of all income. Brokerage and transaction expenses such as exchange, duty, and commission fees are deducted from trade amounts to determine net transaction costs/proceeds which are reflected in both gross and net returns. Net of fee performance is calculated by deducting actual management fees and in some instances, performance based fees charged to each account.
The composite returns represent past performance and are not reliable indicators of future results which may vary. The composite and comparative index returns can be found on the following page. Additional information regarding policies for valuing investments, calculating performance and preparing GIPS Reports are all available upon request.
Van Eck Associates Corporation (the "Adviser") has agreed to waive fees and/or pay Fund expenses to the extent necessary to prevent the operating expenses of the Fund (excluding acquired fund fees and expenses, trading expenses, taxes and extraordinary expenses). The expense limitation is expected to continue until the Fund's Board of Trustees acts to discontinue all or a portion of such expense limitation. A complete list of composite and limited distribution pooled fund descriptions and list of broad distribution pooled funds is available upon request.
Total Firm AUM include all discretionary and non-discretionary assets under management of VanEck, including all fee-paying accounts and accounts managed outside the Firm (e.g. by sub-advisers) where VanEck has allocation and selection authority. Firm proprietary accounts are included in the definition of firm assets. The three-year annualized standard deviation, gross of fees, found on the following page, measures the variability of the composite and the benchmark returns over the preceding 36 month period.
The significant cash flow policy has been suspended for this composite since its inception.
© Van Eck Associates Corporation.